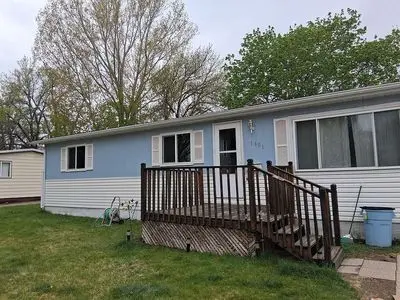
1119 University Dr · Bismarck, ND
Flood risk 4/10 · Minor
- FEMA flood zone
- X (shaded)
- Chance of flooding over 30 yrs
- 0.22%
- Est. flood insurance / yr
- $473 – $860
Fire risk 4/10 · Minor
- Est. fire insurance / yr
- $1,289 – $2,393
Heat risk 2/10 · Minimal
- Hot days now (above 97°F)
- 7 days/yr
- Hot days in 30 yrs
- 12 days/yr
Wind risk 2/10 · Minimal
- Chance of severe wind over 30 yrs
- —
Air-quality risk 4/10 · Minor
- Unhealthy air days now
- 5 days/yr
- Unhealthy air days in 30 yrs
- 5 days/yr
Risk factors via First Street. Map © Google.
Why this score? — see what drove the C- grade
The composite is a weighted blend of 9 inputs, each scored 0–100. Each bar is that input's sub-score; the figure is the points it added to the 100-point composite (weight × sub-score).
- Cash flow +15.0/30.0
- ARV discount +15.0/15.0
- 1% rule +5.0/10.0
- DSCR +5.0/10.0
- Livability +4.0/5.0
- Schools +3.7/10.0
- Rent growth +3.2/5.0
- Condition / age +2.5/5.0
- Appreciation +0.0/10.0
$25,000
🖨 Deal sheet (PDF) 📄 Offer letter ✓ Due diligence
Listing remarks MLS
* LT #1607-NEW HT TAPE, NEW DR LOCKS, NEW PAINT INSIDE, NEW PAIN ON SKIRTING & DECK, BATH PAINTED-ROOF COMPLETELY REDONE-10X12 ATTACHED SHED(ENTRY)-SHOWS WELL-NEW CRPT & VNYL-SKYWAY PK 1607-DOGS IN KENNLDO NOT LET OUT-MAY BITE Basement - NONE.
Key facts
- Built 1974
- Listed 32 days
Neighborhood map
What this means for you Summary
Snapshot
- This is a 3-bed/2.0-bath manufactured listed at $25k.
Deal economics
- At list price, monthly cash flow is $1k ($13k/yr) — positive.
- The deal already cash-flows at list — no discount required.
- Meets the 1% rule at list price ($2k rent vs $25k).
- Recommended offer: $24k (3.0% below list) — sets the bar for market timing.
- Cap rate 56.9% vs local median 3.1% in Bismarck — top-decile yield for the area; either an underpriced asset or a hidden risk that comps aren't pricing in. Stress-test before assuming the spread holds.
Location & tenants
- Location reads 79/100 on livability (#5 in ND, #2,213 nationally) — a middle-class / working-renter tenant base. Strengths: housing A+, health & safety A+, cost of living A; Watch: crime C-, amenities D+, commute F.
- Bismarck 1 (urban): math 41% / reading 42% proficiency, ranked #25 of 53 in ND (top 47%) — families likely to look elsewhere, expect single-tenant / working-renter base with shorter leases; only 19% free/reduced lunch — higher-income household profile.
- Zoned schools: Becep Center (332 students, 0% FRL); Wachter Middle School (math 34% / reading 34%, grade F, #26 of 35 statewide, top 79%, 1,000 students, 30% FRL); Bismarck High School (math 22% / reading 38%, grade F, #90 of 144 statewide, top 66%, 1,333 students, 27% FRL) — zoned schools at 19% FRL track the district average.
- Market conditions: Rents rising (+2.8%/yr); 261 active listings in the ZIP; 17 comparable units currently listed for rent nearby; rentals at typical pace (median 23d on market — plan ~3-4 weeks tenant-placement turnaround); solid renter incomes; 259 units permitted in Burleigh County in 2024 (0 in 5+ unit buildings).
Forward outlook
- Local home prices are declining (-3.0%/yr); year-one equity from $173 of loan paydown is wiped out by about $750 of value loss. Plan a longer hold.
- Burleigh County population projected at +61% by 2050 — long-run rental-demand tailwind backs the buy-and-hold thesis.
- At projected returns (-3.0% appreciation + 2.8% rent growth), your $7k cash investment doubles in ~1 year — after that, you're playing with house money.
Negotiation context
- It's been on market 32 days — a 3% lower offer ($24k) is reasonable based on typical stale-listing flexibility.
- 52 sale attempts since 34y ago; this cycle's ask is 2074% above the opening price — seller raised mid-cycle; expect resistance to lowballs.
Questions for the listing agent
- It's been on market 32 days. Have you received any prior offers? Is the seller open to a 3% concession, seller financing, or rate buy-down credit?
- Built in 1974 — when were the roof, HVAC, electrical panel, plumbing, and water heater last replaced?
- Is there a deadline driving the sale (1031 exchange, divorce, estate, relocation)? That informs how much negotiation room exists.
- Schools are B-rated — typically a magnet for longer-tenancy family renters. What's the average tenant stay here, and is there a school-zone premium baked into asking?
- What's the average days-on-market for RENTAL listings here right now (not sales)? A rising rental-DOM trend means longer vacancies and softer asking-rent achievability than the comps imply.
- What's the recent tenant-quality profile in this submarket — average credit score on applications, eviction rate, late-payment / NSF rate, and stable-employment percentage? A property-management company in the area should have these aggregated.
- How much new for-sale + rental construction is in the pipeline within 1–3 miles? Heavy new supply typically softens prices + rents 12–24 months out; constrained supply supports both.
Investment metrics
- 1% rule
- 6.21% ✓
- Cap rate
- 56.86%
- Cash-on-cash
- 180.59%
- DSCR
- 9.04
- GRM
- 1.3
CMA / ARV
- ARV (on-the-fly)
- $44,280
- Comps found
- 12
Show comp detail 12 sales within ~0.75 mi
| Address | Dist | Beds/Ba | Sqft | Sold | Price | $/sf | Match |
|---|---|---|---|---|---|---|---|
| 1119 University Dr #826 | 0.00mi | 3/1.0 | 1,120 (+4%) | 7mo | $46,000 | $41 | 84 |
| 232 Boeing Ave | 0.22mi | 3/2.0 | 1,056 (-2%) | 6mo | $25,000 | $24 | 81 |
| 1119 University Dr #1221 | 0.00mi | 3/1.0 | 952 (-12%) | 2mo | $22,000 | $23 | 75 |
| 135 Delta Ave | 0.30mi | 3/1.5 | 1,072 (-1%) | 16mo | $43,500 | $41 | 70 |
| 101 Northwest Dr | 0.18mi | 3/2.0 | 1,165 (+8%) | 12mo | $79,000 | $68 | 69 |
| 134 Maryland St | 0.36mi | 3/2.0 | 1,056 (-2%) | 18mo | $47,900 | $45 | 64 |
| 145 Georgia St | 0.30mi | 3/1.0 | 924 (-14%) | 2mo | $18,000 | $19 | 56 |
| 121 Georgia St | 0.33mi | 2/1.0 (-1) | 1,004 (-7%) | 13mo | $15,900 | $16 | 53 |
| 162 Northwest Dr | 0.38mi | 3/2.0 | 1,216 (+13%) | 15mo | $63,000 | $52 | 49 |
| 129 New Jersey St | 0.23mi | 3/2.0 | 1,216 (+13%) | 23mo | $72,900 | $60 | 49 |
| 113 New Jersey St | 0.28mi | 2/1.5 (-1) | 980 (-9%) | 24mo | $35,000 | $36 | 45 |
| 1620 Pennsylvania Ave | 0.48mi | 2/1.0 (-1) | 924 (-14%) | 10mo | $13,500 | $15 | 36 |
Match score weights: distance 35% · size 25% · config 20% · recency 20%. Top-matched comps best support the ARV.
Projected returns pro-forma
-3.0% appreciation · 2.81% rent growth · sell at horizon
- IRR
- —
- Equity multiple
- 9.97×
- Total profit
- $62,769
- Equity at exit
- $3,728
- IRR
- —
- Equity multiple
- 20.99×
- Total profit
- $139,935
- Equity at exit
- $2,162
Cash invested: $7,000 (down + closing). Projections, not guarantees.
Landlord ↔ Tenant lean methodology
- Overall (STATE)
- 82 Strongly Landlord-Friendly
- State North Dakota
- 82 Strongly Landlord-Friendly · R+20
- County
- — inherits STATE
- City
- — inherits STATE
ZIP-level market 58504
- Rents YoY
- 2.8%
- Active inventory
- 261
- Price-to-rent
- 1.3×
Monthly cashflow live
- Estimated rent
- $1,552 high interval (Pro) →
- Mortgage (P&I)
- −$131
- Tax est. 1.5%
- −$31 /mo · $375/yr
- Insurance
- −$10
- HOA
- −$0
- Vacancy / Maint / Mgmt
- −$326
- Net cashflow
- $1,053
Break-even live
Sensitivity live
| Price | -10% $1,071 | -5% $1,062 | +0% $1,053 | +5% $1,045 | +10% $1,036 |
|---|---|---|---|---|---|
| Rent | -10% $931 | -5% $992 | +0% $1,053 | +5% $1,115 | +10% $1,176 |
| Rate | -1.0pp $1,066 | -0.5pp $1,060 | base $1,053 | +0.5pp $1,047 | +1.0pp $1,040 |
UW: 25.0% down · 7.5% · 30yr · 1.5% tax · 5.0% vac · 8.0% maint · 8.0% mgmt
Financing live
Cash to close
- Down payment
- $6,250
- Closing costs
- $750
- Reserves months
- —
- Total cash needed
- —
Loan-product check · same deal, 3 products live
Conventional
25% down · 7.5% · 30yr
- Down + closing
- —
- Monthly P&I
- —
- Monthly cashflow
- —
- DSCR
- —
- Eligible?
- —
Personal DTI + credit; lowest rate.
DSCR
20% down · 8.5% · 30yr
- Down + closing
- —
- Monthly P&I
- —
- Monthly cashflow
- —
- DSCR
- —
- Eligible?
- —
No personal income docs; deal must DSCR.
Hard money
10% down · 12.0% · 12mo
- Down + closing
- —
- Monthly P&I
- —
- Monthly cashflow
- —
- DSCR
- —
- Eligible?
- —
Short-term bridge; refi at stabilization.
Rent comps 17 comps
| Address | Beds | Baths | Sqft | Rent | $/sqft | DOM | Units | Dist |
|---|---|---|---|---|---|---|---|---|
| 2020 S 12th St Bismarck, ND | 3.0 | 1.0–2.0 | 1185 | $1,955 | $1.65 | 22d | 19 | 0.59mi |
| 2130 S 12th St Bismarck, ND | 1.0–3.0 | 1.0–2.0 | 1152 | $1,980 | $1.72 | 22d | 12 | 0.70mi |
| 172 Boise Ave Bismarck, ND | 2.0 | 1.0 | 1200 | $1,050 | $0.88 | 22d | 1 | 0.71mi |
| 505 1/2 S 10th St Bismarck, ND | 3.0 | 1.0 | 1500 | $1,600 | $1.07 | 22d | 1 | 0.74mi |
| 215 E Arbor Ave Unit 205-305G Bismarck, ND | 2.0 | 2.0 | 1031 | $995 | $0.97 | 22d | 1 | 0.76mi |
| 215 E Arbor Ave Unit 201-302E Bismarck, ND | 2.0 | 1.0 | 1100 | $995 | $0.90 | 22d | 1 | 0.76mi |
| 205 E Arbor Ave Bismarck, ND | 2.0 | 2.0 | 1031 | $995 | $0.97 | 22d | 1 | 0.80mi |
| 201 E Arbor Ave Bismarck, ND | 2.0 | 1.0 | 1100 | $995 | $0.90 | 22d | 1 | 0.83mi |
| 1543 S Washington St Bismarck, ND | 3.0 | 2.0 | 1500 | $2,050 | $1.37 | 22d | 1 | 0.88mi |
| 407 N 12th St Unit 3/4 Bismarck, ND | 2.0 | 1.0 | 1100 | $1,200 | $1.09 | 22d | 1 | 1.30mi |
| 119 Irvine Loop Bismarck, ND | 3.0 | 1.0–2.0 | 974 | $2,400 | $2.46 | 22d | 1 | 1.32mi |
| 100 Santa Fe Ave Unit 1204 Bismarck, ND | 2.0 | 2.0 | 976 | $1,525 | $1.56 | 22d | 1 | 1.40mi |
| 100 Santa Fe Ave Unit 2210 Bismarck, ND | 2.0 | 2.0 | 1039 | $1,595 | $1.54 | 22d | 1 | 1.40mi |
| 100 Santa Fe Ave Unit 5214 Bismarck, ND | 2.0 | 2.0 | 1206 | $1,860 | $1.54 | 22d | 1 | 1.40mi |
| 100 Santa Fe Ave Unit 3111 Bismarck, ND | 2.0 | 2.0 | 1206 | $1,670 | $1.38 | 22d | 1 | 1.45mi |
| 100 Santa Fe Ave Unit 5322 Bismarck, ND | 2.0 | 2.0 | 1250 | $1,890 | $1.51 | 22d | 1 | 1.45mi |
| 2316 E Broadway Ave Bismarck, ND | 3.0 | 1.0 | 1113 | $1,250 | $1.12 | 22d | 1 | 1.48mi |
Listing history 50 events
-
2026-06-21days on market $25,000 Active 32 DOM
-
2026-06-19days on market $25,000 Active 30 DOM
-
2026-06-18days on market $25,000 Active 29 DOM
-
2026-06-17days on market $25,000 Active 28 DOM
-
2026-06-16days on market $25,000 Active 27 DOM
-
2026-06-15days on market $25,000 Active 26 DOM
-
2026-06-14days on market $25,000 Active 24 DOM
-
2026-06-13days on market $25,000 Active 23 DOM
-
2026-06-10days on market $25,000 Active 21 DOM
-
2026-06-09days on market $25,000 Active 20 DOM
-
2026-06-08days on market $25,000 Active 19 DOM
-
2026-06-07days on market $25,000 Active 18 DOM
-
2026-06-05days on market $25,000 Active 15 DOM
-
2026-06-03days on market $25,000 Active 14 DOM
-
2026-06-02days on market $25,000 Active 13 DOM
-
2026-06-01days on market $25,000 Active 12 DOM
-
2026-05-31days on market $25,000 Active 11 DOM
-
2026-05-30days on market $25,000 Active 10 DOM
-
2025-03-16historical $1,150
-
2025-03-11$1,150
-
2023-12-14historical $1,125
-
2023-11-17$1,125
-
1999-08-27soldstatus 255-char remark
Show marketing remark (255 chars)
* LT #1607-NEW HT TAPE, NEW DR LOCKS, NEW PAINT INSIDE, NEW PAIN ON SKIRTING & DECK, BATH PAINTED-ROOF COMPLETELY REDONE-10X12 ATTACHED SHED(ENTRY)-SHOWS WELL-NEW CRPT & VNYL-SKYWAY PK 1607-DOGS IN KENNLDO NOT LET OUT-MAY BITE Basement - NONE.
-
1999-08-18soldstatus 132-char remark
Show marketing remark (132 chars)
NEW CARPETS-CLEAN- STORM SHELTER-10X10 STOR SHED NEW '98-8X10 ENTRY-GOOD STARTER-NO DISCL OWNER NEVER LIVED IN HOME Basement - NONE.
-
1999-08-06soldstatus
-
1999-07-03$10,000
-
1999-07-01soldstatus
-
1999-06-15$21,900 255-char remark
Show marketing remark (255 chars)
* LT #1607-NEW HT TAPE, NEW DR LOCKS, NEW PAINT INSIDE, NEW PAIN ON SKIRTING & DECK, BATH PAINTED-ROOF COMPLETELY REDONE-10X12 ATTACHED SHED(ENTRY)-SHOWS WELL-NEW CRPT & VNYL-SKYWAY PK 1607-DOGS IN KENNLDO NOT LET OUT-MAY BITE Basement - NONE.
-
1999-06-03$6,500
-
1999-04-28soldstatus
-
1999-04-26soldstatus
-
1999-04-23soldstatus
-
1999-04-19soldstatus
-
1999-04-15soldstatus
-
1999-04-09$10,200 132-char remark
Show marketing remark (132 chars)
NEW CARPETS-CLEAN- STORM SHELTER-10X10 STOR SHED NEW '98-8X10 ENTRY-GOOD STARTER-NO DISCL OWNER NEVER LIVED IN HOME Basement - NONE.
-
1999-03-20$10,500
-
1999-03-12soldstatus
-
1999-02-26$13,000
-
1999-02-11$12,500
-
1999-02-06$12,900
-
1998-12-15soldstatus
-
1998-12-11$21,000
-
1998-10-30soldstatus
-
1998-09-28soldstatus
-
1998-07-31soldstatus
-
1998-07-31soldstatus
-
1998-07-16$9,500
-
1998-07-16$5,000
-
1998-07-09soldstatus
-
1998-07-07soldstatus
ⓘ Source: listings_history table (triggers on properties + properties_extension) + one-shot
backfill from property_details.listing_events for pre-trigger history.
Climate risk First Street
- Flood 4/10 Moderate FEMA zone X (shaded) · 22% chance over 30 yrs
- Wildfire 4/10 Moderate
- Heat 2/10 Low 7 d/yr ≥97°F today · 12 d/yr by 30 yrs out
- Wind 2/10 Low
- Air quality 4/10 Moderate 5 unhealthy d/yr today · 5 by 30 yrs out
Nearby sold comps map
Loading sold comps map…
Walkable amenities ~0.75 mi
Loading nearby amenities…
Taxation est. · year 1
- Rental income
- $18,626
- − Mortgage interest
- −$1,400
- − Property taxes
- −$375
- − Insurance
- −$125
- − Repairs & maintenance
- −$1,490
- − Management
- −$1,490
- − Depreciation
- −$727
- Taxable income
- $13,018
- Est. tax owed @ 24.0%
- −$3,124
- After-tax cash flow
- $9,517/yr
For passive investors: Depreciation is non-cash, so a rental often shows a tax loss while cash-flowing — sheltering income. Rental losses are passive: they offset passive income freely, and up to $25,000/yr can offset ordinary (W-2) income if you actively participate and your MAGI is under $100k (phasing out to $0 by $150k); unused losses carry forward. On sale, claimed depreciation is recaptured at up to 25%, and gains may owe capital-gains tax (a 1031 exchange can defer both). Figures are a year-1 estimate at your 24.0% rate — not tax advice; consult a CPA.
Schools (NCES district)
- District
- Bismarck 1
- NCES district ID
- 3800014
- Math proficiency
- 41% ▼ -5.00%
- Reading proficiency
- 42% ▼ -6.00%
- Median HH income
- $60,649
- Composite
- 36.76/100
- National rank
- #4577
- State rank
- #25 of 53 in ND
Livability — Bismarck
- Score
- 79/100
- State rank
- #5
- US rank
- #2213
Category grades
Schools grade is shown separately in the Schools card above.
Census & demographics
- Census place
- Bismarck, ND
- County
- Burleigh County · 97,300 people
- City population
- 97,300
- Metro
- Bismarck, ND
- Population (ZIP)
- 30,212
- Household income
- $85,637
- Rent vs Own
- Severe rent burden
- 400.0
Population outlook (Burleigh County) Hauer SSP2
- Today (2025)
- 119,359 people
- By 2030
- 133,047 · +11.5%
- By 2040
- 161,545 · +35.3%
- By 2050
- 191,960 · +60.8%
- By 2075
- 274,569 · +130.0%
- By 2100
- 350,910 · +194.0%
Race, ethnicity, and origin ACS 2023
- Neighborhood character
- Predominantly White (84%)
- Race & ethnicity
- White 84% Native American 8% Two or more races 5% Hispanic / Latino 4%
- Common ancestry
- Portuguese 13% Scotch-Irish 5% Romanian 2%
- Foreign-born
- 2% · Canada
- Languages at home
- 97% English-only · Spanish 2%
Political lean MEDSL · Burleigh
- 2024 margin
- Solid R (+43.2) · D 27.5% · R 70.7% · Other 1.8%
- 2008→2024 swing
- -19.7pp toward R · 2008: -23.6pp · 2024: -43.2pp
- All cycles
- 2024: R+43.2 2020: R+40.2 2016: R+46.1 2012: R+32.1 2008: R+23.6
Not yet ingested
- Civics
- —
Market trends
- HPI YoY
- ▼ -158.70%
- Current HPI
- 210.0651
- Rent YoY
- ▲ 2.81%
- Metro
- Bismarck, ND
- State GDP YoY
- ▲ 2.09%
- F500 in state
- 2
Industry mix (Fortune 500 HQ in ND)
| Industry | F500 HQs | Revenue |
|---|---|---|
| Utilities / Construction | 1 | $6B |
|
||
Price history
-93.4% since first listed104 events — show timeline
- 2025-03-16 Rental Removed $1,150 APPFOLIO
- 2025-03-11 Listed for Rent $1,150 APPFOLIO
- 2023-12-14 Rental Removed $1,125 APPFOLIO
- 2023-11-17 Listed for Rent $1,125 APPFOLIO
- 1999-08-27 Sold (MLS) — GNMLS
- 1999-08-18 Sold (MLS) — GNMLS
- 1999-08-06 Sold (MLS) — GNMLS
- 1999-07-03 Listed $10,000 GNMLS
- 1999-07-01 Sold (MLS) — GNMLS
- 1999-06-15 Listed $21,900 GNMLS
- 1999-06-03 Listed $6,500 GNMLS
- 1999-04-28 Sold (MLS) — GNMLS
- 1999-04-26 Sold (MLS) — GNMLS
- 1999-04-23 Sold (MLS) — GNMLS
- 1999-04-19 Sold (MLS) — GNMLS
- 1999-04-15 Sold (MLS) — GNMLS
- 1999-04-09 Listed $10,200 GNMLS
- 1999-03-20 Listed $10,500 GNMLS
- 1999-03-12 Sold (MLS) — GNMLS
- 1999-02-26 Listed $13,000 GNMLS
- 1999-02-11 Listed $12,500 GNMLS
- 1999-02-06 Listed $12,900 GNMLS
- 1998-12-15 Sold (MLS) — GNMLS
- 1998-12-11 Listed $21,000 GNMLS
- 1998-10-30 Sold (MLS) — GNMLS
- 1998-09-28 Sold (MLS) — GNMLS
- 1998-07-31 Sold (MLS) — GNMLS
- 1998-07-31 Sold (MLS) — GNMLS
- 1998-07-16 Listed $9,500 GNMLS
- 1998-07-16 Listed $5,000 GNMLS
- 1998-07-09 Sold (MLS) — GNMLS
- 1998-07-07 Sold (MLS) — GNMLS
- 1998-07-02 Listed $13,900 GNMLS
- 1998-06-30 Sold (MLS) — GNMLS
- 1998-06-16 Listed $19,000 GNMLS
- 1998-05-17 Listed $17,000 GNMLS
- 1998-05-13 Listed $4,600 GNMLS
- 1998-03-14 Listed $27,400 GNMLS
- 1998-03-14 Listed $8,500 GNMLS
- 1997-12-19 Sold (MLS) — GNMLS
- 1997-11-22 Listed $9,500 GNMLS
- 1997-10-07 Listed $9,500 GNMLS
- 1997-08-14 Sold (MLS) — GNMLS
- 1997-08-13 Sold (MLS) — GNMLS
- 1997-06-05 Sold (MLS) — GNMLS
- 1997-05-30 Sold (MLS) — GNMLS
- 1997-05-14 Sold (MLS) — GNMLS
- 1997-05-07 Listed $22,500 GNMLS
- 1997-04-26 Listed $13,900 GNMLS
- 1997-04-25 Listed $10,000 GNMLS
- 1997-04-25 Listed $33,900 GNMLS
- 1997-04-25 Sold (MLS) — GNMLS
- 1997-04-15 Sold (MLS) — GNMLS
- 1997-03-10 Listed $13,900 GNMLS
- 1997-01-12 Listed $8,500 GNMLS
- 1996-12-10 Listed $7,000 GNMLS
- 1996-09-09 Sold (MLS) — GNMLS
- 1996-08-28 Sold (MLS) — GNMLS
- 1996-08-26 Sold (MLS) — GNMLS
- 1996-08-16 Sold (MLS) — GNMLS
- 1996-08-12 Sold (MLS) — GNMLS
- 1996-07-22 Sold (MLS) — GNMLS
- 1996-07-18 Listed $16,500 GNMLS
- 1996-07-09 Listed $11,500 GNMLS
- 1996-06-28 Sold (MLS) — GNMLS
- 1996-06-21 Sold (MLS) — GNMLS
- 1996-06-10 Listed $11,500 GNMLS
- 1996-06-07 Listed $9,290 GNMLS
- 1996-06-01 Sold (MLS) — GNMLS
- 1996-05-28 Listed $13,500 GNMLS
- 1996-05-28 Sold (MLS) — GNMLS
- 1996-05-25 Listed $11,000 GNMLS
- 1996-05-16 Listed $8,900 GNMLS
- 1996-05-15 Listed $10,900 GNMLS
- 1996-04-25 Listed $22,900 GNMLS
- 1996-04-15 Listed $13,900 GNMLS
- 1996-03-08 Sold (MLS) — GNMLS
- 1996-02-28 Sold (MLS) — GNMLS
- 1996-02-15 Listed $17,900 GNMLS
- 1995-12-16 Listed $25,900 GNMLS
- 1995-09-21 Sold (MLS) — GNMLS
- 1995-08-24 Sold (MLS) — GNMLS
- 1995-08-08 Listed $18,000 GNMLS
- 1995-07-28 Sold (MLS) — GNMLS
- 1995-07-26 Listed $11,500 GNMLS
- 1995-06-19 Sold (MLS) — GNMLS
- 1995-05-12 Listed $10,500 GNMLS
- 1995-04-04 Listed $11,500 GNMLS
- 1995-03-24 Sold (MLS) — GNMLS
- 1995-03-23 Sold (MLS) — GNMLS
- 1995-02-01 Listed $21,500 GNMLS
- 1995-01-28 Listed $9,500 GNMLS
- 1995-01-13 Sold (MLS) — GNMLS
- 1995-01-06 Sold (MLS) — GNMLS
- 1994-12-15 Listed $11,500 GNMLS
- 1994-11-30 Listed $8,900 GNMLS
- 1994-09-23 Sold (MLS) — GNMLS
- 1994-08-03 Listed $12,500 GNMLS
- 1994-04-08 Sold (MLS) — GNMLS
- 1994-04-04 Listed $6,500 GNMLS
- 1993-07-27 Sold (MLS) — GNMLS
- 1993-07-01 Listed $14,500 GNMLS
- 1992-06-15 Sold (MLS) — GNMLS
- 1992-04-06 Listed $17,500 GNMLS
Cash-flow waterfall
monthlySold comps — $/sqft
last 12 mo · ≤1 miLoading sold comps…