 5-Plex
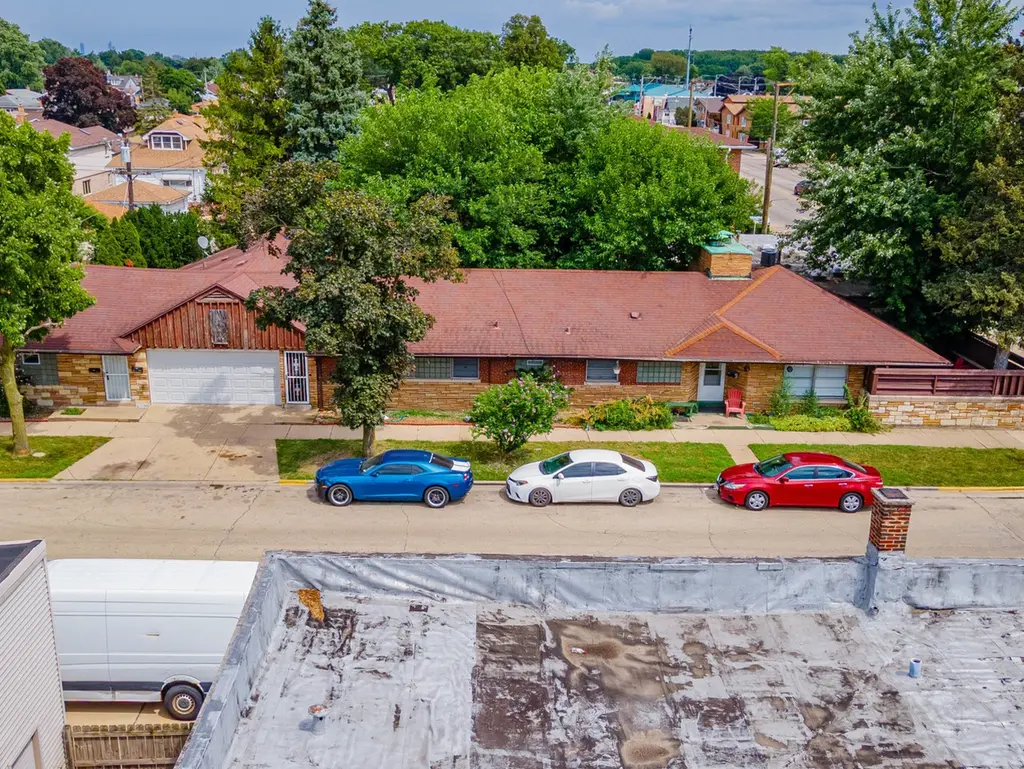
3847 Euclid Ave · Berwyn, IL
Flood risk 1/10 · Minimal
- FEMA flood zone
- X (unshaded)
- Chance of flooding over 30 yrs
- 0.0%
- Est. flood insurance / yr
- $473 – $860
Fire risk 1/10 · Minimal
- Est. fire insurance / yr
- $804 – $1,492
Heat risk 3/10 · Minor
- Hot days now (above 100°F)
- 7 days/yr
- Hot days in 30 yrs
- 15 days/yr
Wind risk 2/10 · Minimal
- Chance of severe wind over 30 yrs
- 1.0%
Air-quality risk 4/10 · Minor
- Unhealthy air days now
- 3 days/yr
- Unhealthy air days in 30 yrs
- 5 days/yr
Risk factors via First Street. Map © Google.
Why this score? — see what drove the B- grade
The composite is a weighted blend of 9 inputs, each scored 0–100. Each bar is that input's sub-score; the figure is the points it added to the 100-point composite (weight × sub-score).
- Cash flow +30.0/30.0
- 1% rule +10.0/10.0
- DSCR +10.0/10.0
- ARV discount +7.5/15.0
- Livability +4.2/5.0
- Rent growth +3.6/5.0
- Condition / age +2.5/5.0
- Schools +1.1/10.0
- Appreciation +0.0/10.0
$520,000
🖨 Deal sheet (PDF) 📄 Offer letter ✓ Due diligence
Multi-family units
County records classify this as Multi-Family (2-4 Unit). Listing-text estimate: 5 units. estimate disagrees with records
Listing remarks
Outstanding Investment Opportunity in a Prime Location! This well-maintained 5-unit property combines timeless charm with income-producing potential. Each unit is thoughtfully designed, featuring hardwood floors, cedar-lined closets, exposed wood-beam ceilings, and skylights that flood the interiors with natural light. A heated 2.5-car garage provides valuable convenience and storage options. The property boasts a proven rental history, offering steady cash flow and minimal vacancy rates, making it an ideal addition to any portfolio. Located in a highly desirable area, residents benefit from close proximity to local shops, dining, public transportation, and neighborhood amenities. Whether y
Key facts
- Heated garage
- Cedar lined closets
- 5 unit property
Tags
Property features AI
Finance
- Other: Annual tax amount reported (for reference): $17,465.82
- Financial info: Total monthly rental income reported around $4,315; Unit rents vary by unit type (examples: about $1,100 for a 3-bed unit; $925–$950 for some 2-bed units; approximately $835–$885 and $870–$900 ranges for other 2-bed units; about $585–$600 for 1-bed units); Gross rent multiplier reported as 8
Exterior
- Utilities: Water available; Electric service approximately 0 to 100 amps; Gas heat; Central air conditioning
- Home design: Multi-family building (5+ units); Individual ownership; Flat roof
- Construction: Brick construction; Foundations: block, brick/mortar, and concrete perimeter; Built before 1978
- Exterior features: City street frontage at a signalized intersection; Lot dimensions approximately 91 x 125; Zoned for multi-family use
Interior
- Kitchen: Multiple kitchens with a total of 5 ranges; Two dishwashers in the building
- Bedrooms: One 3-bedroom unit; Three 2-bedroom units; Two 1-bedroom units
- Bathrooms: Combination of full bathrooms across units (several with 1 full bath, one unit with 2 full baths)
- Interior features: Multiple unit layout (5 units total)
- Laundry & utility: Shared laundry with 1 washer and 1 dryer
Neighborhood map
What this means for you Summary
Snapshot
- This is a 5 × 6-bed/4.0-bath units multifamily listed at $520k.
Deal economics
- At list price, monthly cash flow is $4k ($46k/yr) — positive. Per door: $760/mo.
- The deal already cash-flows at list — no discount required.
- Meets the 1% rule at list price ($10k rent vs $520k).
- Recommended offer: $512k (1.5% below list) — sets the bar for market timing.
- Cap rate 15.1% vs local median 3.1% in Berwyn — top-decile yield for the area; either an underpriced asset or a hidden risk that comps aren't pricing in. Stress-test before assuming the spread holds.
Location & tenants
- Location reads 83/100 on livability (#46 in IL, #966 nationally) — a professional / high-income tenant draw. Strengths: commute A+, housing A+, crime A.
- J S Morton Hsd 201 (suburban): math 9% / reading 14% proficiency, ranked #557 of 620 in IL (top 90%) — low school quality limits family demand, transient renter base, plan for 1-2y turnover.
- Zoned schools: Irving Elem School (math 17% / reading 17%, grade F, #1,141 of 2,056 statewide, top 59%, 435 students, 0% FRL); Heritage Middle School (math 20% / reading 24%, grade F, #389 of 665 statewide, top 60%, 490 students, 0% FRL); J Sterling Morton West High Sch (math 11% / reading 17%, grade F, #495 of 693 statewide, top 72%, 3,533 students, 0% FRL).
- Market conditions: Rents rising fast (+4.6%/yr); 127 active listings in the ZIP; solid renter incomes; 6,272 units permitted in Cook County in 2024 (4,658 in 5+ unit buildings).
- At $10,310/mo this rent would consume 159% of the median local household income ($78k/yr) (locally 1998% of renters already pay >50% of income on rent) — very limited rent-growth headroom before tenants either downsize or default.
Forward outlook
- Local home prices are declining (-3.0%/yr); year-one equity from $4k of loan paydown is wiped out by about $16k of value loss. Plan a longer hold.
- At projected returns (-3.0% appreciation + 4.6% rent growth), your $146k cash investment doubles in ~4 years — after that, you're playing with house money.
Negotiation context
- It's been on market 21 days — a 2% lower offer ($512k) is reasonable based on typical stale-listing flexibility.
- 17 sale attempts since 15y ago with the ask held roughly flat each time — persistent listings suggest the price (not the market) is what's stuck; bring a comps-based counter.
- Current owner paid $347k; 50% above their basis — modest negotiation headroom, anchor on the comps not their cost.
Risks & watch-outs
- Watch-outs: property tax is 3.2% of price; built in 1948 — expect roof / HVAC / electrical / plumbing capex.
Questions for the listing agent
- Can we see the unit-by-unit rent roll, current vacancy, and any below-market leases? What's the average tenancy length?
- What capital expenditures (roof, boiler, parking lot, exteriors) have been made in the last 5 years, and what's planned in the next 2?
- Built in 1948 — when were the roof, HVAC, electrical panel, plumbing, and water heater last replaced?
- Property tax is high relative to price — has the assessment been appealed recently, and will the sale trigger a re-assessment?
- Is there a deadline driving the sale (1031 exchange, divorce, estate, relocation)? That informs how much negotiation room exists.
- Schools are D-rated, which usually means shorter tenancies and higher turnover. Who's the typical renter profile here, and what's been the actual vacancy rate?
- What's the average days-on-market for RENTAL listings here right now (not sales)? A rising rental-DOM trend means longer vacancies and softer asking-rent achievability than the comps imply.
- What's the recent tenant-quality profile in this submarket — average credit score on applications, eviction rate, late-payment / NSF rate, and stable-employment percentage? A property-management company in the area should have these aggregated.
- How much new apartment / multifamily construction is in the pipeline within 1–3 miles? Heavy new supply (>2% of stock underway) typically softens rents 12–24 months out; light construction supports rent growth.
Investment metrics
- 1% rule
- 1.98% ✓
- Cap rate
- 15.06%
- Cash-on-cash
- 31.33%
- DSCR
- 2.39
- GRM
- 4.2
CMA / ARV
No comps found within radius.
Projected returns pro-forma
-3.0% appreciation · 4.57% rent growth · sell at horizon
- IRR
- 28.2%
- Equity multiple
- 2.20×
- Total profit
- $174,992
- Equity at exit
- $77,534
- IRR
- 36.7%
- Equity multiple
- 4.69×
- Total profit
- $536,709
- Equity at exit
- $44,960
Cash invested: $145,600 (down + closing). Projections, not guarantees.
Landlord ↔ Tenant lean methodology
- Overall (STATE)
- 43 Moderately Tenant-Leaning
- State Illinois
- 43 Moderately Tenant-Leaning · D+7
- County
- — inherits STATE
- City
- — inherits STATE
ZIP-level market 60402
- Rents YoY
- 4.6%
- Active inventory
- 127
- Price-to-rent
- 21.0×
Monthly cashflow live
- Estimated rent
- $10,310 medium interval (Pro) →
- Mortgage (P&I)
- −$2,727
- Tax from tax record
- −$1,400 /mo · $16,802/yr
- Insurance
- −$217
- HOA
- −$0
- Vacancy / Maint / Mgmt
- −$2,165
- Net cashflow
- $3,801
Break-even live
Sensitivity live
| Price | -10% $4,096 | -5% $3,948 | +0% $3,801 | +5% $3,654 | +10% $3,507 |
|---|---|---|---|---|---|
| Rent | -10% $2,987 | -5% $3,394 | +0% $3,801 | +5% $4,208 | +10% $4,616 |
| Rate | -1.0pp $4,063 | -0.5pp $3,933 | base $3,801 | +0.5pp $3,666 | +1.0pp $3,529 |
5-unit breakdown (identical units grouped — click to expand)
| Units | Beds | Baths | Est. rent |
|---|---|---|---|
| 5× units | 6 | 4 | $10,310 |
| #1 | 6 | 4 | $2,062 |
| #2 | 6 | 4 | $2,062 |
| #3 | 6 | 4 | $2,062 |
| #4 | 6 | 4 | $2,062 |
| #5 | 6 | 4 | $2,062 |
| Total (5 units) | $10,310 | ||
UW: 25.0% down · 7.5% · 30yr · 1.5% tax · 5.0% vac · 8.0% maint · 8.0% mgmt
Financing live
Cash to close
- Down payment
- $130,000
- Closing costs
- $15,600
- Reserves months
- —
- Total cash needed
- —
Loan-product check · same deal, 3 products live
Conventional
25% down · 7.5% · 30yr
- Down + closing
- —
- Monthly P&I
- —
- Monthly cashflow
- —
- DSCR
- —
- Eligible?
- —
Personal DTI + credit; lowest rate.
DSCR
20% down · 8.5% · 30yr
- Down + closing
- —
- Monthly P&I
- —
- Monthly cashflow
- —
- DSCR
- —
- Eligible?
- —
No personal income docs; deal must DSCR.
Hard money
10% down · 12.0% · 12mo
- Down + closing
- —
- Monthly P&I
- —
- Monthly cashflow
- —
- DSCR
- —
- Eligible?
- —
Short-term bridge; refi at stabilization.
Listing history 50 events
-
2026-06-21days on market $520,000 Active 21 DOM
-
2026-06-18days on market $520,000 Active 18 DOM
-
2026-06-17days on market $520,000 Active 17 DOM
-
2026-06-16days on market $520,000 Active 16 DOM
-
2026-06-15days on market $520,000 Active 15 DOM
-
2026-06-13days on market $520,000 Active 13 DOM
-
2026-06-09days on market $520,000 Active 9 DOM
-
2026-06-08days on market $520,000 Active 8 DOM
-
2026-06-07days on market $520,000 Active 7 DOM
-
2026-06-04days on market $520,000 Active 4 DOM
-
2026-06-03days on market $520,000 Active 3 DOM
-
2026-06-02days on market $520,000 Active 2 DOM
-
2026-06-01days on market $520,000 Active 1 DOM
-
2026-05-31days on market $520,000 Active 30 DOM
-
2026-05-01$520,000 Active
-
2026-04-30historical
-
2026-03-24Active
-
2026-03-24historical
-
2026-03-12Active
-
2026-03-12historical
-
2025-12-03Active
-
2025-11-30historical
-
2025-11-02Active
-
2025-10-31historical
-
2025-10-15Active
-
2025-10-15historical
-
2025-09-30Active
-
2025-09-30historical
-
2025-09-04Active
-
2025-09-04historical
-
2025-08-19Active
-
2024-05-10historical $1,300
-
2024-05-04$1,300
-
2015-05-01soldstatus $347,000
-
2015-04-28soldstatus $347,000 Closed Sale
-
2015-04-16status Pending
-
2015-02-27historical Contingent
-
2014-10-01$358,000 New
-
2014-10-01historical
-
2014-07-03price Price Change
-
2014-04-23New
-
2014-04-01historical
-
2014-03-31price Price Change
-
2014-01-25price Price Change
-
2013-09-29New
-
2013-03-31historical
-
2012-09-27status Back On Market
-
2012-09-10historical
-
2012-08-31status Reactivated
-
2012-07-25historical Contingent
ⓘ Source: listings_history table (triggers on properties + properties_extension) + one-shot
backfill from property_details.listing_events for pre-trigger history.
Tax reassessment forecast IL · Partial reset (capped growth)
- Current annual tax
- $16,802 · $1,400/mo
- Projected year-2 tax
- $16,802 · $1,400/mo
- Expected delta
- $0/yr ($0/mo · 0.0%)
ⓘ Screening estimate from a state-policy table — verify with the county assessor before closing.
Climate risk First Street
- Flood 1/10 Low FEMA zone X (unshaded) · 0% chance over 30 yrs
- Wildfire 1/10 Low
- Heat 3/10 Moderate 7 d/yr ≥100°F today · 15 d/yr by 30 yrs out
- Wind 2/10 Low 100% chance of damaging wind over 30 yrs
- Air quality 4/10 Moderate 3 unhealthy d/yr today · 5 by 30 yrs out
Nearby sold comps map
Loading sold comps map…
Walkable amenities ~0.75 mi
Loading nearby amenities…
Taxation est. · year 1
- Rental income
- $123,720
- − Mortgage interest
- −$29,128
- − Property taxes
- −$16,802
- − Insurance
- −$2,600
- − Repairs & maintenance
- −$9,898
- − Management
- −$9,898
- − Depreciation
- −$15,127
- Taxable income
- $40,268
- Est. tax owed @ 24.0%
- −$9,664
- After-tax cash flow
- $35,950/yr
For passive investors: Depreciation is non-cash, so a rental often shows a tax loss while cash-flowing — sheltering income. Rental losses are passive: they offset passive income freely, and up to $25,000/yr can offset ordinary (W-2) income if you actively participate and your MAGI is under $100k (phasing out to $0 by $150k); unused losses carry forward. On sale, claimed depreciation is recaptured at up to 25%, and gains may owe capital-gains tax (a 1031 exchange can defer both). Figures are a year-1 estimate at your 24.0% rate — not tax advice; consult a CPA.
Schools (NCES district)
- District
- J S Morton Hsd 201
- NCES district ID
- 1726880
- Math proficiency
- 9% ▲ 1.00%
- Reading proficiency
- 14% ▼ -1.00%
- Median HH income
- $48,698
- Composite
- 10.73/100
- National rank
- #9768
- State rank
- #557 of 620 in IL
Livability — Berwyn
- Score
- 83/100
- State rank
- #46
- US rank
- #966
Category grades
Schools grade is shown separately in the Schools card above.
Census & demographics
- Census place
- Berwyn, IL
- County
- Cook County · 4,486,803 people
- City population
- 63,721
- Metro
- Chicago-Naperville-Elgin, IL-IN-WI
- Population (ZIP)
- 63,721
- Household income
- $77,718
- Rent vs Own
- Severe rent burden
- 1998.0
Population outlook (Cook County) Hauer SSP2
- Today (2025)
- 5,347,519 people
- By 2030
- 5,357,703 · +0.2%
- By 2040
- 5,324,924 · -0.4%
- By 2050
- 5,230,762 · -2.2%
- By 2075
- 4,785,735 · -10.5%
- By 2100
- 4,188,836 · -21.7%
Race, ethnicity, and origin ACS 2023
- Neighborhood character
- Diverse neighborhood (Simpson 0.55)
- Race & ethnicity
- Hispanic / Latino 61% White 27% Two or more races 19% Black 7% Asian 4% Native American 1%
- Hispanic origin (detail)
- Mexican 47% Puerto Rican 8%
- Common ancestry
- Romanian 7% Italian 1% Lithuanian 0%
- Foreign-born
- 23% · Canada, Vietnam, Jamaica
- Languages at home
- 47% English-only · Spanish 47% Tagalog/Filipino 2% Other Indo-European 1%
Political lean MEDSL · Cook
- 2024 margin
- Solid D (+42.0) · D 70.4% · R 28.4% · Other 1.2%
- 2008→2024 swing
- -11.4pp toward R · 2008: 53.4pp · 2024: 42.0pp
- All cycles
- 2024: D+42.0 2020: D+50.3 2016: D+53.0 2012: D+49.4 2008: D+53.4
Not yet ingested
- Civics
- —
Market trends
- HPI YoY
- ▼ -318.33%
- Current HPI
- 236.662
- Rent YoY
- ▲ 4.57%
- Metro
- Chicago-Naperville-Elgin, IL-IN-WI
- State GDP YoY
- ▲ 1.59%
- F500 in state
- 60
Industry mix (Fortune 500 HQ in IL)
| Industry | F500 HQs | Revenue |
|---|---|---|
| Insurance | 4 | $201B |
|
||
| Consumer Goods | 4 | $87B |
|
||
| Industrial Machinery | 3 | $64B |
|
||
| Healthcare | 2 | $55B |
|
||
| Retail / Pharmacy | 1 | $148B |
|
||
| Agriculture / Food | 1 | $86B |
|
||
Price history
+26.8% since first listed44 events — show timeline
- 2026-05-01 Listed $520,000 MRED as Distributed by MLS Grid
- 2026-04-30 Listing Removed — MRED as Distributed by MLS Grid
- 2026-03-24 Listing Removed — MRED as Distributed by MLS Grid
- 2026-03-24 Listed — MRED as Distributed by MLS Grid
- 2026-03-12 Listing Removed — MRED as Distributed by MLS Grid
- 2026-03-12 Listed — MRED as Distributed by MLS Grid
- 2025-12-03 Listed — MRED as Distributed by MLS Grid
- 2025-11-30 Listing Removed — MRED as Distributed by MLS Grid
- 2025-11-02 Listed — MRED as Distributed by MLS Grid
- 2025-10-31 Listing Removed — MRED as Distributed by MLS Grid
- 2025-10-15 Listing Removed — MRED as Distributed by MLS Grid
- 2025-10-15 Listed — MRED as Distributed by MLS Grid
- 2025-09-30 Listing Removed — MRED as Distributed by MLS Grid
- 2025-09-30 Listed — MRED as Distributed by MLS Grid
- 2025-09-04 Listing Removed — MRED as Distributed by MLS Grid
- 2025-09-04 Listed — MRED as Distributed by MLS Grid
- 2025-08-19 Listed — MRED as Distributed by MLS Grid
- 2024-05-10 Rental Removed $1,300 MRED
- 2024-05-04 Listed for Rent $1,300 MRED
- 2015-05-01 Sold (Public Records) $347,000 Public Records
- 2015-04-28 Sold (MLS) $347,000 MRED as Distributed by MLS Grid
- 2015-04-16 Pending — MRED as Distributed by MLS Grid
- 2015-02-27 Contingent — MRED as Distributed by MLS Grid
- 2014-10-01 Listed $358,000 MRED as Distributed by MLS Grid
- 2014-10-01 Listing Removed — MRED as Distributed by MLS Grid
- 2014-07-03 Price Changed — MRED as Distributed by MLS Grid
- 2014-04-23 Listed — MRED as Distributed by MLS Grid
- 2014-04-01 Listing Removed — MRED as Distributed by MLS Grid
- 2014-03-31 Price Changed — MRED as Distributed by MLS Grid
- 2014-01-25 Price Changed — MRED as Distributed by MLS Grid
- 2013-09-29 Listed — MRED as Distributed by MLS Grid
- 2013-03-31 Listing Removed — MRED as Distributed by MLS Grid
- 2012-09-27 Relisted — MRED as Distributed by MLS Grid
- 2012-09-10 Listing Removed — MRED as Distributed by MLS Grid
- 2012-08-31 Relisted — MRED as Distributed by MLS Grid
- 2012-07-25 Contingent — MRED as Distributed by MLS Grid
- 2012-04-27 Price Changed — MRED as Distributed by MLS Grid
- 2012-04-16 Price Changed — MRED as Distributed by MLS Grid
- 2011-12-16 Price Changed — MRED as Distributed by MLS Grid
- 2011-09-09 Listed — MRED as Distributed by MLS Grid
- 2011-07-05 Listing Removed — MRED as Distributed by MLS Grid
- 2011-05-09 Price Changed — MRED as Distributed by MLS Grid
- 2011-04-06 Listed — MRED as Distributed by MLS Grid
- 2005-01-10 Sold (Public Records) $410,000 Public Records
Property tax history
+2.9%/yrLatest (2023): $16,802 · +23.0% YoY. Source: county tax records.
Cash-flow waterfall
monthlySold comps — $/sqft
last 12 mo · ≤1 miLoading sold comps…