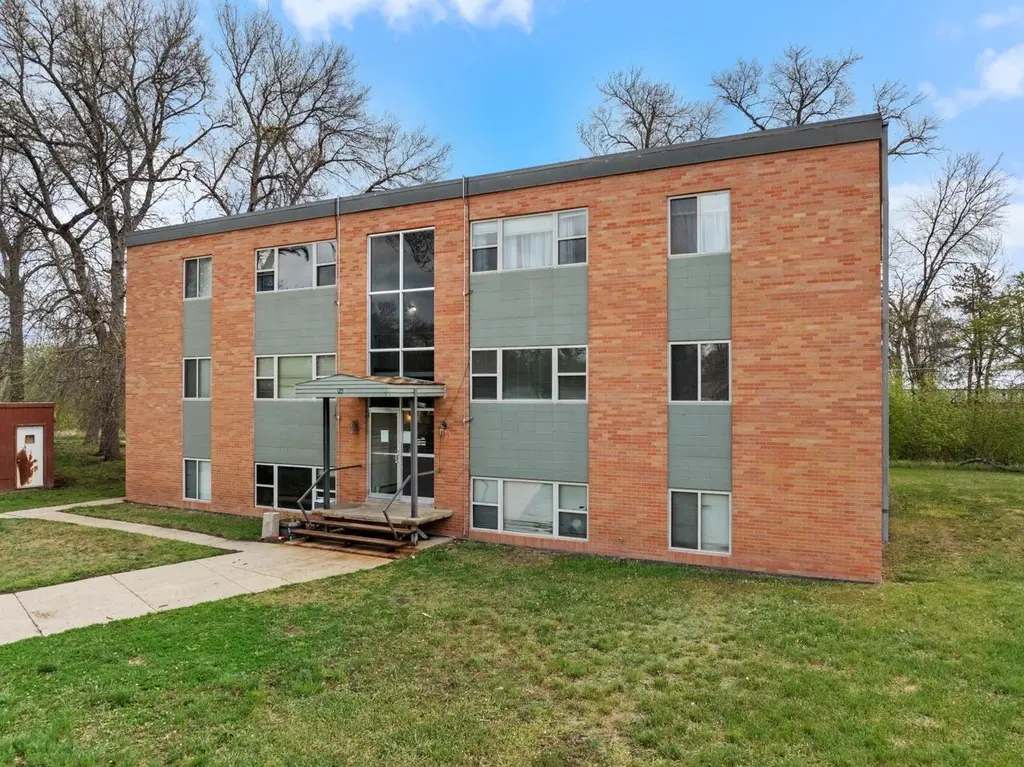
 Triplex
125, 205, 215 19th St SE · Minot, ND
Flood risk 7/10 · Major
- FEMA flood zone
- X (shaded)
- Chance of flooding over 30 yrs
- 0.77%
- Est. flood insurance / yr
- $473 – $860
Fire risk 2/10 · Minimal
- Est. fire insurance / yr
- $1,289 – $2,393
Heat risk 2/10 · Minimal
- Hot days now (above 95°F)
- 7 days/yr
- Hot days in 30 yrs
- 12 days/yr
Wind risk 1/10 · Minimal
- Chance of severe wind over 30 yrs
- —
Air-quality risk 5/10 · Moderate
- Unhealthy air days now
- 7 days/yr
- Unhealthy air days in 30 yrs
- 7 days/yr
Risk factors via First Street. Map © Google.
Why this score? — see what drove the F grade
The composite is a weighted blend of 9 inputs, each scored 0–100. Each bar is that input's sub-score; the figure is the points it added to the 100-point composite (weight × sub-score).
- ARV discount +7.5/15.0
- Rent growth +3.8/5.0
- Schools +3.8/10.0
- Livability +3.8/5.0
- Condition / age +2.5/5.0
- Cash flow +0.9/30.0
- 1% rule +0.0/10.0
- DSCR +0.0/10.0
- Appreciation +0.0/10.0
$1,400,000
🖨 Deal sheet 📄 Offer letter ✓ Due diligence
Multi-family units
County records classify this as Multi-Family (5+ Unit). Listing-text estimate: 3 units. estimate disagrees with records
5+ unit building — per-unit beds/baths from public records are typically unavailable; the breakdown below (if shown) is an estimate from the listing text.
Listing remarks MLS
Rare investment opportunity featuring a 3-building package deal with strong income potential! Each building offers 11 units comprised of 2 bedroom, 1 bathroom layouts, for a total of 33 units. The property also includes a separate set of 11 garages currently rented individually as storage units, creating an additional stream of income. Each building is equipped with boiler heat and its own common area laundry room for tenant convenience. With consistent rental demand and multiple income-producing components, this package presents an excellent opportunity to expand or strengthen your investment portfolio. Property is being sold as-is.
Key facts
- 11 garage spots
- Built 1960
- Listed 18 days
Tags
Property features AI
Finance
- Financial info: Annual tax amount approximately $5,590.63
Exterior
- Parking: Has garage with 11 garage spaces
- Home design: Two-story building; Residential income property (multi-family)
- Exterior features: R3B zoning
Neighborhood map
What this means for you Summary
Snapshot
- This is a 3 × 2-bed/1-bath units multifamily listed at $1.40M.
Deal economics
- At list price, monthly cash flow is $-6k ($-71k/yr) — negative. Per door: $-2k/mo.
- To cash-flow at today's rent, offer at most $360k (74.3% below list).
- To meet the 1% rule (rent ≥ 1% of price), the offer needs to be $321k (77.1% below list).
- Recommended offer: $321k (77.1% below list) — sets the bar for 1% rule.
- Cap rate 1.3% vs local median 2.4% in Minot — below-typical yield; the buyer is paying a premium for something (appreciation thesis, condition, location) that the cap rate doesn't capture.
Location & tenants
- Location reads 75/100 on livability (#21 in ND, #3,953 nationally) — a middle-class / working-renter tenant base. Strengths: cost of living A+, housing A+, health & safety A+; Watch: amenities F, commute F.
- Minot 1 (town): math 41% / reading 46% proficiency, ranked #24 of 53 in ND (top 45%) — families likely to look elsewhere, expect single-tenant / working-renter base with shorter leases.
- Market conditions: Rents rising fast (+5.0%/yr); 174 active listings in the ZIP; 123 units permitted in Ward County in 2024 (0 in 5+ unit buildings).
- At $3,208/mo this rent would consume 53% of the median local household income ($73k/yr) (locally 1146% of renters already pay >50% of income on rent) — very limited rent-growth headroom before tenants either downsize or default.
Forward outlook
- Local home prices are declining (-3.0%/yr); year-one equity from $10k of loan paydown is wiped out by about $42k of value loss. Plan a longer hold.
- Ward County population projected at +76% by 2050 — long-run rental-demand tailwind backs the buy-and-hold thesis.
Negotiation context
- It's been on market 18 days — a 2% lower offer ($1.38M) is reasonable based on typical stale-listing flexibility.
- 3 sale attempts since 8y ago with the ask held roughly flat each time — persistent listings suggest the price (not the market) is what's stuck; bring a comps-based counter.
Risks & watch-outs
- Watch-outs: flood insurance adds $56/mo.
- Climate carrying-cost: major flood risk — expect insurance premiums to compound above CPI over the hold.
Questions for the listing agent
- What do current leases actually rent for vs. the listed asking? Can we see a recent rent roll and the last 12 months of T-12 income?
- Can we see the unit-by-unit rent roll, current vacancy, and any below-market leases? What's the average tenancy length?
- What capital expenditures (roof, boiler, parking lot, exteriors) have been made in the last 5 years, and what's planned in the next 2?
- Built in 1960 — when were the roof, HVAC, electrical panel, plumbing, and water heater last replaced?
- What's the actual annual flood-insurance premium (NFIP or private), and is the property in a SFHA with mandatory coverage?
- Is there a deadline driving the sale (1031 exchange, divorce, estate, relocation)? That informs how much negotiation room exists.
- The area grade is low — what's the realistic commute time and amenity access for the typical tenant pool here? Any planned neighborhood developments (good or bad) we should know about?
- What's the average days-on-market for RENTAL listings here right now (not sales)? A rising rental-DOM trend means longer vacancies and softer asking-rent achievability than the comps imply.
- What's the recent tenant-quality profile in this submarket — average credit score on applications, eviction rate, late-payment / NSF rate, and stable-employment percentage? A property-management company in the area should have these aggregated.
- How much new apartment / multifamily construction is in the pipeline within 1–3 miles? Heavy new supply (>2% of stock underway) typically softens rents 12–24 months out; light construction supports rent growth.
Investment metrics
- 1% rule
- 0.23% ✗
- Cap rate
- 1.29%
- Cash-on-cash
- -17.86%
- DSCR
- 0.21
- GRM
- 36.4
CMA / ARV
No comps found within radius.
Projected returns pro-forma
-3.0% appreciation · 5.05% rent growth · sell at horizon
- IRR
- -51.4%
- Equity multiple
- -0.52×
- Total profit
- $-595,896
- Equity at exit
- $208,745
- IRR
- -96.4%
- Equity multiple
- -1.49×
- Total profit
- $-975,890
- Equity at exit
- $121,046
Cash invested: $392,000 (down + closing). Projections, not guarantees.
Landlord ↔ Tenant lean methodology
- Overall (STATE)
- 82 Strongly Landlord-Friendly
- State North Dakota
- 82 Strongly Landlord-Friendly · R+20
- County
- — inherits STATE
- City
- — inherits STATE
ZIP-level market 58701
- Rents YoY
- 5.0%
- Active inventory
- 174
- Price-to-rent
- 109.1×
Monthly cashflow live
- Estimated rent
- $3,208 medium interval (Pro) →
- Mortgage (P&I)
- −$7,342
- Tax from tax record
- −$443 /mo · $5,311/yr
- Insurance
- −$583
- Flood insurance flood zone
- −$56 /mo · $666/yr
- HOA
- −$0
- Vacancy / Maint / Mgmt
- −$674
- Net cashflow
- $-5,889
Break-even live
3-unit breakdown (identical units grouped — click to expand)
| Units | Beds | Baths | Est. rent |
|---|---|---|---|
| 3× units | 2 | 1 | $3,207 |
| #1 | 2 | 1 | $1,069 |
| #2 | 2 | 1 | $1,069 |
| #3 | 2 | 1 | $1,069 |
| Total (3 units) | $3,208 | ||
UW: 25.0% down · 7.5% · 30yr · 1.5% tax · 5.0% vac · 8.0% maint · 8.0% mgmt
Financing live
Cash to close
- Down payment
- $350,000
- Closing costs
- $42,000
- Reserves months
- —
- Total cash needed
- —
Loan-product check · same deal, 3 products live
Conventional
25% down · 7.5% · 30yr
- Down + closing
- —
- Monthly P&I
- —
- Monthly cashflow
- —
- DSCR
- —
- Eligible?
- —
Personal DTI + credit; lowest rate.
DSCR
20% down · 8.5% · 30yr
- Down + closing
- —
- Monthly P&I
- —
- Monthly cashflow
- —
- DSCR
- —
- Eligible?
- —
No personal income docs; deal must DSCR.
Hard money
10% down · 12.0% · 12mo
- Down + closing
- —
- Monthly P&I
- —
- Monthly cashflow
- —
- DSCR
- —
- Eligible?
- —
Short-term bridge; refi at stabilization.
Listing history 12 events
-
2026-06-12status $1,400,000 Pending 18 DOM
-
2026-06-09days on market $1,400,000 Active Under Contract 18 DOM
-
2026-06-08days on market $1,400,000 Active Under Contract 17 DOM
-
2026-06-07days on market $1,400,000 Active Under Contract 16 DOM
-
2026-06-02days on market $1,400,000 Active Under Contract 11 DOM
-
2026-06-01days on market $1,400,000 Active Under Contract 10 DOM
-
2026-05-31days on market $1,400,000 Active Under Contract 9 DOM
-
2026-05-30days on market $1,400,000 Active Under Contract 8 DOM
-
2026-05-22$475,000 Active
Show marketing remark (641 chars)
Rare investment opportunity featuring a 3-building package deal with strong income potential! Each building offers 11 units comprised of 2 bedroom, 1 bathroom layouts, for a total of 33 units. The property also includes a separate set of 11 garages currently rented individually as storage units, creating an additional stream of income. Each building is equipped with boiler heat and its own common area laundry room for tenant convenience. With consistent rental demand and multiple income-producing components, this package presents an excellent opportunity to expand or strengthen your investment portfolio. Property is being sold as-is.
-
2026-05-22$1,400,000 Active 641-char remark
Show marketing remark (641 chars)
Rare investment opportunity featuring a 3-building package deal with strong income potential! Each building offers 11 units comprised of 2 bedroom, 1 bathroom layouts, for a total of 33 units. The property also includes a separate set of 11 garages currently rented individually as storage units, creating an additional stream of income. Each building is equipped with boiler heat and its own common area laundry room for tenant convenience. With consistent rental demand and multiple income-producing components, this package presents an excellent opportunity to expand or strengthen your investment portfolio. Property is being sold as-is.
-
2018-08-31soldstatus 482-char remark
Show marketing remark (482 chars)
Three buildings with 11 units each. Well maintained, very solid buildings with masonry exterior and concrete floors! Newer windows and energy efficient boilers. Each building features a storage area and coin operated laundry facilities. 11 single stall garage units. Park like yard and setting. 100% OCCUPIED! Capitalization analysis shows a CAP rate of 9.2%. There is a FANTASTIC UPSIDE to this investment at this market adjusted price! PRICED TO SELL AT ONLY $24,000 PER UNIT.
-
2018-03-21$795,000 482-char remark
Show marketing remark (482 chars)
Three buildings with 11 units each. Well maintained, very solid buildings with masonry exterior and concrete floors! Newer windows and energy efficient boilers. Each building features a storage area and coin operated laundry facilities. 11 single stall garage units. Park like yard and setting. 100% OCCUPIED! Capitalization analysis shows a CAP rate of 9.2%. There is a FANTASTIC UPSIDE to this investment at this market adjusted price! PRICED TO SELL AT ONLY $24,000 PER UNIT.
ⓘ Source: listings_history table (triggers on properties + properties_extension) + one-shot
backfill from property_details.listing_events for pre-trigger history.
Tax reassessment forecast ND · Resets to sale price
- Current annual tax
- $5,311 · $443/mo
- Projected year-2 tax
- $13,720 · $1,143/mo
- Expected delta
- +$8,409/yr (+$701/mo · 158.3%)
ⓘ Screening estimate from a state-policy table — verify with the county assessor before closing.
Climate risk First Street
- Flood 7/10 Severe FEMA zone X (shaded) · 77% chance over 30 yrs
- Wildfire 2/10 Low
- Heat 2/10 Low 7 d/yr ≥95°F today · 12 d/yr by 30 yrs out
- Wind 1/10 Low
- Air quality 5/10 Major 7 unhealthy d/yr today · 7 by 30 yrs out
Nearby sold comps map
Loading sold comps map…
Walkable amenities ~0.75 mi
Loading nearby amenities…
Taxation est. · year 1
- Rental income
- $38,496
- − Mortgage interest
- −$78,422
- − Property taxes
- −$5,311
- − Insurance
- −$7,666
- − Repairs & maintenance
- −$3,080
- − Management
- −$3,080
- − Depreciation
- −$40,727
- Taxable loss
- −$99,790
- Est. tax savings @ 24.0%
- +$23,950
- After-tax cash flow
- $-46,717/yr
For passive investors: Depreciation is non-cash, so a rental often shows a tax loss while cash-flowing — sheltering income. Rental losses are passive: they offset passive income freely, and up to $25,000/yr can offset ordinary (W-2) income if you actively participate and your MAGI is under $100k (phasing out to $0 by $150k); unused losses carry forward. On sale, claimed depreciation is recaptured at up to 25%, and gains may owe capital-gains tax (a 1031 exchange can defer both). Figures are a year-1 estimate at your 24.0% rate — not tax advice; consult a CPA.
Schools (NCES district)
- District
- Minot 1
- NCES district ID
- 3813030
- Math proficiency
- 41% ▼ -4.00%
- Reading proficiency
- 46% ▼ -1.00%
- Median HH income
- $54,224
- Composite
- 37.79/100
- National rank
- #4341
- State rank
- #24 of 53 in ND
Livability — Minot
- Score
- 75/100
- State rank
- #21
- US rank
- #3953
Category grades
Schools grade is shown separately in the Schools card above.
Census & demographics
- Census place
- Minot, ND
- County
- Ward County · 55,225 people
- City population
- 55,225
- Metro
- Minot, ND
- Population (ZIP)
- 33,086
- Household income
- $73,269
- Rent vs Own
- Severe rent burden
- 1146.0
Population outlook (Ward County) Hauer SSP2
- Today (2025)
- 92,683 people
- By 2030
- 104,825 · +13.1%
- By 2040
- 131,945 · +42.4%
- By 2050
- 163,134 · +76.0%
- By 2075
- 256,561 · +176.8%
- By 2100
- 354,426 · +282.4%
Race, ethnicity, and origin ACS 2023
- Neighborhood character
- Predominantly White (83%)
- Race & ethnicity
- White 83% Two or more races 8% Hispanic / Latino 5% Black 3% Native American 2% Asian 2%
- Common ancestry
- Portuguese 27% Scotch-Irish 3% Lithuanian 2%
- Foreign-born
- 5% · Canada
- Languages at home
- 94% English-only · Spanish 2% Other Asian/Pacific 1% Tagalog/Filipino 1%
Political lean MEDSL · Ward
- 2024 margin
- Solid R (+47.4) · D 25.5% · R 72.8% · Other 1.7%
- 2008→2024 swing
- -28.2pp toward R · 2008: -19.2pp · 2024: -47.4pp
- All cycles
- 2024: R+47.4 2020: R+44.9 2016: R+47.7 2012: R+30.8 2008: R+19.2
Not yet ingested
- Civics
- —
Market trends
- HPI YoY
- ▼ -227.47%
- Current HPI
- 144.9492
- Rent YoY
- ▲ 5.05%
- Metro
- Minot, ND
- State GDP YoY
- ▲ 2.09%
- F500 in state
- 2
Industry mix (Fortune 500 HQ in ND)
| Industry | F500 HQs | Revenue |
|---|---|---|
| Utilities / Construction | 1 | $6B |
|
||
Price history
+76.1% since first listed4 events — show timeline
- 2026-05-22 Listed $1,400,000 MMLS
- 2026-05-22 Listed $475,000 MMLS
- 2018-08-31 Sold (MLS) — MMLS
- 2018-03-21 Listed $795,000 MMLS
Property tax history
-3.2%/yrLatest (2025): $5,311 · -2.3% YoY. Source: county tax records.
Cash-flow waterfall
monthlySold comps — $/sqft
last 12 mo · ≤1 miLoading sold comps…