 Triplex
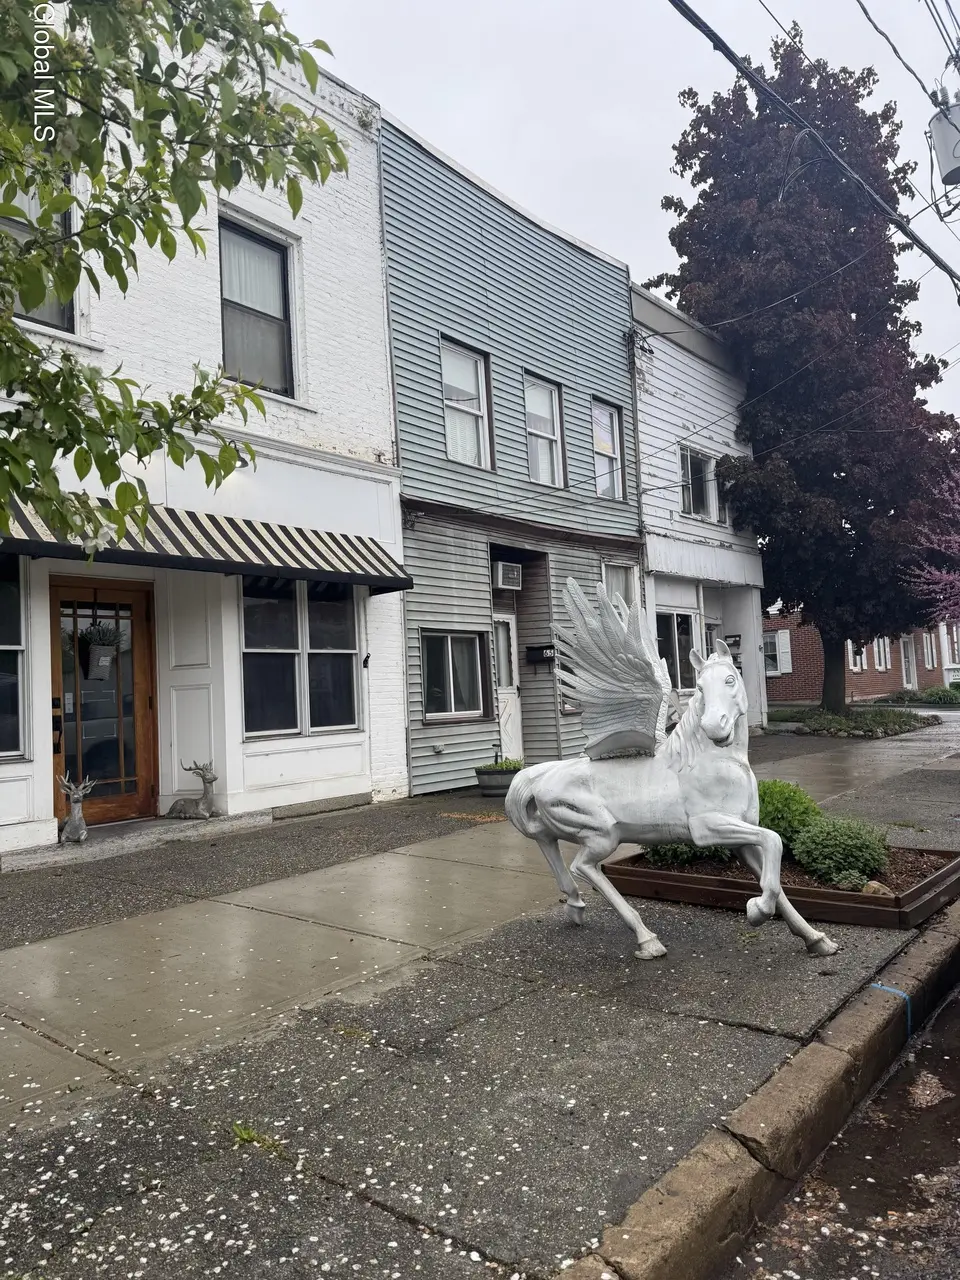
67 Broad St · Schuylerville, NY
Flood risk No data
- FEMA flood zone
- —
- Chance of flooding over 30 yrs
- —
- Est. flood insurance / yr
- —
Fire risk No data
- Est. fire insurance / yr
- —
Heat risk No data
- Hot days now (above threshold)
- —
- Hot days in 30 yrs
- —
Wind risk No data
- Chance of severe wind over 30 yrs
- —
Air-quality risk No data
- Unhealthy air days now
- —
- Unhealthy air days in 30 yrs
- —
Risk factors via First Street. Map © Google.
Why this score? — see what drove the A- grade
The composite is a weighted blend of 9 inputs, each scored 0–100. Each bar is that input's sub-score; the figure is the points it added to the 100-point composite (weight × sub-score).
- Cash flow +30.0/30.0
- 1% rule +10.0/10.0
- DSCR +10.0/10.0
- Appreciation +10.0/10.0
- ARV discount +7.5/15.0
- Schools +5.4/10.0
- Livability +3.9/5.0
- Rent growth +2.5/5.0
- Condition / age +2.2/5.0
$140,000
🖨 Deal sheet 📄 Offer letter ✓ Due diligence
Multi-family units
County records classify this as Multi-Family (2-4 Unit). Listing-text estimate: 3 units. confirmed
Listing remarks
INVESTOR OPPORTUNITY! Fully rented profitable Triplex with existing long term tenants. Monthly gross income of $2,250 with room to improve margin. Many updates have been completed. Add the remaining updates, potential parking in the rear and increase your profit margins. Updates include; 2014 - replaced front roof - rafters, plywood, rubber roofing, and natural gas lines from meters to basement, 2019 - complete update to kitchen in unit two, 2021 - replaced rear rubber roof, 2023 - replaced water main from road to basement, 2026 - new natural gas hot water heater for one unit. This property is for cash or conventional buyers and will not qualify for FHA/USDA/VA Loans. Proof of funds or
Key facts
- Replaced front roof
- Monthly gross income
- 2,178 sq ft lot
Tags
Property features AI
Finance
- Financial info: 3 total units; Tenants pay hot water, heat, internet, cable TV, electricity and gas; Owner pays water and sewer
Exterior
- Utilities: 100 amp electrical service; Public water; Public sewer; Cable connected
- Home design: Triplex; 2,400 living area with 705 sq ft finished below grade
- Construction: Brick and vinyl siding construction
- Exterior features: Garden
Interior
- Bedrooms: Unit 1: 1 bedroom; Unit 2: 2 bedrooms; Unit 3: 2 bedrooms
- Bathrooms: 3 full bathrooms total (one in basement, one on 1st floor, one on 2nd floor); Each unit includes a full bath
- Heating & cooling: Electric heating; Natural gas heating
- Interior features: Walk-out basement
Neighborhood map
What this means for you Summary
Snapshot
- This is a 3 × 5-bed/3.0-bath units multifamily listed at $140k. Condition is rated fair.
Deal economics
- At list price, monthly cash flow is $3k ($34k/yr) — positive. Per door: $948/mo.
- The deal already cash-flows at list — no discount required.
- Meets the 1% rule at list price ($5k rent vs $140k).
- Recommended offer: $138k (1.5% below list) — sets the bar for market timing.
Location & tenants
- Location reads 77/100 on livability (#186 in NY, #2,863 nationally) — a middle-class / working-renter tenant base. Strengths: housing A+, health & safety A+, crime A; Watch: amenities D, commute F.
- Schuylerville Central School District (rural): math 58% / reading 64% proficiency, ranked #201 of 590 in NY (top 34%) — acceptable for families but not a draw, mixed tenant base, ~2y average lease; only 19% free/reduced lunch — higher-income household profile.
- Zoned schools: Schuylerville Elementary School (math 60% / reading 66%, grade B, #669 of 2,108 statewide, top 32%, 597 students, 36% FRL); Schuylerville High School (math 92% / reading 70%, grade A, #495 of 1,100 statewide, top 46%, 482 students, 29% FRL).
- Market conditions: 32 active listings in the ZIP; 1,132 units permitted in Saratoga County in 2024 (378 in 5+ unit buildings).
Forward outlook
- In year one you build about $15k of equity ($968 loan paydown + $14k appreciation (10.0% local appreciation)).
- Saratoga County population projected at +4% by 2050 — modest demand growth; plan on rents tracking national, not racing it.
- At projected returns (10.0% appreciation + 3.0% rent growth), your $39k cash investment doubles in ~1 year — after that, you're playing with house money.
- By year 3, paydown + projected appreciation supports a ~$38k cash-out refi (75% LTV) — recoverable capital for the next deal without selling this one.
Negotiation context
- It's been on market 29 days — a 2% lower offer ($138k) is reasonable based on typical stale-listing flexibility.
Risks & watch-outs
- Watch-outs: built in 1950 — expect roof / HVAC / electrical / plumbing capex.
Questions for the listing agent
- Can we see the unit-by-unit rent roll, current vacancy, and any below-market leases? What's the average tenancy length?
- What capital expenditures (roof, boiler, parking lot, exteriors) have been made in the last 5 years, and what's planned in the next 2?
- Have any recent inspections been done? Can we get a copy of the seller's disclosures and any deferred-maintenance estimates?
- Built in 1950 — when were the roof, HVAC, electrical panel, plumbing, and water heater last replaced?
- Is there a deadline driving the sale (1031 exchange, divorce, estate, relocation)? That informs how much negotiation room exists.
- Schools are B-rated — typically a magnet for longer-tenancy family renters. What's the average tenant stay here, and is there a school-zone premium baked into asking?
- What's the average days-on-market for RENTAL listings here right now (not sales)? A rising rental-DOM trend means longer vacancies and softer asking-rent achievability than the comps imply.
- What's the recent tenant-quality profile in this submarket — average credit score on applications, eviction rate, late-payment / NSF rate, and stable-employment percentage? A property-management company in the area should have these aggregated.
- How much new apartment / multifamily construction is in the pipeline within 1–3 miles? Heavy new supply (>2% of stock underway) typically softens rents 12–24 months out; light construction supports rent growth.
Investment metrics
- 1% rule
- 3.45% ✓
- Cap rate
- 30.68%
- Cash-on-cash
- 87.09%
- DSCR
- 4.88
- GRM
- 2.4
CMA / ARV
No comps found within radius.
Projected returns pro-forma
10.0% appreciation · 3.0% rent growth · sell at horizon
- IRR
- 96.4%
- Equity multiple
- 7.57×
- Total profit
- $257,522
- Equity at exit
- $126,123
- IRR
- 91.5%
- Equity multiple
- 16.71×
- Total profit
- $616,009
- Equity at exit
- $271,989
Cash invested: $39,200 (down + closing). Projections, not guarantees.
Landlord ↔ Tenant lean methodology
- Overall (STATE)
- 15 Strongly Tenant-Friendly
- State New York
- 15 Strongly Tenant-Friendly · D+10
- County
- — inherits STATE
- City
- — inherits STATE
ZIP-level market 12871
- Home prices YoY
- 4.0%
- Active inventory
- 32
- Price-to-rent
- 7.3×
Monthly cashflow live
- Estimated rent
- $4,826 medium interval (Pro) →
- Mortgage (P&I)
- −$734
- Tax est. 1.5%
- −$175 /mo · $2,100/yr
- Insurance
- −$58
- HOA
- −$0
- Vacancy / Maint / Mgmt
- −$1,013
- Net cashflow
- $2,845
Break-even live
3-unit breakdown (identical units grouped — click to expand)
| Units | Beds | Baths | Est. rent |
|---|---|---|---|
| 3× units | 5 | 3 | $4,827 |
| #1 | 5 | 3 | $1,609 |
| #2 | 5 | 3 | $1,609 |
| #3 | 5 | 3 | $1,609 |
| Total (3 units) | $4,826 | ||
UW: 25.0% down · 7.5% · 30yr · 1.5% tax · 5.0% vac · 8.0% maint · 8.0% mgmt
Financing live
Cash to close
- Down payment
- $35,000
- Closing costs
- $4,200
- Reserves months
- —
- Total cash needed
- —
Loan-product check · same deal, 3 products live
Conventional
25% down · 7.5% · 30yr
- Down + closing
- —
- Monthly P&I
- —
- Monthly cashflow
- —
- DSCR
- —
- Eligible?
- —
Personal DTI + credit; lowest rate.
DSCR
20% down · 8.5% · 30yr
- Down + closing
- —
- Monthly P&I
- —
- Monthly cashflow
- —
- DSCR
- —
- Eligible?
- —
No personal income docs; deal must DSCR.
Hard money
10% down · 12.0% · 12mo
- Down + closing
- —
- Monthly P&I
- —
- Monthly cashflow
- —
- DSCR
- —
- Eligible?
- —
Short-term bridge; refi at stabilization.
Listing history 17 events
-
2026-06-18status $140,000 Pending 29 DOM
-
2026-06-18days on market $140,000 Active 29 DOM
-
2026-06-17days on market $140,000 Active 28 DOM
-
2026-06-16days on market $140,000 Active 27 DOM
-
2026-06-15days on market $140,000 Active 26 DOM
-
2026-06-14days on market $140,000 Active 24 DOM
-
2026-06-10days on market $140,000 Active 21 DOM
-
2026-06-09days on market $140,000 Active 20 DOM
-
2026-06-08days on market $140,000 Active 19 DOM
-
2026-06-07statusdays on market $140,000 Active 18 DOM
-
2026-06-05days on market $140,000 Contingent 15 DOM
-
2026-06-03days on market $140,000 Contingent 14 DOM
-
2026-06-02days on market $140,000 Contingent 13 DOM
-
2026-06-01days on market $140,000 Contingent 12 DOM
-
2026-05-31days on market $140,000 Contingent 11 DOM
-
2026-05-31days on market $140,000 Contingent 10 DOM
-
2026-05-20$140,000 Active
ⓘ Source: listings_history table (triggers on properties + properties_extension) + one-shot
backfill from property_details.listing_events for pre-trigger history.
Nearby sold comps map
Loading sold comps map…
Walkable amenities ~0.75 mi
Loading nearby amenities…
Taxation est. · year 1
- Rental income
- $57,912
- − Mortgage interest
- −$7,842
- − Property taxes
- −$2,100
- − Insurance
- −$700
- − Repairs & maintenance
- −$4,633
- − Management
- −$4,633
- − Depreciation
- −$4,073
- Taxable income
- $33,931
- Est. tax owed @ 24.0%
- −$8,143
- After-tax cash flow
- $25,997/yr
For passive investors: Depreciation is non-cash, so a rental often shows a tax loss while cash-flowing — sheltering income. Rental losses are passive: they offset passive income freely, and up to $25,000/yr can offset ordinary (W-2) income if you actively participate and your MAGI is under $100k (phasing out to $0 by $150k); unused losses carry forward. On sale, claimed depreciation is recaptured at up to 25%, and gains may owe capital-gains tax (a 1031 exchange can defer both). Figures are a year-1 estimate at your 24.0% rate — not tax advice; consult a CPA.
Condition & rehab AI · 14 photos
The property is a triplex with moderate rehabilitation needs, including updates to the kitchen and bathrooms, and landscaping improvements. It is currently rented and profitable, but with some repairs and maintenance required to enhance its value.
Repairs flagged
- Major Kitchen flooring — The flooring in the kitchen looks worn and may need replacement.
- Major Bathroom flooring — The flooring in the bathrooms looks worn and may need replacement.
- Minor Landscaping — The landscaping is overgrown and needs trimming.
Value-add opportunities
- Both Painting and updating the kitchen and bathrooms — Updating the kitchen and bathrooms will improve the overall appearance and functionality of the property, making it more attractive to potential buyers and renters.
- Both Landscaping and curb appeal improvements — A well-maintained and attractive exterior can significantly increase the property's curb appeal and market value.
Renovation cost estimate screening
| Repair item | Severity | Est. cost |
|---|---|---|
| Kitchen flooring · The flooring in the kitchen looks worn and may need replacement. | Major | $15,000–50,000 |
| Bathroom flooring · The flooring in the bathrooms looks worn and may need replacement. | Major | $15,000–50,000 |
| Landscaping · The landscaping is overgrown and needs trimming. | Minor | $500–3,000 |
| Total estimated repair cost · 3 items | $30,500–103,000 |
Value-add ROI direction
- Both Painting and updating the kitchen and bathrooms — Updating the kitchen and bathrooms will improve the overall appearance and functionality of the property, making it more attractive to potential buyers and renters. ↑
- Both Landscaping and curb appeal improvements — A well-maintained and attractive exterior can significantly increase the property's curb appeal and market value. ↑
ⓘ Cost ranges are severity-bucket heuristics (US national rule-of-thumb). Get contractor quotes + a written scope before underwriting a rehab budget.
Schools (NCES district)
- District
- Schuylerville Central School District
- NCES district ID
- 3626160
- Math proficiency
- 58% ▼ -8.00%
- Reading proficiency
- 64% ▲ 6.00%
- Median HH income
- $69,011
- Composite
- 53.71/100
- National rank
- #1423
- State rank
- #201 of 590 in NY
Livability — Schuylerville
- Score
- 77/100
- State rank
- #186
- US rank
- #2863
Category grades
Schools grade is shown separately in the Schools card above.
Census & demographics
- Census place
- Schuylerville, NY
- Population (ZIP)
- 3,997
Population outlook (Saratoga County) Hauer SSP2
- Today (2025)
- 238,889 people
- By 2030
- 243,681 · +2.0%
- By 2040
- 249,118 · +4.3%
- By 2050
- 248,638 · +4.1%
- By 2075
- 241,675 · +1.2%
- By 2100
- 213,150 · -10.8%
Race, ethnicity, and origin ACS 2023
- Neighborhood character
- Predominantly White (91%)
- Race & ethnicity
- White 91% Hispanic / Latino 5% Two or more races 3%
- Common ancestry
- Romanian 9% Lithuanian 9% Slovak 4%
- Foreign-born
- 4% · Canada
- Languages at home
- 95% English-only · Spanish 4%
Political lean MEDSL · Saratoga
- 2024 margin
- Toss-up / Even · D 50.9% · R 49.1%
- 2008→2024 swing
- -1.6pp toward R · 2008: 3.4pp · 2024: 1.8pp
- All cycles
- 2024: D+1.8 2020: D+5.4 2016: R+4.4 2012: D+2.1 2008: D+3.4
Not yet ingested
- Civics
- —
Market trends
- HPI YoY
- ▲ 12.21%
- Current HPI
- 320.1965
- Rent YoY
- —
- Metro
- —
- State GDP YoY
- ▲ 2.60%
- F500 in state
- 92
Industry mix (Fortune 500 HQ in NY)
| Industry | F500 HQs | Revenue |
|---|---|---|
| Financial Services | 10 | $950B |
|
||
| Consumer Goods | 9 | $162B |
|
||
| Insurance | 4 | $225B |
|
||
| Telecommunications | 2 | $144B |
|
||
| Pharmaceuticals | 2 | $112B |
|
||
| Media / Entertainment | 2 | $69B |
|
||
Price history
1 event — show timeline
- 2026-05-20 Listed $140,000 Global MLS
Cash-flow waterfall
monthlySold comps — $/sqft
last 12 mo · ≤1 miLoading sold comps…