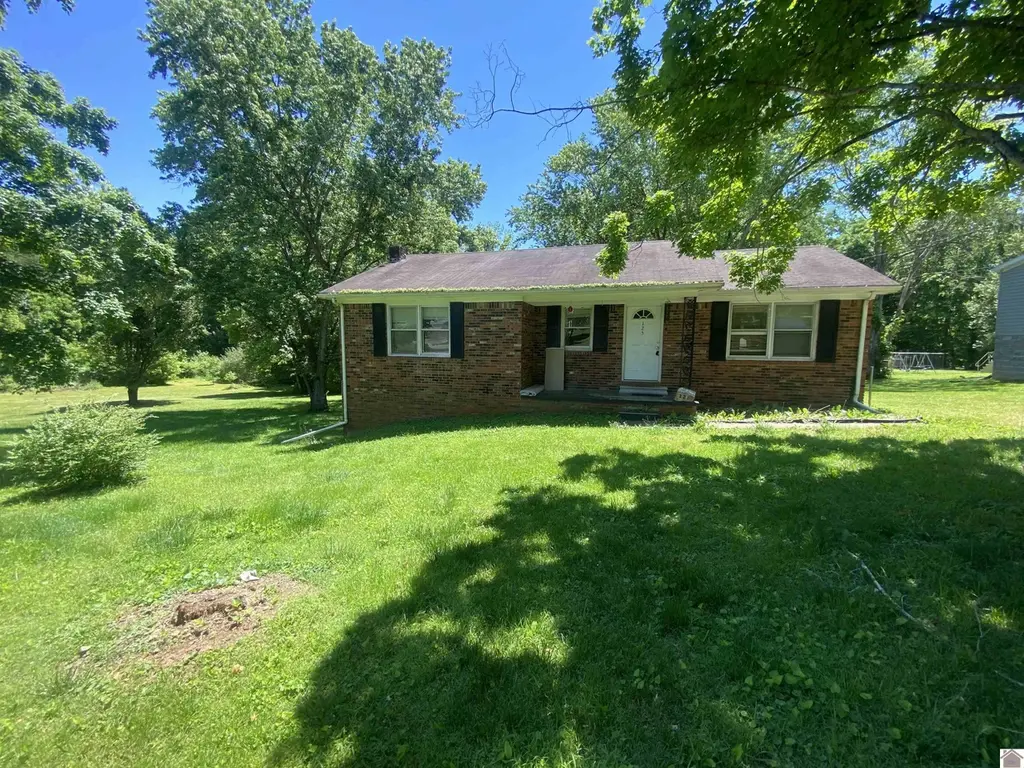
125 Hilltop St · Cadiz, KY
Flood risk 5/10 · Moderate
- FEMA flood zone
- X (unshaded)
- Chance of flooding over 30 yrs
- 0.24%
- Est. flood insurance / yr
- $507 – $1,088
Fire risk 3/10 · Minor
- Est. fire insurance / yr
- $839 – $1,559
Heat risk 5/10 · Moderate
- Hot days now (above 108°F)
- 7 days/yr
- Hot days in 30 yrs
- 20 days/yr
Wind risk 3/10 · Minor
- Chance of severe wind over 30 yrs
- 7.0%
Air-quality risk 1/10 · Minimal
- Unhealthy air days now
- 0 days/yr
- Unhealthy air days in 30 yrs
- 0 days/yr
Risk factors via First Street. Map © Google.
Why this score? — see what drove the B grade
The composite is a weighted blend of 9 inputs, each scored 0–100. Each bar is that input's sub-score; the figure is the points it added to the 100-point composite (weight × sub-score).
- Cash flow +30.0/30.0
- ARV discount +15.0/15.0
- DSCR +10.0/10.0
- 1% rule +8.3/10.0
- Livability +3.1/5.0
- Schools +2.7/10.0
- Rent growth +2.5/5.0
- Condition / age +2.5/5.0
- Appreciation +0.0/10.0
$135,000
🖨 Deal sheet (PDF) 📄 Offer letter ✓ Due diligence
Listing remarks
INVESTORS! This home would be a great rental of with some tlc could make a good starter home.
Key facts
- 0.7 acre lot
- Built 1979
- Listed 43 days
Property features AI
Finance
- Other: Located in the Lancaster Sa subdivision; Directions: From Lafayette Street in Cadiz take West End to Hilltop Street and turn left.
Exterior
- Utilities: Cable available; Septic tank
- Home design: Single-family residence; Single story
- Construction: Frame construction
- Exterior features: Composition roof
Interior
- Kitchen: Refrigerator; Cooktop
- Flooring: Carpet; Vinyl
- Bathrooms: 1 full bathroom
- Heating & cooling: Heat pump heating; Central air conditioning
- Interior features: Eat-in kitchen; Full unfinished basement
Neighborhood map
What this means for you Summary
Snapshot
- This is a 3-bed/1.0-bath single-family listed at $135k.
Deal economics
- At list price, monthly cash flow is $579 ($7k/yr) — positive.
- The deal already cash-flows at list — no discount required.
- Meets the 1% rule at list price ($2k rent vs $135k).
- Recommended offer: $131k (3.0% below list) — sets the bar for market timing.
- Cap rate 11.4% vs local median 3.6% in Cadiz — top-decile yield for the area; either an underpriced asset or a hidden risk that comps aren't pricing in. Stress-test before assuming the spread holds.
Location & tenants
- Location reads 62/100 on livability (#354 in KY) — a middle-class / working-renter tenant base. Strengths: crime A+, cost of living A+, housing A; Watch: amenities F, commute F, employment F.
- Trigg County (town): math 23% / reading 40% proficiency, ranked #90 of 165 in KY (top 54%) — families likely to look elsewhere, expect single-tenant / working-renter base with shorter leases.
- Zoned schools: Trigg County Primary School (516 students, 66% FRL); Trigg County Middle School (math 19% / reading 44%, grade F, #125 of 217 statewide, top 63%, 440 students, 60% FRL); Trigg County High School (math 32% / reading 32%, grade F, #97 of 254 statewide, top 46%, 617 students, 51% FRL).
- Market conditions: 303 active listings in the ZIP; 10 units permitted in Trigg County in 2024 (0 in 5+ unit buildings).
Forward outlook
- Local home prices are declining (-3.0%/yr); year-one equity from $933 of loan paydown is wiped out by about $4k of value loss. Plan a longer hold.
- Trigg County population projected to shrink 7% by 2050 — rents likely to lag national; underwrite the cash flow, not the appreciation.
- At projected returns (-3.0% appreciation + 3.0% rent growth), your $38k cash investment doubles in ~7 years — after that, you're playing with house money.
Negotiation context
- It's been on market 44 days — a 3% lower offer ($131k) is reasonable based on typical stale-listing flexibility.
Risks & watch-outs
- Climate carrying-cost: moderate flood risk; extreme-heat days projected 7→20/yr by 2055 (HVAC capex compounding) — expect insurance premiums to compound above CPI over the hold.
Questions for the listing agent
- It's been on market 44 days. Have you received any prior offers? Is the seller open to a 3% concession, seller financing, or rate buy-down credit?
- Built in 1979 — when were the roof, HVAC, electrical panel, plumbing, and water heater last replaced?
- Is there a deadline driving the sale (1031 exchange, divorce, estate, relocation)? That informs how much negotiation room exists.
- Schools are D-rated, which usually means shorter tenancies and higher turnover. Who's the typical renter profile here, and what's been the actual vacancy rate?
- What's the average days-on-market for RENTAL listings here right now (not sales)? A rising rental-DOM trend means longer vacancies and softer asking-rent achievability than the comps imply.
- What's the recent tenant-quality profile in this submarket — average credit score on applications, eviction rate, late-payment / NSF rate, and stable-employment percentage? A property-management company in the area should have these aggregated.
- How much new for-sale + rental construction is in the pipeline within 1–3 miles? Heavy new supply typically softens prices + rents 12–24 months out; constrained supply supports both.
Investment metrics
- 1% rule
- 1.33% ✓
- Cap rate
- 11.44%
- Cash-on-cash
- 18.38%
- DSCR
- 1.82
- GRM
- 6.3
CMA / ARV
- ARV (median comp)
- $186,402
- List price
- $135,000
- Delta
- -27.58%
- Verdict
- UNDERPRICED
- Comps
- 20 within 1.0 mi
Show comp detail 7 sales within ~0.75 mi
| Address | Dist | Beds/Ba | Sqft | Sold | Price | $/sf | Match |
|---|---|---|---|---|---|---|---|
| 292 First St | 0.47mi | 3/1.0 | 1,175 (-7%) | 13mo | $150,000 | $128 | 56 |
| 65 Wharton Rd | 0.60mi | 3/2.0 | 1,382 (+10%) | 3mo | $205,000 | $148 | 49 |
| 119 Noel Dr | 0.65mi | 3/1.5 | 1,400 (+11%) | 4mo | $169,000 | $121 | 46 |
| 1334 Jefferson St | 0.56mi | 3/1.5 | 1,196 (-5%) | 22mo | $125,000 | $105 | 45 |
| 342 2nd St | 0.57mi | 3/2.0 | 1,367 (+8%) | 14mo | $240,000 | $176 | 44 |
| 143 Sunset Cir | 0.58mi | 3/2.0 | 1,380 (+10%) | 14mo | $215,000 | $156 | 41 |
| 347 Lafayette St | 0.62mi | 3/2.0 | 1,408 (+12%) | 11mo | $220,000 | $156 | 38 |
Match score weights: distance 35% · size 25% · config 20% · recency 20%. Top-matched comps best support the ARV.
Projected returns pro-forma
-3.0% appreciation · 3.0% rent growth · sell at horizon
- IRR
- 10.0%
- Equity multiple
- 1.40×
- Total profit
- $14,976
- Equity at exit
- $20,129
- IRR
- 19.1%
- Equity multiple
- 2.60×
- Total profit
- $60,408
- Equity at exit
- $11,672
Cash invested: $37,800 (down + closing). Projections, not guarantees.
Landlord ↔ Tenant lean methodology
- Overall (STATE)
- 83 Strongly Landlord-Friendly
- State Kentucky
- 83 Strongly Landlord-Friendly · R+16
- County
- — inherits STATE
- City
- — inherits STATE
ZIP-level market 42211
- Active inventory
- 303
- Price-to-rent
- 6.3×
Monthly cashflow live
- Estimated rent
- $1,795 medium interval (Pro) →
- Mortgage (P&I)
- −$708
- Tax from tax record
- −$75 /mo · $901/yr
- Insurance
- −$56
- HOA
- −$0
- Vacancy / Maint / Mgmt
- −$377
- Net cashflow
- $579
Break-even live
Sensitivity live
| Price | -10% $655 | -5% $617 | +0% $579 | +5% $541 | +10% $503 |
|---|---|---|---|---|---|
| Rent | -10% $437 | -5% $508 | +0% $579 | +5% $650 | +10% $721 |
| Rate | -1.0pp $647 | -0.5pp $613 | base $579 | +0.5pp $544 | +1.0pp $509 |
UW: 25.0% down · 7.5% · 30yr · 1.5% tax · 5.0% vac · 8.0% maint · 8.0% mgmt
Financing live
Cash to close
- Down payment
- $33,750
- Closing costs
- $4,050
- Reserves months
- —
- Total cash needed
- —
Loan-product check · same deal, 3 products live
Conventional
25% down · 7.5% · 30yr
- Down + closing
- —
- Monthly P&I
- —
- Monthly cashflow
- —
- DSCR
- —
- Eligible?
- —
Personal DTI + credit; lowest rate.
DSCR
20% down · 8.5% · 30yr
- Down + closing
- —
- Monthly P&I
- —
- Monthly cashflow
- —
- DSCR
- —
- Eligible?
- —
No personal income docs; deal must DSCR.
Hard money
10% down · 12.0% · 12mo
- Down + closing
- —
- Monthly P&I
- —
- Monthly cashflow
- —
- DSCR
- —
- Eligible?
- —
Short-term bridge; refi at stabilization.
Listing history 19 events
-
2026-06-22days on market $135,000 Active 44 DOM
-
2026-06-21days on market $135,000 Active 43 DOM
-
2026-06-19days on market $135,000 Active 41 DOM
-
2026-06-18days on market $135,000 Active 40 DOM
-
2026-06-17days on market $135,000 Active 39 DOM
-
2026-06-16days on market $135,000 Active 38 DOM
-
2026-06-15days on market $135,000 Active 37 DOM
-
2026-06-14days on market $135,000 Active 35 DOM
-
2026-06-12days on market $135,000 Active 34 DOM
-
2026-06-09days on market $135,000 Active 31 DOM
-
2026-06-08days on market $135,000 Active 30 DOM
-
2026-06-07days on market $135,000 Active 29 DOM
-
2026-06-05days on market $135,000 Active 26 DOM
-
2026-06-03days on market $135,000 Active 25 DOM
-
2026-06-03days on market $135,000 Active 24 DOM
-
2026-06-01days on market $135,000 Active 23 DOM
-
2026-05-31days on market $135,000 Active 22 DOM
-
2026-05-30days on market $135,000 Active 21 DOM
-
2026-05-09$135,000 Active 94-char remark
ⓘ Source: listings_history table (triggers on properties + properties_extension) + one-shot
backfill from property_details.listing_events for pre-trigger history.
Tax reassessment forecast KY · Resets to sale price
- Current annual tax
- $901 · $75/mo
- Projected year-2 tax
- $1,161 · $97/mo
- Expected delta
- +$260/yr (+$22/mo · 28.9%)
ⓘ Screening estimate from a state-policy table — verify with the county assessor before closing.
Climate risk First Street
- Flood 5/10 Major FEMA zone X (unshaded) · 24% chance over 30 yrs
- Wildfire 3/10 Moderate
- Heat 5/10 Major 7 d/yr ≥108°F today · 20 d/yr by 30 yrs out
- Wind 3/10 Moderate 7% chance of damaging wind over 30 yrs
- Air quality 1/10 Low 0 unhealthy d/yr today · 0 by 30 yrs out
Nearby sold comps map
Loading sold comps map…
Walkable amenities ~0.75 mi
Loading nearby amenities…
Taxation est. · year 1
- Rental income
- $21,545
- − Mortgage interest
- −$7,562
- − Property taxes
- −$901
- − Insurance
- −$675
- − Repairs & maintenance
- −$1,724
- − Management
- −$1,724
- − Depreciation
- −$3,927
- Taxable income
- $5,032
- Est. tax owed @ 24.0%
- −$1,208
- After-tax cash flow
- $5,741/yr
For passive investors: Depreciation is non-cash, so a rental often shows a tax loss while cash-flowing — sheltering income. Rental losses are passive: they offset passive income freely, and up to $25,000/yr can offset ordinary (W-2) income if you actively participate and your MAGI is under $100k (phasing out to $0 by $150k); unused losses carry forward. On sale, claimed depreciation is recaptured at up to 25%, and gains may owe capital-gains tax (a 1031 exchange can defer both). Figures are a year-1 estimate at your 24.0% rate — not tax advice; consult a CPA.
Schools (NCES district)
- District
- Trigg County
- NCES district ID
- 2105580
- Math proficiency
- 23% ▼ -20.00%
- Reading proficiency
- 40% ▼ -16.00%
- Median HH income
- $44,636
- Composite
- 26.87/100
- National rank
- #7100
- State rank
- #90 of 165 in KY
Livability — Cadiz
- Score
- 62/100
- State rank
- #354
- US rank
- #16772
Category grades
Schools grade is shown separately in the Schools card above.
Census & demographics
- Population (ZIP)
- 12,912
Population outlook (Trigg County) Hauer SSP2
- Today (2025)
- 14,071 people
- By 2030
- 13,950 · -0.9%
- By 2040
- 13,575 · -3.5%
- By 2050
- 13,065 · -7.1%
- By 2075
- 11,990 · -14.8%
- By 2100
- 10,802 · -23.2%
Race, ethnicity, and origin ACS 2023
- Neighborhood character
- Predominantly White (88%)
- Race & ethnicity
- White 88% Two or more races 6% Black 4% Hispanic / Latino 3%
- Common ancestry
- Italian 2% Slovak 2% Iranian 1%
- Foreign-born
- 2% · Canada
- Languages at home
- 91% English-only · German/W. Germanic 7% Spanish 2%
Political lean MEDSL · Trigg
- 2024 margin
- Solid R (+52.4) · D 23.2% · R 75.5% · Other 1.3%
- 2008→2024 swing
- -22.6pp toward R · 2008: -29.8pp · 2024: -52.4pp
- All cycles
- 2024: R+52.4 2020: R+50.1 2016: R+49.6 2012: R+35.7 2008: R+29.8
Not yet ingested
- Civics
- —
Market trends
- HPI YoY
- ▼ -86.15%
- Current HPI
- 130.8351
- Rent YoY
- —
- Metro
- —
- State GDP YoY
- ▲ 1.81%
- F500 in state
- 4
Industry mix (Fortune 500 HQ in KY)
| Industry | F500 HQs | Revenue |
|---|---|---|
| Healthcare | 1 | $118B |
|
||
| Food / Beverage | 1 | $7B |
|
||
Price history
1 event — show timeline
- 2026-05-09 Listed $135,000 WKRMLS
Property tax history
+12.1%/yrLatest (2025): $901 · -0.8% YoY. Source: county tax records.
Cash-flow waterfall
monthlySold comps — $/sqft
last 12 mo · ≤1 miLoading sold comps…