329/331 Grant Blvd · Lehigh Acres, FL
Flood risk 1/10 · Minimal
- FEMA flood zone
- X (unshaded)
- Chance of flooding over 30 yrs
- 0.0%
- Est. flood insurance / yr
- $507 – $1,088
Fire risk 4/10 · Minor
- Est. fire insurance / yr
- $947 – $1,759
Heat risk 10/10 · Severe
- Hot days now (above 107°F)
- 7 days/yr
- Hot days in 30 yrs
- 29 days/yr
Wind risk 10/10 · Severe
- Chance of severe wind over 30 yrs
- 99.0%
Air-quality risk 2/10 · Minimal
- Unhealthy air days now
- 1 days/yr
- Unhealthy air days in 30 yrs
- 2 days/yr
Risk factors via First Street. Map © Google.
Why this score? — see what drove the F grade
The composite is a weighted blend of 9 inputs, each scored 0–100. Each bar is that input's sub-score; the figure is the points it added to the 100-point composite (weight × sub-score).
- Appreciation +10.0/10.0
- ARV discount +7.5/15.0
- Cash flow +4.8/30.0
- Schools +4.1/10.0
- Livability +3.0/5.0
- Condition / age +2.5/5.0
- Rent growth +1.3/5.0
- 1% rule +0.6/10.0
- DSCR +0.0/10.0
$509,999
🖨 Deal sheet (PDF) 📄 Offer letter ✓ Due diligence
Listing remarks MLS
Situated in the heart of Lehigh Acres, this duplex lot measures 80 by 125 feet. Located outside the flood zone, with no wetlands or protected species on site, this lot is shovel-ready and primed for development. Duplex lot for sale in this growing neighborhood of Lehigh Acres. Easy access to Sr. 82, Daniels Pkwy, Fort Myers Air Port, Edison Ford Museum, shopping, restaurants, schools, and the beaches of Fort Myers. Build an income-producing property.
Key facts
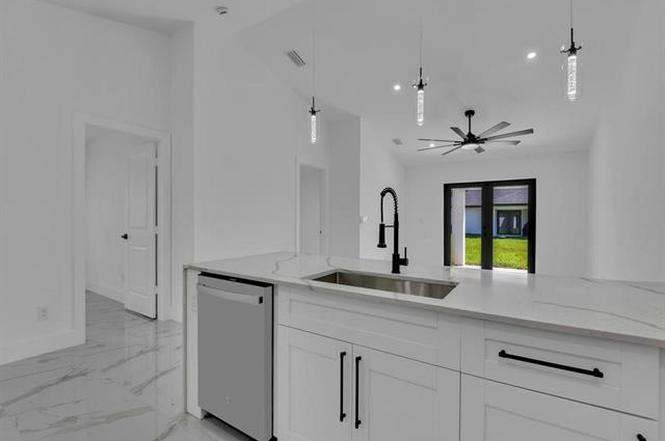
- Brand new duplex
- Recessed led lights
- Quartz vanities
Tags
Property features AI
Finance
- Other: Property consists of 2 units
- HOA & community: Non-gated community; No HOA amenities
Exterior
- Utilities: Well water; Septic sewer; Cable available
- Home design: Duplex residential income property; Located in Lehigh Estates; RM-2 zoning; Regular lot on a paved road
- Construction: Concrete block construction; Built in 2026
- Exterior features: Patio; Impact resistant windows; Stucco exterior; Shingle roof
Interior
- Flooring: Tile
- Bathrooms: 4 full bathrooms
- Heating & cooling: Central electric heat; Central electric cooling; Ceiling fans
- Interior features: Tile flooring
Neighborhood map
What this means for you Summary
Snapshot
- This is a 6-bed/4.0-bath land listed at $510k.
Deal economics
- At list price, monthly cash flow is $-1k ($-15k/yr) — negative.
- To cash-flow at today's rent, offer at most $328k (35.7% below list).
- To meet the 1% rule (rent ≥ 1% of price), the offer needs to be $287k (43.7% below list).
- Recommended offer: $287k (43.7% below list) — sets the bar for 1% rule.
- Cap rate 3.3% vs local median 4.7% in Lehigh Acres — below-typical yield; the buyer is paying a premium for something (appreciation thesis, condition, location) that the cap rate doesn't capture.
Location & tenants
- Location reads 59/100 on livability (#826 in FL) — a working-class tenant base; expect higher turnover. Strengths: cost of living A+, housing A+; Watch: crime C-, employment D+, amenities F.
- Lee (suburban): math 47% / reading 50% proficiency, ranked #42 of 73 in FL (top 58%) — families likely to look elsewhere, expect single-tenant / working-renter base with shorter leases.
- Zoned schools: Veterans Park Academy For The Arts (math 41% / reading 45%, grade F, #1,366 of 2,144 statewide, top 64%, 2,133 students, 36% FRL); Oak Hammock Middle School (math 43% / reading 41%, grade D-, #340 of 571 statewide, top 61%, 1,563 students, 56% FRL); Lehigh Senior High School (math 23% / reading 45%, grade F, #394 of 667 statewide, top 60%, 2,476 students, 57% FRL).
- Market conditions: Rents falling (-4.7%/yr); 2476 active listings in the ZIP; 6 comparable units currently listed for rent nearby; rentals at typical pace (median 23d on market — plan ~3-4 weeks tenant-placement turnaround); 15,411 units permitted in Lee County in 2024 (4,686 in 5+ unit buildings).
- At $2,870/mo this rent would consume 48% of the median local household income ($72k/yr) (locally 434% of renters already pay >50% of income on rent) — very limited rent-growth headroom before tenants either downsize or default.
Forward outlook
- In year one you build about $55k of equity ($4k loan paydown + $51k appreciation (10.0% local appreciation)).
- Lee County population projected at +44% by 2050 — long-run rental-demand tailwind backs the buy-and-hold thesis.
- By year 2, paydown + projected appreciation supports a ~$88k cash-out refi (75% LTV) — recoverable capital for the next deal without selling this one.
Negotiation context
- Only 4 days on market — expect competitive offers; lowballing is unlikely to land.
- 2 sale attempts since 2y ago with the ask held roughly flat each time — persistent listings suggest the price (not the market) is what's stuck; bring a comps-based counter.
- Current owner paid $53k; list at $510k implies a 854% gain — meaningful room to come down on a strong offer.
Risks & watch-outs
- Climate carrying-cost: severe wind risk, 99% chance of damaging wind over 30y; extreme-heat days projected 7→29/yr by 2055 (HVAC capex compounding) — expect insurance premiums to compound above CPI over the hold.
Questions for the listing agent
- What do current leases actually rent for vs. the listed asking? Can we see a recent rent roll and the last 12 months of T-12 income?
- Is there a deadline driving the sale (1031 exchange, divorce, estate, relocation)? That informs how much negotiation room exists.
- Schools are D-rated, which usually means shorter tenancies and higher turnover. Who's the typical renter profile here, and what's been the actual vacancy rate?
- The area grade is low — what's the realistic commute time and amenity access for the typical tenant pool here? Any planned neighborhood developments (good or bad) we should know about?
- What's the average days-on-market for RENTAL listings here right now (not sales)? A rising rental-DOM trend means longer vacancies and softer asking-rent achievability than the comps imply.
- What's the recent tenant-quality profile in this submarket — average credit score on applications, eviction rate, late-payment / NSF rate, and stable-employment percentage? A property-management company in the area should have these aggregated.
- How much new for-sale + rental construction is in the pipeline within 1–3 miles? Heavy new supply typically softens prices + rents 12–24 months out; constrained supply supports both.
Investment metrics
- 1% rule
- 0.56% ✗
- Cap rate
- 3.34%
- Cash-on-cash
- -10.56%
- DSCR
- 0.53
- GRM
- 14.8
CMA / ARV
No comps found within radius.
Projected returns pro-forma
10.0% appreciation · 0.0% rent growth · sell at horizon
- IRR
- 16.2%
- Equity multiple
- 2.33×
- Total profit
- $189,330
- Equity at exit
- $459,448
- IRR
- 15.1%
- Equity multiple
- 5.24×
- Total profit
- $605,531
- Equity at exit
- $990,816
Cash invested: $142,800 (down + closing). Projections, not guarantees.
Landlord ↔ Tenant lean methodology
- Overall (STATE)
- 87 Strongly Landlord-Friendly
- State Florida
- 87 Strongly Landlord-Friendly · R+3
- County
- — inherits STATE
- City
- — inherits STATE
ZIP-level market 33974
- Home prices YoY
- 5.8%
- Rents YoY
- -4.7%
- Active inventory
- 2476
- Price-to-rent
- 14.8×
Monthly cashflow live
- Estimated rent
- $2,870 high interval (Pro) →
- Mortgage (P&I)
- −$2,674
- Tax est. 1.5%
- −$637 /mo · $7,650/yr
- Insurance
- −$212
- HOA
- −$0
- Vacancy / Maint / Mgmt
- −$603
- Net cashflow
- $-1,257
Break-even live
Sensitivity live
| Price | -10% $-905 | -5% $-1,081 | +0% $-1,257 | +5% $-1,433 | +10% $-1,609 |
|---|---|---|---|---|---|
| Rent | -10% $-1,484 | -5% $-1,370 | +0% $-1,257 | +5% $-1,144 | +10% $-1,030 |
| Rate | -1.0pp $-1,000 | -0.5pp $-1,127 | base $-1,257 | +0.5pp $-1,389 | +1.0pp $-1,524 |
UW: 25.0% down · 7.5% · 30yr · 1.5% tax · 5.0% vac · 8.0% maint · 8.0% mgmt
Financing live
Cash to close
- Down payment
- $127,500
- Closing costs
- $15,300
- Reserves months
- —
- Total cash needed
- —
Loan-product check · same deal, 3 products live
Conventional
25% down · 7.5% · 30yr
- Down + closing
- —
- Monthly P&I
- —
- Monthly cashflow
- —
- DSCR
- —
- Eligible?
- —
Personal DTI + credit; lowest rate.
DSCR
20% down · 8.5% · 30yr
- Down + closing
- —
- Monthly P&I
- —
- Monthly cashflow
- —
- DSCR
- —
- Eligible?
- —
No personal income docs; deal must DSCR.
Hard money
10% down · 12.0% · 12mo
- Down + closing
- —
- Monthly P&I
- —
- Monthly cashflow
- —
- DSCR
- —
- Eligible?
- —
Short-term bridge; refi at stabilization.
Rent comps 6 comps
| Address | Beds | Baths | Sqft | Rent | $/sqft | DOM | Units | Dist |
|---|---|---|---|---|---|---|---|---|
| 19525 Fairhill Ct Lehigh Acres, FL | 6.0 | 3.0 | 2463 | $2,499 | $1.01 | 25d | 1 | 0.43mi |
| 11902 Savanna Lakes Blvd Lehigh Acres, FL | 6.0 | 3.0 | 3041 | $2,750 | $0.90 | 17d | 1 | 0.63mi |
| 11634 Savanna Lakes Blvd Lehigh Acres, FL | 5.0 | 3.0 | 2451 | $2,650 | $1.08 | 23d | 1 | 0.64mi |
| 11613 Savanna Lakes Blvd Lehigh Acres, FL | 5.0 | 3.0 | 2451 | $2,700 | $1.10 | 17d | 1 | 0.96mi |
| 19972 Green Pasture Rd Lehigh Acres, FL | 5.0 | 2.5 | 2959 | $3,000 | $1.01 | 23d | 1 | 1.00mi |
| 10601 Crossback Ln Lehigh Acres, FL | 5.0 | 3.0 | 2634 | $2,800 | $1.06 | 25d | 1 | 1.01mi |
Listing history 3 events
-
2026-06-22days on market $509,999 Active 4 DOM
-
2026-06-17remarks 687-char remark
-
2026-06-17$509,999 Active 1 DOM
ⓘ Source: listings_history table (triggers on properties + properties_extension) + one-shot
backfill from property_details.listing_events for pre-trigger history.
Climate risk First Street
- Flood 1/10 Low FEMA zone X (unshaded) · 0% chance over 30 yrs
- Wildfire 4/10 Moderate
- Heat 10/10 Extreme 7 d/yr ≥107°F today · 29 d/yr by 30 yrs out
- Wind 10/10 Extreme 99% chance of damaging wind over 30 yrs
- Air quality 2/10 Low 1 unhealthy d/yr today · 2 by 30 yrs out
Nearby sold comps map
Loading sold comps map…
Walkable amenities ~0.75 mi
Loading nearby amenities…
Taxation est. · year 1
- Rental income
- $34,443
- − Mortgage interest
- −$28,568
- − Property taxes
- −$7,650
- − Insurance
- −$2,550
- − Repairs & maintenance
- −$2,755
- − Management
- −$2,755
- − Depreciation
- −$14,836
- Taxable loss
- −$24,672
- Est. tax savings @ 24.0%
- +$5,921
- After-tax cash flow
- $-9,163/yr
For passive investors: Depreciation is non-cash, so a rental often shows a tax loss while cash-flowing — sheltering income. Rental losses are passive: they offset passive income freely, and up to $25,000/yr can offset ordinary (W-2) income if you actively participate and your MAGI is under $100k (phasing out to $0 by $150k); unused losses carry forward. On sale, claimed depreciation is recaptured at up to 25%, and gains may owe capital-gains tax (a 1031 exchange can defer both). Figures are a year-1 estimate at your 24.0% rate — not tax advice; consult a CPA.
Schools (NCES district)
- District
- Lee
- NCES district ID
- 1201080
- Math proficiency
- 47% ▼ -11.00%
- Reading proficiency
- 50% ▼ -4.00%
- Median HH income
- $49,518
- Composite
- 41.49/100
- National rank
- #3458
- State rank
- #42 of 73 in FL
Livability — Lehigh Acres
- Score
- 59/100
- State rank
- #826
- US rank
- #20055
Category grades
Schools grade is shown separately in the Schools card above.
Census & demographics
- Census place
- Lehigh Acres, FL
- County
- Lee County · 788,662 people
- City population
- 130,638
- Metro
- Cape Coral-Fort Myers, FL
- Population (ZIP)
- 19,927
- Household income
- $72,192
- Rent vs Own
- Severe rent burden
- 434.0
Population outlook (Lee County) Hauer SSP2
- Today (2025)
- 871,946 people
- By 2030
- 955,468 · +9.6%
- By 2040
- 1,113,587 · +27.7%
- By 2050
- 1,256,891 · +44.1%
- By 2075
- 1,560,270 · +78.9%
- By 2100
- 1,726,848 · +98.0%
Race, ethnicity, and origin ACS 2023
- Neighborhood character
- Diverse neighborhood (Simpson 0.64)
- Race & ethnicity
- Hispanic / Latino 52% Two or more races 31% White 26% Black 18%
- Hispanic origin (detail)
- Mexican 12% Puerto Rican 7% Cuban 20% Dominican 4%
- Common ancestry
- Hispanic 7% Italian 1% Portuguese 1%
- Foreign-born
- 32% · Canada, Jamaica
- Languages at home
- 48% English-only · Spanish 43% French/Haitian/Cajun 7% Other Indo-European 1%
Political lean MEDSL · Lee
- 2024 margin
- Strong R (+28.4) · D 35.5% · R 63.9%
- 2008→2024 swing
- -18.0pp toward R · 2008: -10.4pp · 2024: -28.4pp
- All cycles
- 2024: R+28.4 2020: R+19.2 2016: R+20.4 2012: R+16.6 2008: R+10.4
Not yet ingested
- Civics
- —
Market trends
- HPI YoY
- ▲ 16.53%
- Current HPI
- 303.3399
- Rent YoY
- ▼ -4.68%
- Metro
- Cape Coral-Fort Myers, FL
- State GDP YoY
- ▲ 3.28%
- F500 in state
- 36
Industry mix (Fortune 500 HQ in FL)
| Industry | F500 HQs | Revenue |
|---|---|---|
| Industrial Technology | 2 | $29B |
|
||
| Insurance | 2 | $17B |
|
||
| Retail | 1 | $60B |
|
||
| Technology Distribution | 1 | $58B |
|
||
| Homebuilding | 1 | $35B |
|
||
| Technology Manufacturing | 1 | $35B |
|
||
Price history
+779.3% since first listed7 events — show timeline
- 2026-06-17 Listed $509,999 NAPLESMLS
- 2025-02-18 Sold (MLS) $53,450 NAPLESMLS
- 2025-01-31 Pending — NAPLESMLS
- 2025-01-28 Price Changed $53,450 NAPLESMLS
- 2025-01-07 Price Changed $54,450 NAPLESMLS
- 2024-12-06 Price Changed $56,000 NAPLESMLS
- 2024-11-07 Listed $58,000 NAPLESMLS
Cash-flow waterfall
monthlySold comps — $/sqft
last 12 mo · ≤1 miLoading sold comps…