16079 Yarnell St Unit C15 · Los Angeles, CA
Flood risk 1/10 · Minimal
- FEMA flood zone
- X (unshaded)
- Chance of flooding over 30 yrs
- 0.0%
- Est. flood insurance / yr
- $507 – $1,088
Fire risk 7/10 · Major
- Est. fire insurance / yr
- $659 – $1,223
Heat risk 6/10 · Moderate
- Hot days now (above 99°F)
- 8 days/yr
- Hot days in 30 yrs
- 21 days/yr
Wind risk 1/10 · Minimal
- Chance of severe wind over 30 yrs
- —
Air-quality risk 6/10 · Moderate
- Unhealthy air days now
- 10 days/yr
- Unhealthy air days in 30 yrs
- 12 days/yr
Risk factors via First Street. Map © Google.
Why this score? — see what drove the D+ grade
The composite is a weighted blend of 9 inputs, each scored 0–100. Each bar is that input's sub-score; the figure is the points it added to the 100-point composite (weight × sub-score).
- Cash flow +21.8/30.0
- DSCR +7.0/10.0
- 1% rule +5.7/10.0
- Schools +3.6/10.0
- Livability +3.4/5.0
- Rent growth +2.5/5.0
- Condition / age +2.5/5.0
- ARV discount +0.0/15.0
- Appreciation +0.0/10.0
$250,000
🖨 Deal sheet 📄 Offer letter ✓ Due diligence
Listing remarks MLS
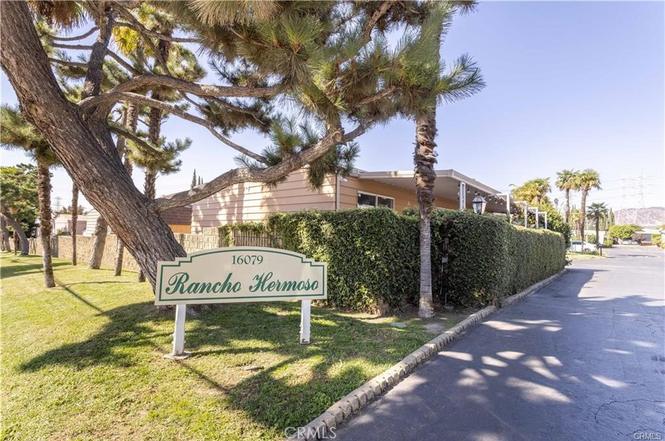
Welcome to Rancho Hermoso, a premier community in Sylmar where this stunning manufactured home is ready for you. Expertly remodeled, this home boasts a range of impressive features. Begin your tour on the generous front porch that escorts you into a spacious living room. The bathrooms have been tastefully updated, and the home is meticulously maintained, ensuring you can enjoy the home right away. This all-ages community offers a wonderful array of amenities, including a sparkling pool and recreation center. Enjoy the comfort of an ample parking space for 3 cars. While the title lists the home as 672 sqft, an additional 204 sqft room offers a total of 876 sqft of comfortable living space. Although officially labeled as a two-bedroom home, there is an additional room currently used as a 3rd bedroom. Dont miss out!
Key facts
- Updated bathrooms
- Spacious carport
- Recreation center
Tags
Property features AI
Finance
- Other: Lot characterized as 0-1 unit/acre; Elevation measured in feet; Pets allowed with size limit; Directions: Foothill and Yarnell
- HOA & community: Part of an association; Land lease of $920
Exterior
- Parking: 3 garage spaces (3 total parking spaces); Located in Rancho Hermoso park
- Utilities: Public sewer; District / public water
- Home design: Single-story property; Mobile home (12 ft by 56 ft) remains on site; Living area per assessor's data
- Construction: Year built per assessor
- Exterior features: Association-managed community pool; Street lighting
Interior
- Bathrooms: 2 full bathrooms
- Interior features: Side door entry; Single-level home
- Laundry & utility: Laundry in an individual room
Neighborhood map
What this means for you Summary
Snapshot
- This is a 2-bed/2.0-bath manufactured listed at $250k.
Deal economics
- At list price, monthly cash flow is $390 ($5k/yr) — positive.
- The deal already cash-flows at list — no discount required.
- Meets the 1% rule at list price ($3k rent vs $250k).
- Cap rate 8.2% vs local median 2.1% in Los Angeles — top-decile yield for the area; either an underpriced asset or a hidden risk that comps aren't pricing in. Stress-test before assuming the spread holds.
Location & tenants
- Location reads 68/100 on livability (#273 in CA) — a middle-class / working-renter tenant base. Strengths: amenities A+, commute A+, employment B; Watch: health & safety C-, schools D+, crime F.
- Los Angeles Unified (urban): math 29% / reading 54% proficiency, ranked #223 of 517 in CA (top 43%) — families likely to look elsewhere, expect single-tenant / working-renter base with shorter leases; 67% free/reduced lunch — lower-income household profile, screen leases tightly.
- Market conditions: Rents flat; 183 active listings in the ZIP; 8 comparable units currently listed for rent nearby; rentals at typical pace (median 25d on market — plan ~3-4 weeks tenant-placement turnaround); solid renter incomes; 19,697 units permitted in Los Angeles County in 2024 (9,426 in 5+ unit buildings).
- This rent runs 33% of the median local income ($98k/yr) — at the standard rent-burdened threshold; future hikes will face affordability resistance.
Forward outlook
- Local home prices are declining (-3.0%/yr); year-one equity from $2k of loan paydown is wiped out by about $8k of value loss. Plan a longer hold.
- Los Angeles County population projected at +9% by 2050 — modest demand growth; plan on rents tracking national, not racing it.
Negotiation context
- Only 1 days on market — expect competitive offers; lowballing is unlikely to land.
- 3 sale attempts since 9y ago with the ask held roughly flat each time — persistent listings suggest the price (not the market) is what's stuck; bring a comps-based counter.
- Current owner paid $180k; 39% above their basis — modest negotiation headroom, anchor on the comps not their cost.
Risks & watch-outs
- Climate carrying-cost: major wildfire risk; extreme-heat days projected 8→21/yr by 2055 (HVAC capex compounding) — expect insurance premiums to compound above CPI over the hold.
Questions for the listing agent
- Built in 1973 — when were the roof, HVAC, electrical panel, plumbing, and water heater last replaced?
- Is there a deadline driving the sale (1031 exchange, divorce, estate, relocation)? That informs how much negotiation room exists.
- Schools are D-rated, which usually means shorter tenancies and higher turnover. Who's the typical renter profile here, and what's been the actual vacancy rate?
- Crime grade is F in this area — have there been break-ins, vandalism, or insurance claims at this property in the last 3 years? What carrier currently insures it and at what premium?
- The area grade is low — what's the realistic commute time and amenity access for the typical tenant pool here? Any planned neighborhood developments (good or bad) we should know about?
- What's the average days-on-market for RENTAL listings here right now (not sales)? A rising rental-DOM trend means longer vacancies and softer asking-rent achievability than the comps imply.
- What's the recent tenant-quality profile in this submarket — average credit score on applications, eviction rate, late-payment / NSF rate, and stable-employment percentage? A property-management company in the area should have these aggregated.
- How much new for-sale + rental construction is in the pipeline within 1–3 miles? Heavy new supply typically softens prices + rents 12–24 months out; constrained supply supports both.
Investment metrics
- 1% rule
- 1.07% ✓
- Cap rate
- 8.16%
- Cash-on-cash
- 6.68%
- DSCR
- 1.30
- GRM
- 7.8
CMA / ARV
- ARV (on-the-fly)
- $179,580
- Comps found
- 1
Show comp detail 1 sale within ~0.75 mi
| Address | Dist | Beds/Ba | Sqft | Sold | Price | $/sf | Match |
|---|---|---|---|---|---|---|---|
| 16079 Yarnell St Unit C15 | 0.00mi | 2/2.0 | 876 (0%) | 19mo | $180,000 | $205 | 84 |
Match score weights: distance 35% · size 25% · config 20% · recency 20%. Top-matched comps best support the ARV.
Projected returns pro-forma
-3.0% appreciation · 0.02% rent growth · sell at horizon
- IRR
- -9.4%
- Equity multiple
- 0.66×
- Total profit
- $-23,450
- Equity at exit
- $37,276
- IRR
- -4.6%
- Equity multiple
- 0.74×
- Total profit
- $-18,462
- Equity at exit
- $21,615
Cash invested: $70,000 (down + closing). Projections, not guarantees.
Landlord ↔ Tenant lean methodology
- Overall (CITY)
- 0 Strongly Tenant-Friendly
- State California
- 18 Strongly Tenant-Friendly · D+13
- County
- — inherits STATE
- City Los Angeles
- 0 Strongly Tenant-Friendly · D+22
ZIP-level market 91342
- Rents YoY
- 0.0%
- Active inventory
- 183
- Price-to-rent
- 7.8×
Monthly cashflow live
- Estimated rent
- $2,680 high interval (Pro) →
- Mortgage (P&I)
- −$1,311
- Tax est. 1.5%
- −$312 /mo · $3,750/yr
- Insurance
- −$104
- HOA
- −$0
- Vacancy / Maint / Mgmt
- −$563
- Net cashflow
- $390
Break-even live
UW: 25.0% down · 7.5% · 30yr · 1.5% tax · 5.0% vac · 8.0% maint · 8.0% mgmt
Financing live
Cash to close
- Down payment
- $62,500
- Closing costs
- $7,500
- Reserves months
- —
- Total cash needed
- —
Loan-product check · same deal, 3 products live
Conventional
25% down · 7.5% · 30yr
- Down + closing
- —
- Monthly P&I
- —
- Monthly cashflow
- —
- DSCR
- —
- Eligible?
- —
Personal DTI + credit; lowest rate.
DSCR
20% down · 8.5% · 30yr
- Down + closing
- —
- Monthly P&I
- —
- Monthly cashflow
- —
- DSCR
- —
- Eligible?
- —
No personal income docs; deal must DSCR.
Hard money
10% down · 12.0% · 12mo
- Down + closing
- —
- Monthly P&I
- —
- Monthly cashflow
- —
- DSCR
- —
- Eligible?
- —
Short-term bridge; refi at stabilization.
Rent comps 8 comps
| Address | Beds | Baths | Sqft | Rent | $/sqft | DOM | Units | Dist |
|---|---|---|---|---|---|---|---|---|
| 16601 Foothill Blvd Rancho Cascades, CA | 1.0–2.0 | 1.0–2.0 | 824 | $2,358 | $2.86 | 1d | 10 | 0.64mi |
| 13811 Glenoaks Blvd Rancho Cascades, CA | 1.0–2.0 | 1.0–2.0 | 783 | $2,395 | $3.06 | 15d | 1 | 0.71mi |
| 16736 Nicklaus Dr #39 Rancho Cascades, CA | 2.0 | 2.0 | 1061 | $3,650 | $3.44 | 43d | 1 | 0.85mi |
| 13035 San Fernando Rd Unit 1 Sylmar, CA | 3.0 | 1.0 | 1000 | $2,445 | $2.44 | 24d | 1 | 1.02mi |
| 15878 Larkspur St Sylmar, CA | 1.0 | 1.0 | 755 | $1,700 | $2.25 | 20d | 2 | 1.06mi |
| 13637 Fellows Ave Unit 5 Sylmar, CA | 3.0 | 2.0 | 1000 | $2,979 | $2.98 | 43d | 1 | 1.08mi |
| 13615 Fellows Ave Sylmar, CA | 3.0–4.0 | 2.0–3.0 | 1094 | $2,979 | $2.72 | 20d | 2 | 1.09mi |
| 13310 Glenoaks Blvd Sylmar, CA | 3.0 | 2.0 | 800 | $3,900 | $4.88 | 24d | 1 | 1.42mi |
Listing history 2 events
-
2026-06-15remarks 699-char remark
-
2026-06-15$250,000 Active 1 DOM
ⓘ Source: listings_history table (triggers on properties + properties_extension) + one-shot
backfill from property_details.listing_events for pre-trigger history.
Climate risk First Street
- Flood 1/10 Low FEMA zone X (unshaded) · 0% chance over 30 yrs
- Wildfire 7/10 Severe
- Heat 6/10 Major 8 d/yr ≥99°F today · 21 d/yr by 30 yrs out
- Wind 1/10 Low
- Air quality 6/10 Major 10 unhealthy d/yr today · 12 by 30 yrs out
Nearby sold comps map
Loading sold comps map…
Walkable amenities ~0.75 mi
Loading nearby amenities…
Taxation est. · year 1
- Rental income
- $32,164
- − Mortgage interest
- −$14,004
- − Property taxes
- −$3,750
- − Insurance
- −$1,250
- − Repairs & maintenance
- −$2,573
- − Management
- −$2,573
- − Depreciation
- −$7,273
- Taxable income
- $741
- Est. tax owed @ 24.0%
- −$178
- After-tax cash flow
- $4,499/yr
For passive investors: Depreciation is non-cash, so a rental often shows a tax loss while cash-flowing — sheltering income. Rental losses are passive: they offset passive income freely, and up to $25,000/yr can offset ordinary (W-2) income if you actively participate and your MAGI is under $100k (phasing out to $0 by $150k); unused losses carry forward. On sale, claimed depreciation is recaptured at up to 25%, and gains may owe capital-gains tax (a 1031 exchange can defer both). Figures are a year-1 estimate at your 24.0% rate — not tax advice; consult a CPA.
Schools (NCES district)
- District
- Los Angeles Unified
- NCES district ID
- 0622710
- Math proficiency
- 29% ▼ -4.00%
- Reading proficiency
- 54% ▲ 10.00%
- Median HH income
- $50,403
- Composite
- 35.67/100
- National rank
- #4875
- State rank
- #223 of 517 in CA
Livability — Los Angeles
- Score
- 68/100
- State rank
- #273
- US rank
- #9237
Category grades
Schools grade is shown separately in the Schools card above.
Census & demographics
- Census place
- Los Angeles, CA
- County
- Los Angeles County · 9,444,647 people
- City population
- 3,838,149
- Metro
- Los Angeles-Long Beach-Anaheim, CA
- Population (ZIP)
- 93,301
- Household income
- $98,118
- Rent vs Own
- Severe rent burden
- 2559.0
Population outlook (Los Angeles County) Hauer SSP2
- Today (2025)
- 10,940,515 people
- By 2030
- 11,256,481 · +2.9%
- By 2040
- 11,729,929 · +7.2%
- By 2050
- 11,948,407 · +9.2%
- By 2075
- 11,818,114 · +8.0%
- By 2100
- 10,842,928 · -0.9%
Race, ethnicity, and origin ACS 2023
- Neighborhood character
- Predominantly Hispanic (74%)
- Race & ethnicity
- Hispanic / Latino 74% Two or more races 23% White 12% Asian 7% Black 3% Native American 2%
- Hispanic origin (detail)
- Mexican 59%
- Common ancestry
- Italian 1%
- Foreign-born
- 36% · Canada, South Korea, Dominican Republic
- Languages at home
- 32% English-only · Spanish 59% Tagalog/Filipino 4% Other Indo-European 3%
Political lean MEDSL · Los Angeles
- 2024 margin
- Solid D (+32.9) · D 64.8% · R 31.9% · Other 3.3%
- 2008→2024 swing
- -7.4pp toward R · 2008: 40.4pp · 2024: 32.9pp
- All cycles
- 2024: D+32.9 2020: D+44.2 2016: D+48.0 2012: D+40.0 2008: D+40.4
Not yet ingested
- Civics
- —
Market trends
- HPI YoY
- ▼ -921.77%
- Current HPI
- 440.1462
- Rent YoY
- ▬ 0.02%
- Metro
- Los Angeles-Long Beach-Anaheim, CA
- State GDP YoY
- ▲ 3.21%
- F500 in state
- 116
Industry mix (Fortune 500 HQ in CA)
| Industry | F500 HQs | Revenue |
|---|---|---|
| Technology | 27 | $1,492B |
|
||
| Financial Services | 3 | $174B |
|
||
| Retail | 3 | $44B |
|
||
| Insurance | 3 | $26B |
|
||
| Media / Entertainment | 2 | $115B |
|
||
| Pharmaceuticals / Biotech | 2 | $62B |
|
||
Price history
+681.2% since first listed7 events — show timeline
- 2026-06-14 Listed $250,000 CRMLS
- 2024-11-27 Sold (MLS) $180,000 CRMLS
- 2024-11-08 Pending — CRMLS
- 2024-10-04 Listed $199,900 CRMLS
- 2017-05-02 Sold (MLS) $32,000 CRMLS
- 2017-04-09 Pending — CRMLS
- 2017-03-31 Listed $32,000 CRMLS
Cash-flow waterfall
monthlySold comps — $/sqft
last 12 mo · ≤1 miLoading sold comps…