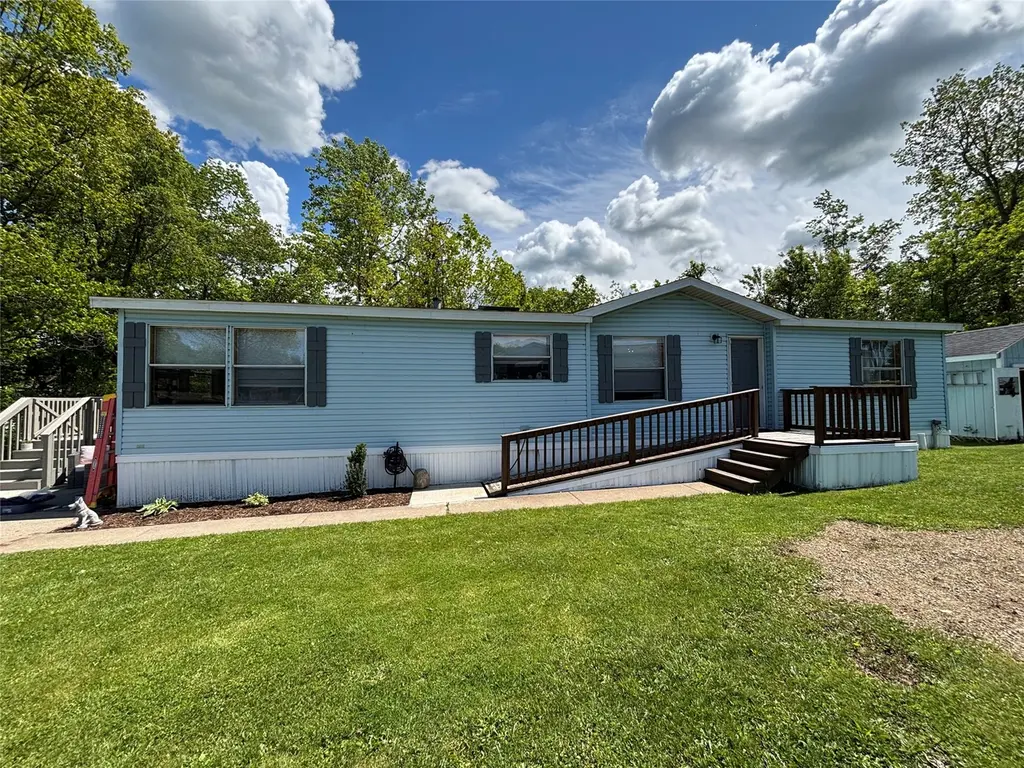
1804 Green View Dr · Erie, PA
Flood risk 6/10 · Moderate
- FEMA flood zone
- X (unshaded)
- Chance of flooding over 30 yrs
- 0.54%
- Est. flood insurance / yr
- $473 – $860
Fire risk 1/10 · Minimal
- Est. fire insurance / yr
- $511 – $949
Heat risk 1/10 · Minimal
- Hot days now (above 88°F)
- 7 days/yr
- Hot days in 30 yrs
- 18 days/yr
Wind risk 1/10 · Minimal
- Chance of severe wind over 30 yrs
- —
Air-quality risk 2/10 · Minimal
- Unhealthy air days now
- 1 days/yr
- Unhealthy air days in 30 yrs
- 3 days/yr
Risk factors via First Street. Map © Google.
Why this score? — see what drove the C- grade
The composite is a weighted blend of 9 inputs, each scored 0–100. Each bar is that input's sub-score; the figure is the points it added to the 100-point composite (weight × sub-score).
- Cash flow +17.2/30.0
- 1% rule +10.0/10.0
- DSCR +5.4/10.0
- Schools +5.1/10.0
- Livability +4.2/5.0
- ARV discount +3.6/15.0
- Rent growth +2.5/5.0
- Condition / age +2.5/5.0
- Appreciation +0.0/10.0
$74,900
🖨 Deal sheet 📄 Offer letter ✓ Due diligence
Listing remarks MLS
WONDERFUL SUMMIT HEIGHTS MOBILE HOME PARK LOCATED IN THE CUL-DE-SAC AREA WITH MATURE TREES BEHIND. THREE BEDROOM, TWO BATH DOUBLE WIDE HOME FEATURES HANDICAP RAMP TO FRONT DOOR. SPACIOUS EAT IN KITCHEN WITH REFRIGERATOR, GAS RANGE, DOUBLE STAINLESS STEEL SINK, SKYLIGHT, BUILTINS & PLENTY OF CABINETRY. SPACIOUS LIVING ROOM WITH CORNER GAS LOGS GLOWING EMBERS FIREPLACE. DOUBLE FRENCH DOORS LEADS TO THE MASTER BEDROOM WITH A WALK IN CLOSET, GARDEN TUB, SEPARATE SHOWER, AND SKYLIGHT. OTHER END OF THE HOME FEATURE TWO ADDITIONAL BEDROOMS AND ANOTHER COMMON BATHROOM. OUTSIDE IS PARKING FOR TWO VEHICLES, STORAGE SHED AND A DECK OFF OF THE LAUDRY ROOM. THE HOME IS IN NEED OF SOME COSMETIC WORK. LOT RENT IS CURRENTLY $437/MONTH AND INCLUDES SEWER. THE FURNACE WAS UPDATED IN 9/2022, GAS HOT WATER TANK 4/2008.
Key facts
- 2 parking spots
- Built 1991
- Listed 19 days
Property features AI
Finance
- Other: Directions: Robinson to Highline to Green View — last house at the end of the street
- HOA & community: Homeowners association with monthly fee of $630 (includes trash)
Exterior
- Parking: 2 total parking spaces
- Security: Fire alarm; Accessible entrance
- Utilities: Public water; Public sewer; Natural gas available
- Home design: Residential mobile home; Double wide; Updated / remodeled condition; Composition roof; Located in Summit Heights subdivision; Zoned R-2
- Construction: Vinyl siding
- Exterior features: Deck; Level lot; Paved road access
Interior
- Kitchen: Gas oven; Gas range; Refrigerator
- Flooring: Laminate flooring; Vinyl flooring
- Bathrooms: 2 full bathrooms
- Heating & cooling: Forced air heating; Ceiling fans; No central air
- Interior features: Ceiling fans; Skylights; Window coverings and drapes; Gas fireplace (1)
Neighborhood map
What this means for you Summary
Snapshot
- This is a 3-bed/2.0-bath manufactured listed at $75k.
Deal economics
- At list price, monthly cash flow is $54 ($643/yr) — positive.
- The deal already cash-flows at list — no discount required.
- Meets the 1% rule at list price ($2k rent vs $75k).
- Recommended offer: $74k (1.5% below list) — sets the bar for market timing.
- Cap rate 7.2% vs local median 5.2% in Erie — top-decile yield for the area; either an underpriced asset or a hidden risk that comps aren't pricing in. Stress-test before assuming the spread holds.
Location & tenants
- Location reads 83/100 on livability (#109 in PA, #840 nationally) — a professional / high-income tenant draw. Strengths: amenities A+, commute A+, cost of living A+; Watch: crime D+, employment F.
- Fort Leboeuf SD (rural): math 52% / reading 68% proficiency, ranked #77 of 539 in PA (top 14%) — acceptable for families but not a draw, mixed tenant base, ~2y average lease.
- Market conditions: 116 active listings in the ZIP; 364 units permitted in Erie County in 2024 (188 in 5+ unit buildings).
Forward outlook
- Local home prices are declining (-3.0%/yr); year-one equity from $518 of loan paydown is wiped out by about $2k of value loss. Plan a longer hold.
- Erie County population projected at -14% by 2050 — secular population decline; favor cash flow + early exit over multi-decade hold.
Negotiation context
- It's been on market 20 days — a 2% lower offer ($74k) is reasonable based on typical stale-listing flexibility.
- 2 sale attempts since 3y ago with the ask held roughly flat each time — persistent listings suggest the price (not the market) is what's stuck; bring a comps-based counter.
- Current owner paid $50k; list at $75k implies a 50% gain — meaningful room to come down on a strong offer.
Risks & watch-outs
- Watch-outs: HOA is 42% of rent.
- Climate carrying-cost: major flood risk — expect insurance premiums to compound above CPI over the hold.
Questions for the listing agent
- What does the HOA fee cover, when was the last increase, and are there any pending special assessments or reserve-fund shortfalls?
- Is there a deadline driving the sale (1031 exchange, divorce, estate, relocation)? That informs how much negotiation room exists.
- Crime grade is D in this area — have there been break-ins, vandalism, or insurance claims at this property in the last 3 years? What carrier currently insures it and at what premium?
- What's the average days-on-market for RENTAL listings here right now (not sales)? A rising rental-DOM trend means longer vacancies and softer asking-rent achievability than the comps imply.
- What's the recent tenant-quality profile in this submarket — average credit score on applications, eviction rate, late-payment / NSF rate, and stable-employment percentage? A property-management company in the area should have these aggregated.
- How much new for-sale + rental construction is in the pipeline within 1–3 miles? Heavy new supply typically softens prices + rents 12–24 months out; constrained supply supports both.
Investment metrics
- 1% rule
- 2.01% ✓
- Cap rate
- 7.15%
- Cash-on-cash
- 3.07%
- DSCR
- 1.14
- GRM
- 4.2
CMA / ARV
- ARV (on-the-fly)
- $68,992
- Comps found
- 12
Show comp detail 12 sales within ~0.75 mi
| Address | Dist | Beds/Ba | Sqft | Sold | Price | $/sf | Match |
|---|---|---|---|---|---|---|---|
| 1895 Northwood Ln | 0.16mi | 3/2.0 | 1,568 (0%) | 11mo | $53,500 | $34 | 83 |
| 8234 Willow Glen Gln | 0.28mi | 3/2.0 | 1,568 (0%) | 7mo | $105,000 | $67 | 81 |
| 1859 Northwood Ln | 0.13mi | 3/2.0 | 1,624 (+4%) | 8mo | $62,000 | $38 | 81 |
| 8250 Highline Blvd | 0.24mi | 4/2.0 (+1) | 1,568 (0%) | 17mo | $78,000 | $50 | 70 |
| 8223 Timberwood Ln | 0.26mi | 4/2.0 (+1) | 1,512 (-4%) | 9mo | $60,000 | $40 | 69 |
| 1526 Glenhaven Ln | 0.24mi | 4/2.0 (+1) | 1,568 (0%) | 18mo | $55,000 | $35 | 69 |
| 8187 Highline Blvd | 0.02mi | 4/2.0 (+1) | 1,680 (+7%) | 17mo | $8,000 | $5 | 68 |
| 8191 Willow Glen Dr | 0.23mi | 3/2.0 | 1,456 (-7%) | 15mo | $94,400 | $65 | 64 |
| 1520 Pinegrove Way | 0.24mi | 3/2.0 | 1,352 (-14%) | 2mo | $102,500 | $76 | 64 |
| 1731 Edgewood Dr | 0.15mi | 4/3.0 (+1) | 1,768 (+13%) | 2mo | $97,500 | $55 | 62 |
| 1632 Edgewood Dr | 0.22mi | 4/2.0 (+1) | 1,344 (-14%) | 7mo | $59,500 | $44 | 55 |
| 1595 Edgewood Dr | 0.23mi | 3/2.0 | 1,344 (-14%) | 13mo | $18,000 | $13 | 54 |
Match score weights: distance 35% · size 25% · config 20% · recency 20%. Top-matched comps best support the ARV.
Projected returns pro-forma
-3.0% appreciation · 3.0% rent growth · sell at horizon
- IRR
- -10.9%
- Equity multiple
- 0.60×
- Total profit
- $-8,323
- Equity at exit
- $11,168
- IRR
- -0.8%
- Equity multiple
- 0.94×
- Total profit
- $-1,223
- Equity at exit
- $6,476
Cash invested: $20,972 (down + closing). Projections, not guarantees.
Landlord ↔ Tenant lean methodology
- Overall (STATE)
- 62 Landlord-Friendly
- State Pennsylvania
- 62 Landlord-Friendly · EVEN
- County
- — inherits STATE
- City
- — inherits STATE
ZIP-level market 16509
- Home prices YoY
- -30.7%
- Active inventory
- 116
- Price-to-rent
- 4.2×
Monthly cashflow live
- Estimated rent
- $1,503 medium interval (Pro) →
- Mortgage (P&I)
- −$393
- Tax from tax record
- −$80 /mo · $956/yr
- Insurance
- −$31
- HOA
- −$630
- Vacancy / Maint / Mgmt
- −$316
- Net cashflow
- $54
Break-even live
UW: 25.0% down · 7.5% · 30yr · 1.5% tax · 5.0% vac · 8.0% maint · 8.0% mgmt
Financing live
Cash to close
- Down payment
- $18,725
- Closing costs
- $2,247
- Reserves months
- —
- Total cash needed
- —
Loan-product check · same deal, 3 products live
Conventional
25% down · 7.5% · 30yr
- Down + closing
- —
- Monthly P&I
- —
- Monthly cashflow
- —
- DSCR
- —
- Eligible?
- —
Personal DTI + credit; lowest rate.
DSCR
20% down · 8.5% · 30yr
- Down + closing
- —
- Monthly P&I
- —
- Monthly cashflow
- —
- DSCR
- —
- Eligible?
- —
No personal income docs; deal must DSCR.
Hard money
10% down · 12.0% · 12mo
- Down + closing
- —
- Monthly P&I
- —
- Monthly cashflow
- —
- DSCR
- —
- Eligible?
- —
Short-term bridge; refi at stabilization.
HOA detail
- Monthly dues
- $630 · $7,560/yr
- Likely covers
- watersewergas
Listing history 15 events
-
2026-06-19days on market $74,900 Active 20 DOM
-
2026-06-18days on market $74,900 Active 19 DOM
-
2026-06-17days on market $74,900 Active 18 DOM
-
2026-06-16days on market $74,900 Active 17 DOM
-
2026-06-15days on market $74,900 Active 16 DOM
-
2026-06-14days on market $74,900 Active 14 DOM
-
2026-06-13days on market $74,900 Active 13 DOM
-
2026-06-10days on market $74,900 Active 11 DOM
-
2026-06-09days on market $74,900 Active 10 DOM
-
2026-06-08days on market $74,900 Active 9 DOM
-
2026-06-07days on market $74,900 Active 8 DOM
-
2026-06-02days on market $74,900 Active 3 DOM
-
2026-06-01days on market $74,900 Active 2 DOM
-
2026-05-30remarks 182-char remark
-
2026-05-30$74,900 Active 1 DOM
ⓘ Source: listings_history table (triggers on properties + properties_extension) + one-shot
backfill from property_details.listing_events for pre-trigger history.
Tax reassessment forecast PA · Partial reset (capped growth)
- Current annual tax
- $956 · $80/mo
- Projected year-2 tax
- $1,070 · $89/mo
- Expected delta
- +$114/yr (+$9/mo · 11.9%)
ⓘ Screening estimate from a state-policy table — verify with the county assessor before closing.
Climate risk First Street
- Flood 6/10 Major FEMA zone X (unshaded) · 54% chance over 30 yrs
- Wildfire 1/10 Low
- Heat 1/10 Low 7 d/yr ≥88°F today · 18 d/yr by 30 yrs out
- Wind 1/10 Low
- Air quality 2/10 Low 1 unhealthy d/yr today · 3 by 30 yrs out
Nearby sold comps map
Loading sold comps map…
Walkable amenities ~0.75 mi
Loading nearby amenities…
Taxation est. · year 1
- Rental income
- $18,034
- − Mortgage interest
- −$4,196
- − Property taxes
- −$956
- − Insurance
- −$374
- − Repairs & maintenance
- −$1,443
- − Management
- −$1,443
- − HOA
- −$7,560
- − Depreciation
- −$2,179
- Taxable loss
- −$116
- Est. tax savings @ 24.0%
- +$28
- After-tax cash flow
- $671/yr
For passive investors: Depreciation is non-cash, so a rental often shows a tax loss while cash-flowing — sheltering income. Rental losses are passive: they offset passive income freely, and up to $25,000/yr can offset ordinary (W-2) income if you actively participate and your MAGI is under $100k (phasing out to $0 by $150k); unused losses carry forward. On sale, claimed depreciation is recaptured at up to 25%, and gains may owe capital-gains tax (a 1031 exchange can defer both). Figures are a year-1 estimate at your 24.0% rate — not tax advice; consult a CPA.
Schools (NCES district)
- District
- Fort Leboeuf SD
- NCES district ID
- 4209990
- Math proficiency
- 52% ▼ -12.00%
- Reading proficiency
- 68% ▼ -6.00%
- Median HH income
- $54,607
- Composite
- 51.46/100
- National rank
- #1725
- State rank
- #77 of 539 in PA
Livability — Erie
- Score
- 83/100
- State rank
- #109
- US rank
- #840
Category grades
Schools grade is shown separately in the Schools card above.
Census & demographics
- County
- Erie County · 92,215 people
- City population
- 92,215
- Metro
- Erie, PA
- Population (ZIP)
- 28,595
- Household income
- $68,846
- Rent vs Own
- Severe rent burden
- 870.0
Population outlook (Erie County) Hauer SSP2
- Today (2025)
- 272,159 people
- By 2030
- 266,299 · -2.2%
- By 2040
- 250,987 · -7.8%
- By 2050
- 234,925 · -13.7%
- By 2075
- 199,164 · -26.8%
- By 2100
- 162,985 · -40.1%
Race, ethnicity, and origin ACS 2023
- Neighborhood character
- Predominantly White (87%)
- Race & ethnicity
- White 87% Two or more races 6% Black 4% Hispanic / Latino 3% Asian 1%
- Common ancestry
- Romanian 14% Slovak 4% Scotch-Irish 2%
- Foreign-born
- 6% · Canada
- Languages at home
- 92% English-only · Russian/Polish/Slavic 3% German/W. Germanic 1% Spanish 1%
Political lean MEDSL · Erie
- 2024 margin
- Toss-up / Even · D 49.0% · R 50.0%
- 2008→2024 swing
- -20.9pp toward R · 2008: 19.9pp · 2024: -1.0pp
- All cycles
- 2024: R+1.0 2020: D+1.0 2016: R+2.0 2012: D+16.9 2008: D+19.9
Not yet ingested
- Civics
- —
Market trends
- HPI YoY
- ▼ -106.54%
- Current HPI
- 240.361
- Rent YoY
- —
- Metro
- Erie, PA
- State GDP YoY
- ▲ 1.68%
- F500 in state
- 34
Industry mix (Fortune 500 HQ in PA)
| Industry | F500 HQs | Revenue |
|---|---|---|
| Healthcare | 2 | $309B |
|
||
| Insurance | 2 | $27B |
|
||
| Telecommunications / Media | 1 | $124B |
|
||
| Industrial Distribution | 1 | $22B |
|
||
| Financial Services | 1 | $20B |
|
||
| Chemicals / Materials | 1 | $18B |
|
||
Price history
+18.9% since first listed7 events — show timeline
- 2026-05-29 Listed $74,900 GEBOR
- 2023-09-28 Sold (MLS) $49,900 GEBOR
- 2023-08-27 Pending — GEBOR
- 2023-08-19 Delisted — GEBOR
- 2023-08-03 Price Changed $49,900 GEBOR
- 2023-07-25 Price Changed $55,000 GEBOR
- 2023-06-26 Listed $63,000 GEBOR
Property tax history
+2.8%/yrLatest (2026): $956 · +4.8% YoY. Source: county tax records.
Cash-flow waterfall
monthlySold comps — $/sqft
last 12 mo · ≤1 miLoading sold comps…