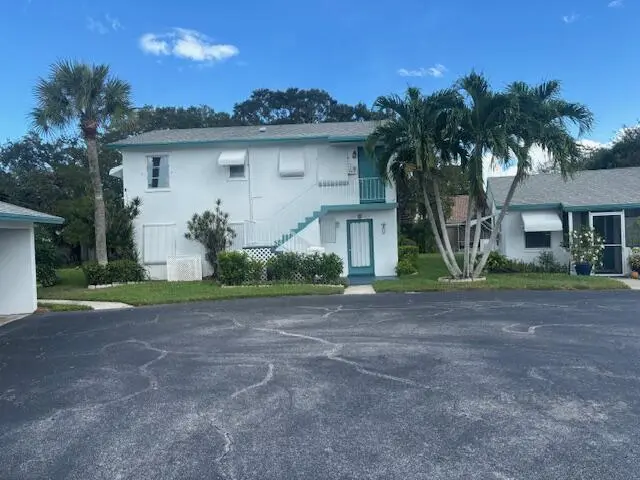
10162 N Meridian Way Way N #6 · Palm Beach Gardens, FL
Flood risk 1/10 · Minimal
- FEMA flood zone
- X (unshaded)
- Chance of flooding over 30 yrs
- 0.0%
- Est. flood insurance / yr
- $507 – $1,088
Fire risk 1/10 · Minimal
- Est. fire insurance / yr
- $947 – $1,759
Heat risk 10/10 · Severe
- Hot days now (above 106°F)
- 7 days/yr
- Hot days in 30 yrs
- 24 days/yr
Wind risk 10/10 · Severe
- Chance of severe wind over 30 yrs
- 99.0%
Air-quality risk 2/10 · Minimal
- Unhealthy air days now
- 0 days/yr
- Unhealthy air days in 30 yrs
- 1 days/yr
Risk factors via First Street. Map © Google.
Why this score? — see what drove the B grade
The composite is a weighted blend of 9 inputs, each scored 0–100. Each bar is that input's sub-score; the figure is the points it added to the 100-point composite (weight × sub-score).
- Cash flow +30.0/30.0
- 1% rule +10.0/10.0
- DSCR +10.0/10.0
- ARV discount +7.5/15.0
- Schools +4.3/10.0
- Livability +3.5/5.0
- Rent growth +3.1/5.0
- Condition / age +2.5/5.0
- Appreciation +0.0/10.0
$119,000
🖨 Deal sheet (PDF) 📄 Offer letter ✓ Due diligence
Listing remarks
Beautifully updated second-floor 2-bedroom, 1-bath condominium featuring new carpet and fresh interior paint throughout. The unit includes a full-size washer and dryer, newer kitchen appliances, and a functional floor plan designed for comfortable living. Conveniently located within walking distance of a bus stop, Publix shopping center, and the Gardens Mall, offering easy access to shopping, dining, and everyday necessities. Residents enjoy a covered carport, clubhouse, community pool, and peaceful canal views from the rear of the property. An excellent opportunity at an attractive price point. No waiting period to rent, making this property suitable for both owner-occupants and investors.
Key facts
- New carpet
- Fresh interior paint
- $550 HOA
Tags
Property features AI
Finance
- Other: Senior community; No pets allowed
- HOA & community: Has association with clubhouse and community room; Monthly HOA fee of 550 covering common areas
Exterior
- Parking: Covered detached carport (1 covered carport space)
- Utilities: Public water; Public sewer; Three-phase electric; Cable available
- Home design: Condominium; Multi/split levels; 2 total stories; Faces west; Resale condition
- Construction: Concrete/CBS construction; Composition/shingle roof
- Exterior features: Not waterfront
Interior
- Kitchen: Electric range; Microwave; Refrigerator
- Bedrooms: 2 bedrooms on the main level
- Flooring: Carpet
- Bathrooms: 1 full bathroom on the main level
- Heating & cooling: Heat pump with individual central heating; Central air conditioning
- Interior features: Built-in features; Closet cabinetry; Unfurnished
- Laundry & utility: Inside laundry in a laundry closet
Neighborhood map
What this means for you Summary
Snapshot
- This is a 2-bed/1.0-bath condo listed at $119k.
Deal economics
- At list price, monthly cash flow is $1k ($17k/yr) — positive.
- The deal already cash-flows at list — no discount required.
- Meets the 1% rule at list price ($4k rent vs $119k).
Location & tenants
- Location reads 69/100 on livability (#464 in FL) — a middle-class / working-renter tenant base. Strengths: crime A+, employment A+, housing A+; Watch: amenities F, commute F, cost of living F.
- Palm Beach (suburban): math 46% / reading 53% proficiency, ranked #34 of 73 in FL (top 47%) — families likely to look elsewhere, expect single-tenant / working-renter base with shorter leases.
- Zoned schools: Allamanda Elementary School (math 52% / reading 58%, grade C, #872 of 2,144 statewide, top 42%, 630 students, 48% FRL); Howell L. Watkins Middle School (math 18% / reading 33%, grade F, #512 of 571 statewide, top 90%, 794 students, 76% FRL); Palm Beach Gardens High School (math 19% / reading 40%, grade F, #447 of 667 statewide, top 68%, 2,570 students, 61% FRL).
- Zoned-school proficiency averages 37% at this address vs 50% district-wide (-13 pts) — the specific schools serving this property underperform the Palm Beach average; the district grade overstates school quality for this exact location.
- Market conditions: Rents rising (+2.5%/yr); 309 active listings in the ZIP; 10 comparable units currently listed for rent nearby; rentals leasing fast (median 7d on market — plan ~1-2 weeks tenant-placement turnaround); solid renter incomes; 3,974 units permitted in Palm Beach County in 2024 (1,012 in 5+ unit buildings).
- At $3,570/mo this rent would consume 45% of the median local household income ($95k/yr) (locally 1429% of renters already pay >50% of income on rent) — very limited rent-growth headroom before tenants either downsize or default.
Forward outlook
- Local home prices are declining (-3.0%/yr); year-one equity from $823 of loan paydown is wiped out by about $4k of value loss. Plan a longer hold.
- Palm Beach County population projected at +30% by 2050 — long-run rental-demand tailwind backs the buy-and-hold thesis.
- At projected returns (-3.0% appreciation + 2.5% rent growth), your $33k cash investment doubles in ~3 years — after that, you're playing with house money.
Negotiation context
- Only 14 days on market — expect competitive offers; lowballing is unlikely to land.
- 8 sale attempts since 28y ago with the ask held roughly flat each time — persistent listings suggest the price (not the market) is what's stuck; bring a comps-based counter.
- Current owner paid $24k; list at $119k implies a 396% gain — meaningful room to come down on a strong offer.
Risks & watch-outs
- Climate carrying-cost: severe wind risk, 99% chance of damaging wind over 30y; extreme-heat days projected 7→24/yr by 2055 (HVAC capex compounding) — expect insurance premiums to compound above CPI over the hold.
Questions for the listing agent
- Built in 1965 — when were the roof, HVAC, electrical panel, plumbing, and water heater last replaced?
- What does the HOA fee cover, when was the last increase, and are there any pending special assessments or reserve-fund shortfalls?
- Any open or pending special assessments — roof, HVAC, plumbing, elevator, façade? What's the per-unit balance and payoff schedule, and is the seller paying it off at close or rolling it to the buyer?
- Is there a deadline driving the sale (1031 exchange, divorce, estate, relocation)? That informs how much negotiation room exists.
- Schools are B-rated — typically a magnet for longer-tenancy family renters. What's the average tenant stay here, and is there a school-zone premium baked into asking?
- What's the average days-on-market for RENTAL listings here right now (not sales)? A rising rental-DOM trend means longer vacancies and softer asking-rent achievability than the comps imply.
- What's the recent tenant-quality profile in this submarket — average credit score on applications, eviction rate, late-payment / NSF rate, and stable-employment percentage? A property-management company in the area should have these aggregated.
- How much new apartment / multifamily construction is in the pipeline within 1–3 miles? Heavy new supply (>2% of stock underway) typically softens rents 12–24 months out; light construction supports rent growth.
Investment metrics
- 1% rule
- 3.00% ✓
- Cap rate
- 20.27%
- Cash-on-cash
- 49.91%
- DSCR
- 3.22
- GRM
- 2.8
CMA / ARV
No comps found within radius.
Projected returns pro-forma
-3.0% appreciation · 2.49% rent growth · sell at horizon
- IRR
- 47.0%
- Equity multiple
- 3.03×
- Total profit
- $67,582
- Equity at exit
- $17,743
- IRR
- 52.5%
- Equity multiple
- 6.01×
- Total profit
- $166,839
- Equity at exit
- $10,289
Cash invested: $33,320 (down + closing). Projections, not guarantees.
Landlord ↔ Tenant lean methodology
- Overall (STATE)
- 87 Strongly Landlord-Friendly
- State Florida
- 87 Strongly Landlord-Friendly · R+3
- County
- — inherits STATE
- City
- — inherits STATE
ZIP-level market 33410
- Rents YoY
- 2.5%
- Active inventory
- 309
- Price-to-rent
- 2.8×
Monthly cashflow live
- Estimated rent
- $3,570 high interval (Pro) →
- Mortgage (P&I)
- −$624
- Tax from tax record
- −$211 /mo · $2,530/yr
- Insurance
- −$50
- HOA
- −$550
- Vacancy / Maint / Mgmt
- −$750
- Net cashflow
- $1,386
Break-even live
Sensitivity live
| Price | -10% $1,453 | -5% $1,419 | +0% $1,386 | +5% $1,352 | +10% $1,318 |
|---|---|---|---|---|---|
| Rent | -10% $1,104 | -5% $1,245 | +0% $1,386 | +5% $1,527 | +10% $1,668 |
| Rate | -1.0pp $1,446 | -0.5pp $1,416 | base $1,386 | +0.5pp $1,355 | +1.0pp $1,324 |
UW: 25.0% down · 7.5% · 30yr · 1.5% tax · 5.0% vac · 8.0% maint · 8.0% mgmt
Financing live
Cash to close
- Down payment
- $29,750
- Closing costs
- $3,570
- Reserves months
- —
- Total cash needed
- —
Loan-product check · same deal, 3 products live
Conventional
25% down · 7.5% · 30yr
- Down + closing
- —
- Monthly P&I
- —
- Monthly cashflow
- —
- DSCR
- —
- Eligible?
- —
Personal DTI + credit; lowest rate.
DSCR
20% down · 8.5% · 30yr
- Down + closing
- —
- Monthly P&I
- —
- Monthly cashflow
- —
- DSCR
- —
- Eligible?
- —
No personal income docs; deal must DSCR.
Hard money
10% down · 12.0% · 12mo
- Down + closing
- —
- Monthly P&I
- —
- Monthly cashflow
- —
- DSCR
- —
- Eligible?
- —
Short-term bridge; refi at stabilization.
Rent comps 10 comps
| Address | Beds | Baths | Sqft | Rent | $/sqft | DOM | Units | Dist |
|---|---|---|---|---|---|---|---|---|
| 2750 Rio Vista Blvd Palm Beach Gardens, FL | 1.0–2.0 | 1.0–2.0 | 925 | $2,999 | $3.24 | 5d | 27 | 0.52mi |
| 913 Lighthouse Dr North Palm Beach, FL | 3.0 | 2.5 | 1092 | $5,900 | $5.40 | 26d | 1 | 0.61mi |
| 700 Sanctuary Cove Dr West Palm Beach, FL | 1.0–3.0 | 1.0–2.0 | 1120 | $2,596 | $2.32 | 0d | 55 | 0.92mi |
| 3660 RCA Blvd Palm Beach Gardens, FL | 1.0–2.0 | 1.0–2.0 | 1524 | $6,849 | $4.49 | 3d | 30 | 0.99mi |
| 2545 Conroy Dr West Palm Beach, FL | 3.0 | 2.0 | 1066 | $3,295 | $3.09 | 26d | 1 | 1.04mi |
| 9446 Birmingham Dr Palm Beach Gardens, FL | 3.0 | 2.0 | 1092 | $3,250 | $2.98 | 7d | 1 | 1.23mi |
| 2396 Easy St Unit A Palm Beach Gardens, FL | 2.0 | 1.0 | 948 | $3,500 | $3.69 | 26d | 1 | 1.34mi |
| 624 Southwind Cir #2 North Palm Beach, FL | 2.0 | 2.0 | 718 | $3,750 | $5.22 | 26d | 1 | 1.35mi |
| 3955 Design Center Dr Palm Beach Gardens, FL | 3.0 | 1.0–2.0 | 996 | $3,517 | $3.53 | 0d | 21 | 1.41mi |
| 4120 Union Square Blvd Palm Beach Gardens, FL | 1.0–3.0 | 1.0–2.0 | 1035 | $2,632 | $2.54 | 1d | 100 | 1.45mi |
HOA detail condo
- Monthly dues
- $550 · $6,600/yr
- Likely covers
- pool
- Assessments
- None detected in remarks — confirm with the listing agent.
Listing history 9 events
-
2026-06-21days on market $119,000 Active 14 DOM
-
2026-06-18days on market $119,000 Active 11 DOM
-
2026-06-17days on market $119,000 Active 10 DOM
-
2026-06-16days on market $119,000 Active 9 DOM
-
2026-06-15days on market $119,000 Active 8 DOM
-
2026-06-13days on market $119,000 Active 6 DOM
-
2026-06-09days on market $119,000 Active 2 DOM
-
2026-06-08remarks 699-char remark
-
2026-06-08$119,000 Active 1 DOM
ⓘ Source: listings_history table (triggers on properties + properties_extension) + one-shot
backfill from property_details.listing_events for pre-trigger history.
Tax reassessment forecast FL · Resets to sale price
- Current annual tax
- $2,530 · $211/mo
- Projected year-2 tax
- $2,530 · $211/mo
- Expected delta
- $0/yr ($0/mo · 0.0%)
ⓘ Screening estimate from a state-policy table — verify with the county assessor before closing.
Climate risk First Street
- Flood 1/10 Low FEMA zone X (unshaded) · 0% chance over 30 yrs
- Wildfire 1/10 Low
- Heat 10/10 Extreme 7 d/yr ≥106°F today · 24 d/yr by 30 yrs out
- Wind 10/10 Extreme 99% chance of damaging wind over 30 yrs
- Air quality 2/10 Low 0 unhealthy d/yr today · 1 by 30 yrs out
Nearby sold comps map
Loading sold comps map…
Walkable amenities ~0.75 mi
Loading nearby amenities…
Taxation est. · year 1
- Rental income
- $42,838
- − Mortgage interest
- −$6,666
- − Property taxes
- −$2,530
- − Insurance
- −$595
- − Repairs & maintenance
- −$3,427
- − Management
- −$3,427
- − HOA
- −$6,600
- − Depreciation
- −$3,462
- Taxable income
- $16,132
- Est. tax owed @ 24.0%
- −$3,872
- After-tax cash flow
- $12,757/yr
For passive investors: Depreciation is non-cash, so a rental often shows a tax loss while cash-flowing — sheltering income. Rental losses are passive: they offset passive income freely, and up to $25,000/yr can offset ordinary (W-2) income if you actively participate and your MAGI is under $100k (phasing out to $0 by $150k); unused losses carry forward. On sale, claimed depreciation is recaptured at up to 25%, and gains may owe capital-gains tax (a 1031 exchange can defer both). Figures are a year-1 estimate at your 24.0% rate — not tax advice; consult a CPA.
Schools (NCES district)
- District
- Palm Beach
- NCES district ID
- 1201500
- Math proficiency
- 46% ▼ -16.00%
- Reading proficiency
- 53% ▼ -4.00%
- Median HH income
- $53,943
- Composite
- 42.72/100
- National rank
- #3160
- State rank
- #34 of 73 in FL
Livability — Palm Beach Gardens
- Score
- 69/100
- State rank
- #464
- US rank
- #8366
Category grades
Schools grade is shown separately in the Schools card above.
Census & demographics
- Census place
- Palm Beach Gardens, FL
- County
- Palm Beach County · 1,438,312 people
- City population
- 96,294
- Metro
- Miami-Fort Lauderdale-Pompano Beach, FL
- Population (ZIP)
- 36,759
- Household income
- $94,530
- Rent vs Own
- Severe rent burden
- 1429.0
Population outlook (Palm Beach County) Hauer SSP2
- Today (2025)
- 1,637,487 people
- By 2030
- 1,743,255 · +6.5%
- By 2040
- 1,948,712 · +19.0%
- By 2050
- 2,132,979 · +30.3%
- By 2075
- 2,530,027 · +54.5%
- By 2100
- 2,706,979 · +65.3%
Race, ethnicity, and origin ACS 2023
- Neighborhood character
- Predominantly White (70%)
- Race & ethnicity
- White 70% Hispanic / Latino 15% Two or more races 13% Black 5% Asian 4%
- Hispanic origin (detail)
- Mexican 2% Puerto Rican 2% Cuban 3%
- Common ancestry
- Romanian 4% Lithuanian 3% Slovak 2%
- Foreign-born
- 17% · Canada, Jamaica, Vietnam
- Languages at home
- 78% English-only · Spanish 13% French/Haitian/Cajun 3% Other Indo-European 2%
Political lean MEDSL · Palm Beach
- 2024 margin
- Toss-up / Even · D 50.0% · R 49.2%
- 2008→2024 swing
- -22.1pp toward R · 2008: 22.9pp · 2024: 0.8pp
- All cycles
- 2024: D+0.8 2020: D+12.8 2016: D+15.3 2012: D+17.0 2008: D+22.9
Not yet ingested
- Civics
- —
Market trends
- HPI YoY
- ▼ -346.12%
- Current HPI
- 375.5381
- Rent YoY
- ▲ 2.49%
- Metro
- Miami-Fort Lauderdale-Pompano Beach, FL
- State GDP YoY
- ▲ 3.28%
- F500 in state
- 36
Industry mix (Fortune 500 HQ in FL)
| Industry | F500 HQs | Revenue |
|---|---|---|
| Industrial Technology | 2 | $29B |
|
||
| Insurance | 2 | $17B |
|
||
| Retail | 1 | $60B |
|
||
| Technology Distribution | 1 | $58B |
|
||
| Homebuilding | 1 | $35B |
|
||
| Technology Manufacturing | 1 | $35B |
|
||
Price history
+143.4% since first listed23 events — show timeline
- 2026-06-07 Listed $119,000 Beaches MLS
- 2026-05-12 Listing Removed — Beaches MLS
- 2026-03-23 Price Changed $129,900 Beaches MLS
- 2025-12-29 Price Changed $139,900 Beaches MLS
- 2025-12-06 Price Changed $159,950 Beaches MLS
- 2025-11-13 Listed $171,000 Beaches MLS
- 2013-12-01 Listing Removed — Beaches MLS
- 2011-01-04 Sold (MLS) $24,000 Beaches MLS
- 2010-10-15 Listing Removed — Beaches MLS
- 2010-06-22 Listed $39,900 Beaches MLS
- 2008-07-22 Listing Removed — Beaches MLS
- 2008-01-23 Listed $89,950 Beaches MLS
- 2006-01-25 Listed $129,775 Beaches MLS
- 2006-01-24 Listing Removed — Beaches MLS
- 2005-10-06 Listed $141,775 Beaches MLS
- 2001-07-02 Sold (Public Records) $43,500 Public Records
- 2001-06-28 Sold (MLS) $43,500 Beaches MLS
- 2001-05-29 Listing Removed — Beaches MLS
- 2001-01-19 Listed $48,000 Beaches MLS
- 1999-04-08 Sold (Public Records) $40,500 Public Records
- 1999-04-01 Sold (MLS) $40,500 Beaches MLS
- 1999-02-01 Listing Removed — Beaches MLS
- 1998-10-28 Listed $48,900 Beaches MLS
Property tax history
+6.1%/yrLatest (2025): $2,530 · +1.7% YoY. Source: county tax records.
Cash-flow waterfall
monthlySold comps — $/sqft
last 12 mo · ≤1 miLoading sold comps…