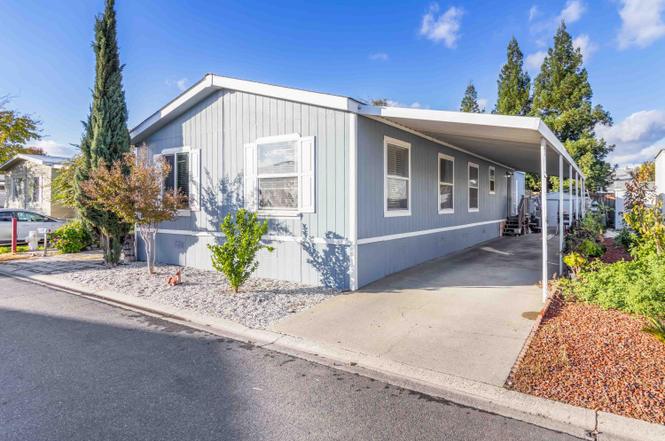
8229 Coed Ln · Florin, CA
Flood risk 1/10 · Minimal
- FEMA flood zone
- X (shaded)
- Chance of flooding over 30 yrs
- 0.0%
- Est. flood insurance / yr
- $507 – $1,088
Fire risk 2/10 · Minimal
- Est. fire insurance / yr
- $659 – $1,223
Heat risk 7/10 · Major
- Hot days now (above 102°F)
- 7 days/yr
- Hot days in 30 yrs
- 14 days/yr
Wind risk 1/10 · Minimal
- Chance of severe wind over 30 yrs
- —
Air-quality risk 10/10 · Severe
- Unhealthy air days now
- 28 days/yr
- Unhealthy air days in 30 yrs
- 33 days/yr
Risk factors via First Street. Map © Google.
Why this score? — see what drove the C grade
The composite is a weighted blend of 9 inputs, each scored 0–100. Each bar is that input's sub-score; the figure is the points it added to the 100-point composite (weight × sub-score).
- Cash flow +20.1/30.0
- 1% rule +9.5/10.0
- ARV discount +7.5/15.0
- DSCR +6.4/10.0
- Schools +4.1/10.0
- Livability +2.9/5.0
- Condition / age +2.5/5.0
- Rent growth +2.4/5.0
- Appreciation +1.3/10.0
$195,000
🖨 Deal sheet 📄 Offer letter ✓ Due diligence
Listing remarks
This beautifully maintained home has been lovingly cared for by the owner and treated like a true family home. Every detail reflects pride of ownership and thoughtful upgrades throughout. Step inside to an inviting layout featuring a remodeled kitchen, updated bathrooms, and a cozy fireplace perfect for relaxing evenings. The home offers 4 spacious bedrooms and 2 full bathrooms, making it ideal for families or anyone needing extra space. Outside, the property features a beautiful green garden, a good-sized backyard, and a three-car carport. The community is gated and offers great amenities including a pool, community events and basketball court, making it an amazing place to live. A home li
Key facts
- Gated community
- Three-car carport
- Remodeled kitchen
Tags
Property features AI
Finance
- Other: Property located at 8229 Coed Ln, Sacramento, CA 95828
- HOA & community: Mandatory association; Monthly association fee of $845; Association includes exterior and grounds maintenance, trash, and water; Community amenities: activities, pool, clubhouse, guest parking, picnic area
Exterior
- Parking: Covered parking; Guest parking available
- Utilities: Gas plumbed; Public sewer; Water from public/water district; 220 volts in laundry
- Home design: Manufactured in-park home; Double wide; Built in 2001
- Construction: Composition roof; Vinyl skirting; Built by Champion Home Builder Company; Model/Make: Infinite
- Exterior features: Backyard; Front yard; Regular-shaped lot; Covered parking; Guest parking available
Interior
- Kitchen: Stone and wood counters
- Bedrooms: 4 bedrooms
- Flooring: Tile flooring; Vinyl flooring
- Bathrooms: 2 full bathrooms; Jetted tub; Tile finishes; Shower stall(s)
- Heating & cooling: Central heating; Natural gas heating; Fireplace heating; Central cooling; Ceiling fans
- Interior features: One wood-burning fireplace located in the dining room; Great room living area; Skylight in the dining area; Dining and living room combined (open plan)
- Laundry & utility: Inside laundry room with 220V electric
Neighborhood map
What this means for you Summary
Snapshot
- This is a 4-bed/2.0-bath manufactured listed at $195k.
Deal economics
- At list price, monthly cash flow is $243 ($3k/yr) — positive.
- The deal already cash-flows at list — no discount required.
- Meets the 1% rule at list price ($3k rent vs $195k).
- Recommended offer: $172k (12.0% below list) — sets the bar for market timing.
- Cap rate 7.8% vs local median 3.6% in Florin — top-decile yield for the area; either an underpriced asset or a hidden risk that comps aren't pricing in. Stress-test before assuming the spread holds.
Location & tenants
- Location reads 58/100 on livability (#673 in CA) — a working-class tenant base; expect higher turnover. Strengths: housing A; Watch: employment D, schools D-, crime F.
- Elk Grove Unified (suburban): math 40% / reading 51% proficiency, ranked #165 of 517 in CA (top 32%) — families likely to look elsewhere, expect single-tenant / working-renter base with shorter leases.
- Market conditions: Rents soft (-0.2%/yr); 212 active listings in the ZIP; 9 comparable units currently listed for rent nearby; rentals leasing fast (median 8d on market — plan ~1-2 weeks tenant-placement turnaround); solid renter incomes; 6,825 units permitted in Sacramento County in 2024 (1,752 in 5+ unit buildings).
- This rent runs 41% of the median local income ($82k/yr) — at the standard rent-burdened threshold; future hikes will face affordability resistance.
Forward outlook
- Local home prices are declining (-3.0%/yr); year-one equity from $1k of loan paydown is wiped out by about $6k of value loss. Plan a longer hold.
- Sacramento County population projected at +17% by 2050 — long-run rental-demand tailwind backs the buy-and-hold thesis.
Negotiation context
- It's been on market 145 days — a 12% lower offer ($172k) is reasonable based on typical stale-listing flexibility.
Risks & watch-outs
- Watch-outs: HOA is 30% of rent.
- Climate carrying-cost: extreme-heat days projected 7→14/yr by 2055 (HVAC capex compounding) — expect insurance premiums to compound above CPI over the hold.
Questions for the listing agent
- It's been on market 145 days. Have you received any prior offers? Is the seller open to a 12% concession, seller financing, or rate buy-down credit?
- What does the HOA fee cover, when was the last increase, and are there any pending special assessments or reserve-fund shortfalls?
- Why hasn't it sold? Are there any deal-killer items the seller is aware of (foundation, flood, title, zoning, code violations)?
- Is there a deadline driving the sale (1031 exchange, divorce, estate, relocation)? That informs how much negotiation room exists.
- Schools are D-rated, which usually means shorter tenancies and higher turnover. Who's the typical renter profile here, and what's been the actual vacancy rate?
- Crime grade is F in this area — have there been break-ins, vandalism, or insurance claims at this property in the last 3 years? What carrier currently insures it and at what premium?
- What's the average days-on-market for RENTAL listings here right now (not sales)? A rising rental-DOM trend means longer vacancies and softer asking-rent achievability than the comps imply.
- What's the recent tenant-quality profile in this submarket — average credit score on applications, eviction rate, late-payment / NSF rate, and stable-employment percentage? A property-management company in the area should have these aggregated.
- How much new for-sale + rental construction is in the pipeline within 1–3 miles? Heavy new supply typically softens prices + rents 12–24 months out; constrained supply supports both.
Investment metrics
- 1% rule
- 1.45% ✓
- Cap rate
- 7.79%
- Cash-on-cash
- 5.34%
- DSCR
- 1.24
- GRM
- 5.8
CMA / ARV
- ARV (on-the-fly)
- $119,520
- Comps found
- 9
Show comp detail 9 sales within ~0.75 mi
| Address | Dist | Beds/Ba | Sqft | Sold | Price | $/sf | Match |
|---|---|---|---|---|---|---|---|
| 8230 Tiki Ln | 0.05mi | 4/2.0 | 1,404 (-2%) | 13mo | $105,000 | $75 | 82 |
| 8221 Tiki Ln | 0.06mi | 3/2.0 (-1) | 1,356 (-6%) | 2mo | $140,000 | $103 | 80 |
| 7547 Debutante Ln #81 | 0.10mi | 3/2.0 (-1) | 1,539 (+7%) | 10mo | $105,000 | $68 | 71 |
| 8250 Destiny Ln | 0.19mi | 3/2.0 (-1) | 1,536 (+7%) | 17mo | $85,000 | $55 | 61 |
| 7539 Debutante | 0.14mi | 3/3.0 (-1) | 1,485 (+3%) | 23mo | $160,000 | $108 | 61 |
| 134 Gardenia | 0.72mi | 3/2.0 (-1) | 1,440 (0%) | 1mo | $120,000 | $83 | 60 |
| 8229 Covina Ln #28 | 0.23mi | 4/2.0 | 1,350 (-6%) | 22mo | $185,000 | $137 | 60 |
| 103 Dahlia Ave | 0.65mi | 3/2.0 (-1) | 1,400 (-3%) | 1mo | $89,000 | $64 | 59 |
| 8593 Calais Cir | 0.74mi | 3/2.0 (-1) | 1,248 (-13%) | 20mo | $325,000 | $260 | 22 |
Match score weights: distance 35% · size 25% · config 20% · recency 20%. Top-matched comps best support the ARV.
Projected returns pro-forma
-3.0% appreciation · 0.0% rent growth · sell at horizon
- IRR
- -12.7%
- Equity multiple
- 0.56×
- Total profit
- $-23,967
- Equity at exit
- $29,075
- IRR
- -11.9%
- Equity multiple
- 0.43×
- Total profit
- $-31,154
- Equity at exit
- $16,860
Cash invested: $54,600 (down + closing). Projections, not guarantees.
Landlord ↔ Tenant lean methodology
- Overall (STATE)
- 18 Strongly Tenant-Friendly
- State California
- 18 Strongly Tenant-Friendly · D+13
- County
- — inherits STATE
- City
- — inherits STATE
ZIP-level market 95828
- Home prices YoY
- -0.8%
- Rents YoY
- -0.2%
- Active inventory
- 212
- Price-to-rent
- 5.8×
Monthly cashflow live
- Estimated rent
- $2,823 high interval (Pro) →
- Mortgage (P&I)
- −$1,023
- Tax from tax record
- −$38 /mo · $461/yr
- Insurance
- −$81
- HOA
- −$845
- Vacancy / Maint / Mgmt
- −$593
- Net cashflow
- $243
Break-even live
UW: 25.0% down · 7.5% · 30yr · 1.5% tax · 5.0% vac · 8.0% maint · 8.0% mgmt
Financing live
Cash to close
- Down payment
- $48,750
- Closing costs
- $5,850
- Reserves months
- —
- Total cash needed
- —
Loan-product check · same deal, 3 products live
Conventional
25% down · 7.5% · 30yr
- Down + closing
- —
- Monthly P&I
- —
- Monthly cashflow
- —
- DSCR
- —
- Eligible?
- —
Personal DTI + credit; lowest rate.
DSCR
20% down · 8.5% · 30yr
- Down + closing
- —
- Monthly P&I
- —
- Monthly cashflow
- —
- DSCR
- —
- Eligible?
- —
No personal income docs; deal must DSCR.
Hard money
10% down · 12.0% · 12mo
- Down + closing
- —
- Monthly P&I
- —
- Monthly cashflow
- —
- DSCR
- —
- Eligible?
- —
Short-term bridge; refi at stabilization.
Rent comps 9 comps
| Address | Beds | Baths | Sqft | Rent | $/sqft | DOM | Units | Dist |
|---|---|---|---|---|---|---|---|---|
| 7733 Robinette Rd Sacramento, CA | 3.0 | 2.0 | 1120 | $2,150 | $1.92 | 43d | 1 | 0.88mi |
| 7421 Conrad Dr Sacramento, CA | 4.0 | 2.0 | 1442 | $2,595 | $1.80 | 7d | 1 | 1.07mi |
| 8159 Laurel Willow Ln Sacramento, CA | 3.0 | 2.5 | 1214 | $2,396 | $1.97 | 4d | 1 | 1.13mi |
| 8184 Creeping Willow Ln Sacramento, CA | 4.0 | 2.0 | 1807 | $2,695 | $1.49 | 4d | 1 | 1.15mi |
| 8620 Tiogawoods Dr Sacramento, CA | 3.0 | 2.0 | 1137 | $2,750 | $2.42 | 7d | 1 | 1.18mi |
| 7416 Mimosa Way Sacramento, CA | 4.0 | 2.5 | 1582 | $2,475 | $1.56 | 43d | 1 | 1.18mi |
| 8112 Creeping Willow Ln Sacramento, CA | 3.0 | 2.5 | 1214 | $2,495 | $2.06 | 11d | 1 | 1.19mi |
| 8148 Lenhart Rd Sacramento, CA | 3.0 | 2.0 | 1130 | $2,395 | $2.12 | 14d | 1 | 1.30mi |
| 7756 Southbreeze Dr Sacramento, CA | 3.0 | 2.0 | 1302 | $2,395 | $1.84 | 1d | 1 | 1.36mi |
HOA detail
- Monthly dues
- $845 · $10,140/yr
- Likely covers
- poolsecurity
Listing history 15 events
-
2026-06-18days on market $195,000 Active 145 DOM
-
2026-06-17days on market $195,000 Active 144 DOM
-
2026-06-16days on market $195,000 Active 143 DOM
-
2026-06-15days on market $195,000 Active 142 DOM
-
2026-06-13days on market $195,000 Active 140 DOM
-
2026-06-13days on market $195,000 Active 139 DOM
-
2026-06-09days on market $195,000 Active 136 DOM
-
2026-06-08days on market $195,000 Active 135 DOM
-
2026-06-07days on market $195,000 Active 134 DOM
-
2026-06-05days on market $195,000 Active 131 DOM
-
2026-06-03days on market $195,000 Active 130 DOM
-
2026-06-02days on market $195,000 Active 129 DOM
-
2026-06-01days on market $195,000 Active 128 DOM
-
2026-05-31remarks 699-char remark
-
2026-05-31$195,000 Active 127 DOM
ⓘ Source: listings_history table (triggers on properties + properties_extension) + one-shot
backfill from property_details.listing_events for pre-trigger history.
Tax reassessment forecast CA · Resets to sale price
- Current annual tax
- $461 · $38/mo
- Projected year-2 tax
- $1,482 · $124/mo
- Expected delta
- +$1,021/yr (+$85/mo · 221.6%)
ⓘ Screening estimate from a state-policy table — verify with the county assessor before closing.
Climate risk First Street
- Flood 1/10 Low FEMA zone X (shaded) · 0% chance over 30 yrs
- Wildfire 2/10 Low
- Heat 7/10 Severe 7 d/yr ≥102°F today · 14 d/yr by 30 yrs out
- Wind 1/10 Low
- Air quality 10/10 Extreme 28 unhealthy d/yr today · 33 by 30 yrs out
Nearby sold comps map
Loading sold comps map…
Walkable amenities ~0.75 mi
Loading nearby amenities…
Taxation est. · year 1
- Rental income
- $33,875
- − Mortgage interest
- −$10,923
- − Property taxes
- −$461
- − Insurance
- −$975
- − Repairs & maintenance
- −$2,710
- − Management
- −$2,710
- − HOA
- −$10,140
- − Depreciation
- −$5,673
- Taxable income
- $284
- Est. tax owed @ 24.0%
- −$68
- After-tax cash flow
- $2,846/yr
For passive investors: Depreciation is non-cash, so a rental often shows a tax loss while cash-flowing — sheltering income. Rental losses are passive: they offset passive income freely, and up to $25,000/yr can offset ordinary (W-2) income if you actively participate and your MAGI is under $100k (phasing out to $0 by $150k); unused losses carry forward. On sale, claimed depreciation is recaptured at up to 25%, and gains may owe capital-gains tax (a 1031 exchange can defer both). Figures are a year-1 estimate at your 24.0% rate — not tax advice; consult a CPA.
Schools (NCES district)
- District
- Elk Grove Unified
- NCES district ID
- 0612330
- Math proficiency
- 40% ▼ -5.00%
- Reading proficiency
- 51% ▼ -5.00%
- Median HH income
- $67,860
- Composite
- 40.72/100
- National rank
- #3658
- State rank
- #165 of 517 in CA
Livability — Florin
- Score
- 58/100
- State rank
- #673
- US rank
- #20705
Category grades
Schools grade is shown separately in the Schools card above.
Census & demographics
- Census place
- Florin, CA
- County
- Sacramento County · 1,539,646 people
- City population
- 60,532
- Metro
- Sacramento-Roseville-Folsom, CA
- Population (ZIP)
- 61,686
- Household income
- $81,778
- Rent vs Own
- Severe rent burden
- 1765.0
Population outlook (Sacramento County) Hauer SSP2
- Today (2025)
- 1,660,763 people
- By 2030
- 1,732,990 · +4.3%
- By 2040
- 1,855,755 · +11.7%
- By 2050
- 1,941,335 · +16.9%
- By 2075
- 2,046,162 · +23.2%
- By 2100
- 1,961,444 · +18.1%
Race, ethnicity, and origin ACS 2023
- Neighborhood character
- Highly diverse neighborhood (Simpson 0.75)
- Race & ethnicity
- Asian 37% Hispanic / Latino 26% White 16% Two or more races 12% Black 10% Pacific Islander 4%
- Hispanic origin (detail)
- Mexican 22%
- Common ancestry
- Italian 1% Russian 1% Portuguese 1%
- Foreign-born
- 35% · Vietnam, Canada, China
- Languages at home
- 47% English-only · Spanish 17% Other Asian/Pacific 13% Vietnamese 8%
Political lean MEDSL · Sacramento
- 2024 margin
- D (+19.7) · D 58.1% · R 38.4% · Other 3.5%
- 2008→2024 swing
- +0.7pp no change · 2008: 19.0pp · 2024: 19.7pp
- All cycles
- 2024: D+19.7 2020: D+25.3 2016: D+23.7 2012: D+16.3 2008: D+19.0
Not yet ingested
- Civics
- —
Market trends
- HPI YoY
- ▼ -7.49%
- Current HPI
- 962.47
- Rent YoY
- ▼ -0.24%
- Metro
- Sacramento-Roseville-Folsom, CA
- State GDP YoY
- ▲ 3.21%
- F500 in state
- 116
Industry mix (Fortune 500 HQ in CA)
| Industry | F500 HQs | Revenue |
|---|---|---|
| Technology | 27 | $1,492B |
|
||
| Financial Services | 3 | $174B |
|
||
| Retail | 3 | $44B |
|
||
| Insurance | 3 | $26B |
|
||
| Media / Entertainment | 2 | $115B |
|
||
| Pharmaceuticals / Biotech | 2 | $62B |
|
||
Property tax history
-2.2%/yrLatest (2025): $461 · -1.9% YoY. Source: county tax records.
Cash-flow waterfall
monthlySold comps — $/sqft
last 12 mo · ≤1 miLoading sold comps…