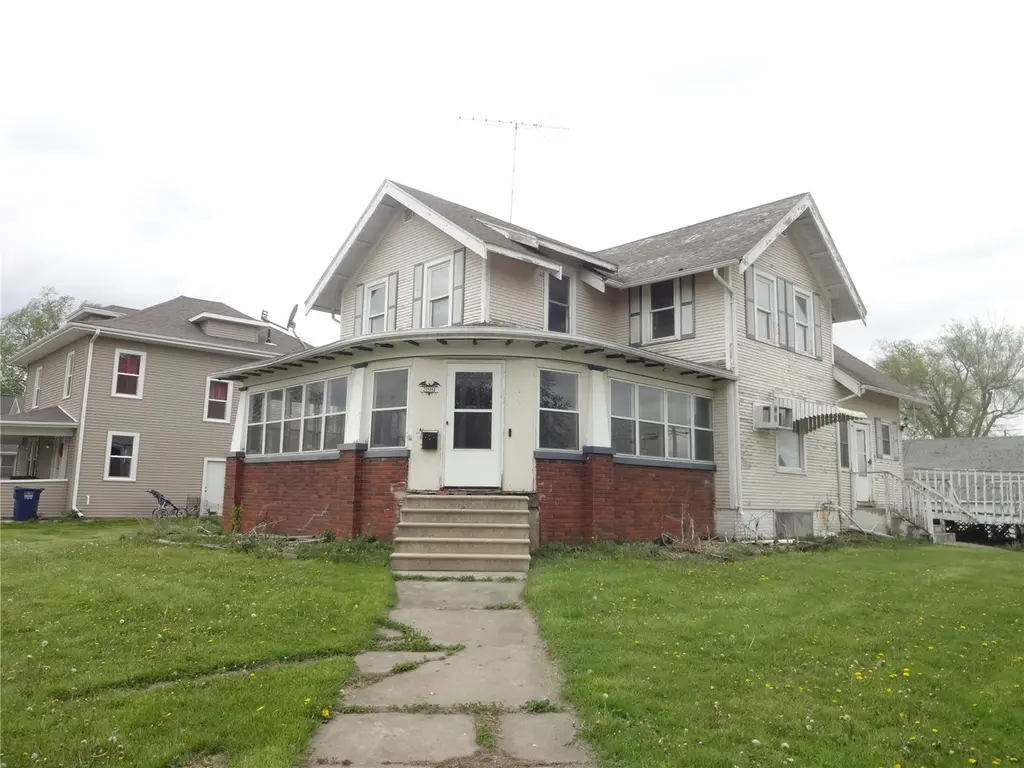
399 E Washington St · Marengo, IA
Flood risk 1/10 · Minimal
- FEMA flood zone
- X
- Chance of flooding over 30 yrs
- 0.0%
- Est. flood insurance / yr
- $473 – $860
Fire risk 4/10 · Minor
- Est. fire insurance / yr
- $902 – $1,676
Heat risk 3/10 · Minor
- Hot days now (above 103°F)
- 7 days/yr
- Hot days in 30 yrs
- 15 days/yr
Wind risk 2/10 · Minimal
- Chance of severe wind over 30 yrs
- —
Air-quality risk 2/10 · Minimal
- Unhealthy air days now
- 1 days/yr
- Unhealthy air days in 30 yrs
- 1 days/yr
Risk factors via First Street. Map © Google.
Why this score? — see what drove the C+ grade
The composite is a weighted blend of 9 inputs, each scored 0–100. Each bar is that input's sub-score; the figure is the points it added to the 100-point composite (weight × sub-score).
- Cash flow +20.5/30.0
- 1% rule +8.3/10.0
- ARV discount +7.5/15.0
- DSCR +6.5/10.0
- Schools +6.2/10.0
- Livability +3.5/5.0
- Appreciation +2.9/10.0
- Rent growth +2.5/5.0
- Condition / age +2.5/5.0
$85,000
🖨 Deal sheet 📄 Offer letter ✓ Due diligence
Listing remarks
This large 2 story home in Marengo is looking for someone to give it some love and attention. Original wood floors in the living room and dining room. Large enclosed front porch. 4 bedrooms and a half bathroom upstairs and large master bedroom on the main level with another full bathroom on the main level. Full unfinished basement for lots of storage. The backyard is fenced. Detached 2 car garage.
Key facts
- 0.24 acre lot
- 2 garage spots
- Built 1928
Property features AI
Exterior
- Parking: Detached garage with 2 garage spaces; Off-street and on-street parking; Garage door opener
- Utilities: Public water; Public sewer
- Home design: Single-family residence; Two-story
- Construction: Frame construction with wood siding; Block foundation
- Exterior features: Publicly maintained road; Pets allowed; Lot approximately 0.24 acres (75 x 142)
Interior
- Bathrooms: 1 full bathroom
- Heating & cooling: Hot water heating
- Interior features: Eat-in kitchen; Electric fireplace; Full concrete basement
Neighborhood map
What this means for you Summary
Snapshot
- This is a 5-bed/1.5-bath single-family listed at $85k.
Deal economics
- At list price, monthly cash flow is $111 ($1k/yr) — positive.
- The deal already cash-flows at list — no discount required.
- Meets the 1% rule at list price ($1k rent vs $85k).
- Recommended offer: $82k (3.0% below list) — sets the bar for market timing.
Location & tenants
- Location reads 69/100 on livability (#390 in IA) — a middle-class / working-renter tenant base. Strengths: cost of living A+, housing A+, health & safety A+; Watch: amenities F, commute F.
- Iowa Valley Community School District (rural): math 70% / reading 77% proficiency, ranked #94 of 289 in IA (top 32%) — strong family-tenant draw, lease renewals of 3-5y typical.
- Zoned schools: Iowa Valley Elementary School (math 72% / reading 72%, grade A-, #181 of 616 statewide, top 34%, 318 students, 41% FRL); Iowa Valley Jr-Sr High School (math 69% / reading 79%, grade B+, #103 of 336 statewide, top 32%, 229 students, 36% FRL).
- Market conditions: 38 active listings in the ZIP; 12 units permitted in Iowa County in 2024 (0 in 5+ unit buildings).
Forward outlook
- Local home prices are declining (-3.0%/yr); year-one equity from $588 of loan paydown is wiped out by about $3k of value loss. Plan a longer hold.
- Iowa County population projected to shrink 6% by 2050 — rents likely to lag national; underwrite the cash flow, not the appreciation.
Negotiation context
- It's been on market 56 days — a 3% lower offer ($82k) is reasonable based on typical stale-listing flexibility.
- 2 sale attempts since 4y ago; this cycle's ask has dropped $5k (6%) from the opening price — seller is motivated, your offer sets the floor, not the list.
Risks & watch-outs
- Watch-outs: property tax is 4.2% of price; built in 1928 — expect roof / HVAC / electrical / plumbing capex.
Questions for the listing agent
- It's been on market 56 days. Have you received any prior offers? Is the seller open to a 3% concession, seller financing, or rate buy-down credit?
- Built in 1928 — when were the roof, HVAC, electrical panel, plumbing, and water heater last replaced?
- Property tax is high relative to price — has the assessment been appealed recently, and will the sale trigger a re-assessment?
- Is there a deadline driving the sale (1031 exchange, divorce, estate, relocation)? That informs how much negotiation room exists.
- Schools are A-rated — typically a magnet for longer-tenancy family renters. What's the average tenant stay here, and is there a school-zone premium baked into asking?
- What's the average days-on-market for RENTAL listings here right now (not sales)? A rising rental-DOM trend means longer vacancies and softer asking-rent achievability than the comps imply.
- What's the recent tenant-quality profile in this submarket — average credit score on applications, eviction rate, late-payment / NSF rate, and stable-employment percentage? A property-management company in the area should have these aggregated.
- How much new for-sale + rental construction is in the pipeline within 1–3 miles? Heavy new supply typically softens prices + rents 12–24 months out; constrained supply supports both.
Investment metrics
- 1% rule
- 1.33% ✓
- Cap rate
- 7.87%
- Cash-on-cash
- 5.62%
- DSCR
- 1.25
- GRM
- 6.3
CMA / ARV
- ARV (median comp)
- $183,304
- List price
- $85,000
- Delta
- -50.90%
- Verdict
- UNDERPRICED
- Comps
- 20 within 1.0 mi
Show comp detail 7 sales within ~0.75 mi
| Address | Dist | Beds/Ba | Sqft | Sold | Price | $/sf | Match |
|---|---|---|---|---|---|---|---|
| 300 E Hilton St | 0.11mi | 4/1.5 (-1) | 2,093 (+1%) | 4mo | $159,900 | $76 | 84 |
| 893 Short Ave | 0.17mi | 4/1.5 (-1) | 2,044 (-1%) | 2mo | $231,000 | $113 | 84 |
| 697 E Adams St | 0.40mi | 5/3.0 | 2,100 (+2%) | 11mo | $154,500 | $74 | 64 |
| 625 E South St | 0.28mi | 6/2.0 (+1) | 2,016 (-2%) | 17mo | $200,000 | $99 | 62 |
| 496 E Hilton St | 0.13mi | 4/2.0 (-1) | 2,262 (+10%) | 19mo | $265,000 | $117 | 55 |
| 572 Marengo Ave | 0.38mi | 6/2.0 (+1) | 2,256 (+9%) | 10mo | $215,500 | $96 | 52 |
| 897 Howard Ave | 0.52mi | 4/2.0 (-1) | 1,930 (-6%) | 24mo | $199,900 | $104 | 38 |
Match score weights: distance 35% · size 25% · config 20% · recency 20%. Top-matched comps best support the ARV.
Projected returns pro-forma
-3.0% appreciation · 3.0% rent growth · sell at horizon
- IRR
- -7.4%
- Equity multiple
- 0.73×
- Total profit
- $-6,545
- Equity at exit
- $12,674
- IRR
- 2.3%
- Equity multiple
- 1.17×
- Total profit
- $3,983
- Equity at exit
- $7,349
Cash invested: $23,800 (down + closing). Projections, not guarantees.
Landlord ↔ Tenant lean methodology
- Overall (STATE)
- 83 Strongly Landlord-Friendly
- State Iowa
- 83 Strongly Landlord-Friendly · R+6
- County
- — inherits STATE
- City
- — inherits STATE
ZIP-level market 52301
- Home prices YoY
- -1.7%
- Active inventory
- 38
- Price-to-rent
- 6.3×
Monthly cashflow live
- Estimated rent
- $1,127 medium interval (Pro) →
- Mortgage (P&I)
- −$446
- Tax from tax record
- −$298 /mo · $3,574/yr
- Insurance
- −$35
- HOA
- −$0
- Vacancy / Maint / Mgmt
- −$237
- Net cashflow
- $111
Break-even live
UW: 25.0% down · 7.5% · 30yr · 1.5% tax · 5.0% vac · 8.0% maint · 8.0% mgmt
Financing live
Cash to close
- Down payment
- $21,250
- Closing costs
- $2,550
- Reserves months
- —
- Total cash needed
- —
Loan-product check · same deal, 3 products live
Conventional
25% down · 7.5% · 30yr
- Down + closing
- —
- Monthly P&I
- —
- Monthly cashflow
- —
- DSCR
- —
- Eligible?
- —
Personal DTI + credit; lowest rate.
DSCR
20% down · 8.5% · 30yr
- Down + closing
- —
- Monthly P&I
- —
- Monthly cashflow
- —
- DSCR
- —
- Eligible?
- —
No personal income docs; deal must DSCR.
Hard money
10% down · 12.0% · 12mo
- Down + closing
- —
- Monthly P&I
- —
- Monthly cashflow
- —
- DSCR
- —
- Eligible?
- —
Short-term bridge; refi at stabilization.
Listing history 21 events
-
2026-06-18days on market $85,000 Active 56 DOM
-
2026-06-17days on market $85,000 Active 55 DOM
-
2026-06-17price $85,000 Active 54 DOM
-
2026-06-16days on market $90,000 Active 54 DOM
-
2026-06-15days on market $90,000 Active 53 DOM
-
2026-06-13days on market $90,000 Active 51 DOM
-
2026-06-12days on market $90,000 Active 50 DOM
-
2026-06-09days on market $90,000 Active 47 DOM
-
2026-06-08days on market $90,000 Active 46 DOM
-
2026-06-07days on market $90,000 Active 45 DOM
-
2026-06-05days on market $90,000 Active 43 DOM
-
2026-06-04days on market $90,000 Active 41 DOM
-
2026-06-02days on market $90,000 Active 40 DOM
-
2026-06-01days on market $90,000 Active 39 DOM
-
2026-05-31days on market $90,000 Active 38 DOM
-
2026-05-31days on market $90,000 Active 37 DOM
-
2026-04-23$90,000 Active 400-char remark
-
2022-12-06soldstatus $125,000
-
2022-03-30$125,000 Active
-
2017-11-13soldstatus $82,000
-
2006-06-27soldstatus $125,000
ⓘ Source: listings_history table (triggers on properties + properties_extension) + one-shot
backfill from property_details.listing_events for pre-trigger history.
Tax reassessment forecast IA · Partial reset (capped growth)
- Current annual tax
- $3,574 · $298/mo
- Projected year-2 tax
- $3,574 · $298/mo
- Expected delta
- $0/yr ($0/mo · 0.0%)
ⓘ Screening estimate from a state-policy table — verify with the county assessor before closing.
Climate risk First Street
- Flood 1/10 Low FEMA zone X · 0% chance over 30 yrs
- Wildfire 4/10 Moderate
- Heat 3/10 Moderate 7 d/yr ≥103°F today · 15 d/yr by 30 yrs out
- Wind 2/10 Low
- Air quality 2/10 Low 1 unhealthy d/yr today · 1 by 30 yrs out
Nearby sold comps map
Loading sold comps map…
Walkable amenities ~0.75 mi
Loading nearby amenities…
Taxation est. · year 1
- Rental income
- $13,525
- − Mortgage interest
- −$4,761
- − Property taxes
- −$3,574
- − Insurance
- −$425
- − Repairs & maintenance
- −$1,082
- − Management
- −$1,082
- − Depreciation
- −$2,473
- Taxable income
- $128
- Est. tax owed @ 24.0%
- −$31
- After-tax cash flow
- $1,306/yr
For passive investors: Depreciation is non-cash, so a rental often shows a tax loss while cash-flowing — sheltering income. Rental losses are passive: they offset passive income freely, and up to $25,000/yr can offset ordinary (W-2) income if you actively participate and your MAGI is under $100k (phasing out to $0 by $150k); unused losses carry forward. On sale, claimed depreciation is recaptured at up to 25%, and gains may owe capital-gains tax (a 1031 exchange can defer both). Figures are a year-1 estimate at your 24.0% rate — not tax advice; consult a CPA.
Schools (NCES district)
- District
- Iowa Valley Community School District
- NCES district ID
- 1914850
- Math proficiency
- 70% ▼ -12.00%
- Reading proficiency
- 77% ▼ -2.00%
- Median HH income
- $47,781
- Composite
- 62.03/100
- National rank
- #719
- State rank
- #94 of 289 in IA
Livability — Marengo
- Score
- 69/100
- State rank
- #390
- US rank
- #8272
Category grades
Schools grade is shown separately in the Schools card above.
Census & demographics
- Census place
- Marengo, IA
- Population (ZIP)
- 4,046
Population outlook (Iowa County) Hauer SSP2
- Today (2025)
- 16,503 people
- By 2030
- 16,422 · -0.5%
- By 2040
- 16,081 · -2.6%
- By 2050
- 15,428 · -6.5%
- By 2075
- 14,067 · -14.8%
- By 2100
- 11,638 · -29.5%
Race, ethnicity, and origin ACS 2023
- Neighborhood character
- Predominantly White (95%)
- Race & ethnicity
- White 95% Two or more races 2% Hispanic / Latino 1% Black 1%
- Common ancestry
- Iranian 4% Serbian 2% Portuguese 2%
- Foreign-born
- 1% · Canada
- Languages at home
- 98% English-only · Spanish 1%
Political lean MEDSL · Iowa
- 2024 margin
- Strong R (+27.8) · D 35.4% · R 63.1% · Other 1.6%
- 2008→2024 swing
- -27.9pp toward R · 2008: 0.2pp · 2024: -27.8pp
- All cycles
- 2024: R+27.8 2020: R+25.3 2016: R+24.2 2012: R+4.9 2008: D+0.2
Not yet ingested
- Civics
- —
Market trends
- HPI YoY
- ▼ -4.18%
- Current HPI
- 246.6426
- Rent YoY
- —
- Metro
- —
- State GDP YoY
- ▲ 2.48%
- F500 in state
- 4
Industry mix (Fortune 500 HQ in IA)
| Industry | F500 HQs | Revenue |
|---|---|---|
| Financial Services | 1 | $16B |
|
||
| Retail / Convenience | 1 | $15B |
|
||
Price history
-32.0% since first listed6 events — show timeline
- 2026-06-16 Price Changed $85,000 CRAAR, CDRMLS
- 2026-04-23 Listed $90,000 CRAAR, CDRMLS
- 2022-12-06 Sold (Public Records) $125,000 Public Records
- 2022-03-30 Listed $125,000 ICAARMLS
- 2017-11-13 Sold (Public Records) $82,000 Public Records
- 2006-06-27 Sold (Public Records) $125,000 Public Records
Property tax history
+4.4%/yrLatest (2025): $3,574 · +6.1% YoY. Source: county tax records.
Cash-flow waterfall
monthlySold comps — $/sqft
last 12 mo · ≤1 miLoading sold comps…