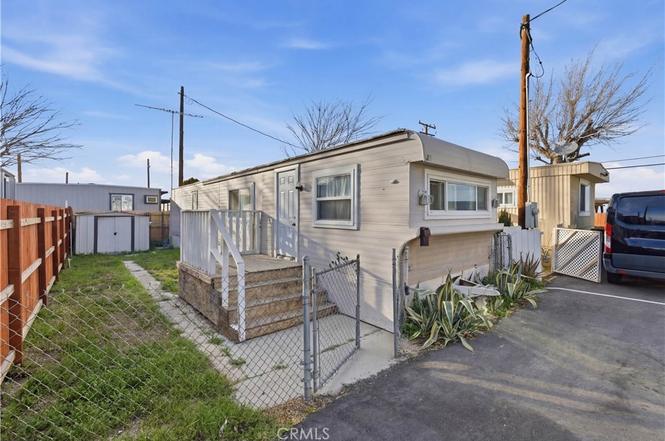
6150 E Avenue T #36 · Palmdale, CA
Flood risk 1/10 · Minimal
- FEMA flood zone
- X (unshaded)
- Chance of flooding over 30 yrs
- 0.0%
- Est. flood insurance / yr
- $507 – $1,088
Fire risk 7/10 · Major
- Est. fire insurance / yr
- $659 – $1,223
Heat risk 6/10 · Moderate
- Hot days now (above 99°F)
- 5 days/yr
- Hot days in 30 yrs
- 12 days/yr
Wind risk 1/10 · Minimal
- Chance of severe wind over 30 yrs
- —
Air-quality risk 10/10 · Severe
- Unhealthy air days now
- 33 days/yr
- Unhealthy air days in 30 yrs
- 37 days/yr
Risk factors via First Street. Map © Google.
Why this score? — see what drove the C- grade
The composite is a weighted blend of 9 inputs, each scored 0–100. Each bar is that input's sub-score; the figure is the points it added to the 100-point composite (weight × sub-score).
- Cash flow +15.0/30.0
- ARV discount +15.0/15.0
- 1% rule +5.0/10.0
- DSCR +5.0/10.0
- Livability +2.8/5.0
- Schools +2.7/10.0
- Rent growth +2.5/5.0
- Condition / age +2.5/5.0
- Appreciation +0.0/10.0
$24,500
🖨 Deal sheet 📄 Offer letter ✓ Due diligence
Listing remarks
Great opportunity in a well-located all-age park! This 2-bedroom, 1-bath home is one of the only units in the park featuring a bathtub and shower combo. Needs some cosmetic updates — perfect to add your own touch. Seller is motivated! Space rent includes all utilities. Conveniently located minutes from Highway 138 (Pearblossom), shopping (Walmart, Target, Stater Bros, Four Points), gas stations, and less than 10 minutes to the freeway. Affordable living in a prime location!
Key facts
- Well-located park
- 1,000 sq ft lot
- Built 1954
Tags
Property features AI
Finance
- Other: Living area and year-built source: public records; Lot size source: assessor's data; Use GPS for directions (property coordinates available)
- Financial info: Land lease in place — approximately $775 per month (seller provided); Rent includes all utilities
- HOA & community: Community features include street lighting and sidewalks; Manager approval required
Exterior
- Parking: Assigned parking; Located in Joshua View Mobile Home Park
- Utilities: Public sewer; District/public water
- Home design: Single-story mobile home; Mobile home remains on site; Mobile dimensions approximately 10 ft by 50 ft
- Construction: Year built per public records
- Exterior features: No pool; Level, street-front lot
Interior
- Bathrooms: 1 full bathroom
- Heating & cooling: Floor furnace heating
- Interior features: One-level layout; Left-side entry
- Laundry & utility: No in-home laundry
Neighborhood map
What this means for you Summary
Snapshot
- This is a 2-bed/1.0-bath manufactured listed at $24k.
Deal economics
- At list price, monthly cash flow is $2k ($21k/yr) — positive.
- The deal already cash-flows at list — no discount required.
- Meets the 1% rule at list price ($2k rent vs $24k).
- Recommended offer: $22k (9.0% below list) — sets the bar for market timing.
- Cap rate 90.8% vs local median 4.5% in Palmdale — top-decile yield for the area; either an underpriced asset or a hidden risk that comps aren't pricing in. Stress-test before assuming the spread holds.
Location & tenants
- Location reads 55/100 on livability (#861 in CA) — a working-class tenant base; expect higher turnover. Strengths: housing A+; Watch: schools F, crime F, amenities F.
- Keppel Union Elementary (rural): math 23% / reading 33% proficiency, ranked #1,089 of 1,400 in CA (top 78%) — low school quality limits family demand, transient renter base, plan for 1-2y turnover; 74% free/reduced lunch — lower-income household profile, screen leases tightly.
- Market conditions: 128 active listings in the ZIP; solid renter incomes; 19,697 units permitted in Los Angeles County in 2024 (9,426 in 5+ unit buildings).
- This rent runs 33% of the median local income ($86k/yr) — at the standard rent-burdened threshold; future hikes will face affordability resistance.
Forward outlook
- Local home prices are declining (-3.0%/yr); year-one equity from $169 of loan paydown is wiped out by about $735 of value loss. Plan a longer hold.
- Los Angeles County population projected at +9% by 2050 — modest demand growth; plan on rents tracking national, not racing it.
- At projected returns (-3.0% appreciation + 3.0% rent growth), your $7k cash investment doubles in ~1 year — after that, you're playing with house money.
Negotiation context
- It's been on market 113 days — a 9% lower offer ($22k) is reasonable based on typical stale-listing flexibility.
- 2 sale attempts since 4y ago; this cycle's ask has dropped $40k (62%) from the opening price — seller is motivated, your offer sets the floor, not the list.
Risks & watch-outs
- Watch-outs: built in 1954 — expect roof / HVAC / electrical / plumbing capex.
- Climate carrying-cost: major wildfire risk; extreme-heat days projected 5→12/yr by 2055 (HVAC capex compounding) — expect insurance premiums to compound above CPI over the hold.
Questions for the listing agent
- It's been on market 113 days. Have you received any prior offers? Is the seller open to a 9% concession, seller financing, or rate buy-down credit?
- Built in 1954 — when were the roof, HVAC, electrical panel, plumbing, and water heater last replaced?
- Why hasn't it sold? Are there any deal-killer items the seller is aware of (foundation, flood, title, zoning, code violations)?
- Is there a deadline driving the sale (1031 exchange, divorce, estate, relocation)? That informs how much negotiation room exists.
- Schools are F-rated, which usually means shorter tenancies and higher turnover. Who's the typical renter profile here, and what's been the actual vacancy rate?
- Crime grade is F in this area — have there been break-ins, vandalism, or insurance claims at this property in the last 3 years? What carrier currently insures it and at what premium?
- What's the average days-on-market for RENTAL listings here right now (not sales)? A rising rental-DOM trend means longer vacancies and softer asking-rent achievability than the comps imply.
- What's the recent tenant-quality profile in this submarket — average credit score on applications, eviction rate, late-payment / NSF rate, and stable-employment percentage? A property-management company in the area should have these aggregated.
- How much new for-sale + rental construction is in the pipeline within 1–3 miles? Heavy new supply typically softens prices + rents 12–24 months out; constrained supply supports both.
Investment metrics
- 1% rule
- 9.79% ✓
- Cap rate
- 90.81%
- Cash-on-cash
- 301.83%
- DSCR
- 14.43
- GRM
- 0.9
CMA / ARV
- ARV (on-the-fly)
- $44,500
- Comps found
- 1
Show comp detail 1 sale within ~0.75 mi
| Address | Dist | Beds/Ba | Sqft | Sold | Price | $/sf | Match |
|---|---|---|---|---|---|---|---|
| 6150 E T Ave Spc 27 | 0.07mi | 1/1.0 (-1) | 450 (-10%) | 20mo | $40,000 | $89 | 58 |
Match score weights: distance 35% · size 25% · config 20% · recency 20%. Top-matched comps best support the ARV.
Projected returns pro-forma
-3.0% appreciation · 3.0% rent growth · sell at horizon
- IRR
- —
- Equity multiple
- 16.45×
- Total profit
- $105,963
- Equity at exit
- $3,653
- IRR
- —
- Equity multiple
- 35.10×
- Total profit
- $233,927
- Equity at exit
- $2,118
Cash invested: $6,860 (down + closing). Projections, not guarantees.
Landlord ↔ Tenant lean methodology
- Overall (STATE)
- 18 Strongly Tenant-Friendly
- State California
- 18 Strongly Tenant-Friendly · D+13
- County
- — inherits STATE
- City
- — inherits STATE
ZIP-level market 93552
- Home prices YoY
- -6.4%
- Active inventory
- 128
- Price-to-rent
- 0.9×
Monthly cashflow live
- Estimated rent
- $2,398 medium interval (Pro) →
- Mortgage (P&I)
- −$128
- Tax est. 1.5%
- −$31 /mo · $368/yr
- Insurance
- −$10
- HOA
- −$0
- Vacancy / Maint / Mgmt
- −$504
- Net cashflow
- $1,725
Break-even live
UW: 25.0% down · 7.5% · 30yr · 1.5% tax · 5.0% vac · 8.0% maint · 8.0% mgmt
Financing live
Cash to close
- Down payment
- $6,125
- Closing costs
- $735
- Reserves months
- —
- Total cash needed
- —
Loan-product check · same deal, 3 products live
Conventional
25% down · 7.5% · 30yr
- Down + closing
- —
- Monthly P&I
- —
- Monthly cashflow
- —
- DSCR
- —
- Eligible?
- —
Personal DTI + credit; lowest rate.
DSCR
20% down · 8.5% · 30yr
- Down + closing
- —
- Monthly P&I
- —
- Monthly cashflow
- —
- DSCR
- —
- Eligible?
- —
No personal income docs; deal must DSCR.
Hard money
10% down · 12.0% · 12mo
- Down + closing
- —
- Monthly P&I
- —
- Monthly cashflow
- —
- DSCR
- —
- Eligible?
- —
Short-term bridge; refi at stabilization.
Listing history 28 events
-
2026-06-18days on market $24,500 Active 113 DOM
-
2026-06-17days on market $24,500 Active 112 DOM
-
2026-06-16days on market $24,500 Active 111 DOM
-
2026-06-15days on market $24,500 Active 110 DOM
-
2026-06-13days on market $24,500 Active 108 DOM
-
2026-06-13days on market $24,500 Active 107 DOM
-
2026-06-09days on market $24,500 Active 104 DOM
-
2026-06-08days on market $24,500 Active 103 DOM
-
2026-06-07days on market $24,500 Active 102 DOM
-
2026-06-04days on market $24,500 Active 99 DOM
-
2026-06-03days on market $24,500 Active 98 DOM
-
2026-06-02days on market $24,500 Active 97 DOM
-
2026-06-01days on market $24,500 Active 96 DOM
-
2026-05-31days on market $24,500 Active 95 DOM
-
2026-04-21price $25,000
-
2026-04-08price $30,000
-
2026-03-24price $35,000
-
2026-03-15price $40,000
-
2026-03-09price $44,000
-
2026-03-02price $55,000
-
2026-02-25$65,000 Active
-
2023-03-06price $34,900
-
2023-03-06price
-
2023-01-23price $44,900
-
2023-01-23price
-
2023-01-14price $45,900
-
2023-01-14price
-
2022-12-30Active
ⓘ Source: listings_history table (triggers on properties + properties_extension) + one-shot
backfill from property_details.listing_events for pre-trigger history.
Climate risk First Street
- Flood 1/10 Low FEMA zone X (unshaded) · 0% chance over 30 yrs
- Wildfire 7/10 Severe
- Heat 6/10 Major 5 d/yr ≥99°F today · 12 d/yr by 30 yrs out
- Wind 1/10 Low
- Air quality 10/10 Extreme 33 unhealthy d/yr today · 37 by 30 yrs out
Nearby sold comps map
Loading sold comps map…
Walkable amenities ~0.75 mi
Loading nearby amenities…
Taxation est. · year 1
- Rental income
- $28,782
- − Mortgage interest
- −$1,372
- − Property taxes
- −$368
- − Insurance
- −$122
- − Repairs & maintenance
- −$2,303
- − Management
- −$2,303
- − Depreciation
- −$713
- Taxable income
- $21,601
- Est. tax owed @ 24.0%
- −$5,184
- After-tax cash flow
- $15,521/yr
For passive investors: Depreciation is non-cash, so a rental often shows a tax loss while cash-flowing — sheltering income. Rental losses are passive: they offset passive income freely, and up to $25,000/yr can offset ordinary (W-2) income if you actively participate and your MAGI is under $100k (phasing out to $0 by $150k); unused losses carry forward. On sale, claimed depreciation is recaptured at up to 25%, and gains may owe capital-gains tax (a 1031 exchange can defer both). Figures are a year-1 estimate at your 24.0% rate — not tax advice; consult a CPA.
Schools (NCES district)
- District
- Keppel Union Elementary
- NCES district ID
- 0619440
- Math proficiency
- 23% ▼ -2.00%
- Reading proficiency
- 33% ▲ 1.00%
- Median HH income
- $48,099
- Composite
- 27.26/100
- National rank
- #12432
- State rank
- #1089 of 1400 in CA
Livability — Palmdale
- Score
- 55/100
- State rank
- #861
- US rank
- #23501
Category grades
Schools grade is shown separately in the Schools card above.
Census & demographics
- Census place
- Palmdale, CA
- County
- Los Angeles County · 9,444,647 people
- City population
- 177,644
- Metro
- Los Angeles-Long Beach-Anaheim, CA
- Population (ZIP)
- 42,639
- Household income
- $85,954
- Rent vs Own
- Severe rent burden
- 747.0
Population outlook (Los Angeles County) Hauer SSP2
- Today (2025)
- 10,940,515 people
- By 2030
- 11,256,481 · +2.9%
- By 2040
- 11,729,929 · +7.2%
- By 2050
- 11,948,407 · +9.2%
- By 2075
- 11,818,114 · +8.0%
- By 2100
- 10,842,928 · -0.9%
Race, ethnicity, and origin ACS 2023
- Neighborhood character
- Predominantly Hispanic (72%)
- Race & ethnicity
- Hispanic / Latino 72% Two or more races 21% Black 13% White 11% Asian 2% Native American 1%
- Hispanic origin (detail)
- Mexican 55%
- Common ancestry
- Italian 1%
- Foreign-born
- 27% · Canada, Dominican Republic
- Languages at home
- 42% English-only · Spanish 55% Tagalog/Filipino 1%
Political lean MEDSL · Los Angeles
- 2024 margin
- Solid D (+32.9) · D 64.8% · R 31.9% · Other 3.3%
- 2008→2024 swing
- -7.4pp toward R · 2008: 40.4pp · 2024: 32.9pp
- All cycles
- 2024: D+32.9 2020: D+44.2 2016: D+48.0 2012: D+40.0 2008: D+40.4
Not yet ingested
- Civics
- —
Market trends
- HPI YoY
- ▼ -27.00%
- Current HPI
- 394.1607
- Rent YoY
- —
- Metro
- Los Angeles-Long Beach-Anaheim, CA
- State GDP YoY
- ▲ 3.21%
- F500 in state
- 116
Industry mix (Fortune 500 HQ in CA)
| Industry | F500 HQs | Revenue |
|---|---|---|
| Technology | 27 | $1,492B |
|
||
| Financial Services | 3 | $174B |
|
||
| Retail | 3 | $44B |
|
||
| Insurance | 3 | $26B |
|
||
| Media / Entertainment | 2 | $115B |
|
||
| Pharmaceuticals / Biotech | 2 | $62B |
|
||
Price history
-45.5% since first listed14 events — show timeline
- 2026-04-21 Price Changed $25,000 CRMLS
- 2026-04-08 Price Changed $30,000 CRMLS
- 2026-03-24 Price Changed $35,000 CRMLS
- 2026-03-15 Price Changed $40,000 CRMLS
- 2026-03-09 Price Changed $44,000 CRMLS
- 2026-03-02 Price Changed $55,000 CRMLS
- 2026-02-25 Listed $65,000 CRMLS
- 2023-03-06 Price Changed $34,900 AVMLS
- 2023-03-06 Price Changed — TheMLS
- 2023-01-23 Price Changed $44,900 AVMLS
- 2023-01-23 Price Changed — TheMLS
- 2023-01-14 Price Changed $45,900 AVMLS
- 2023-01-14 Price Changed — TheMLS
- 2022-12-30 Listed — TheMLS
Cash-flow waterfall
monthlySold comps — $/sqft
last 12 mo · ≤1 miLoading sold comps…