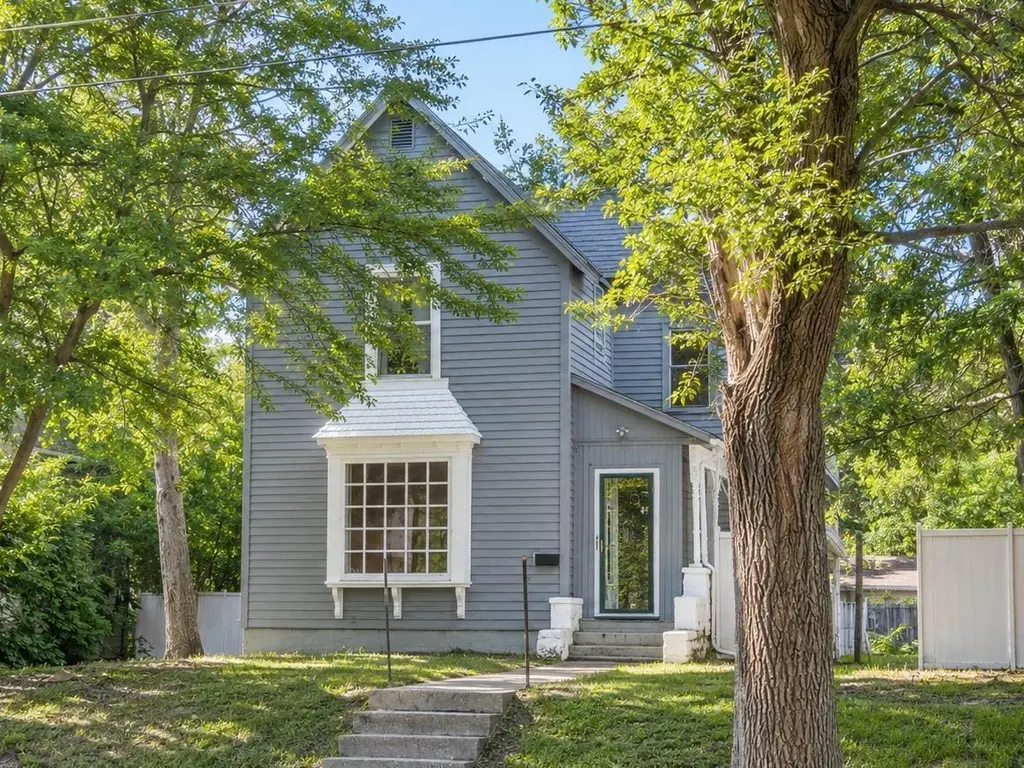
713 St Lawrence Ave · Beloit, WI
Flood risk 1/10 · Minimal
- FEMA flood zone
- X (unshaded)
- Chance of flooding over 30 yrs
- 0.0%
- Est. flood insurance / yr
- $507 – $1,088
Fire risk 1/10 · Minimal
- Est. fire insurance / yr
- $636 – $1,182
Heat risk 3/10 · Minor
- Hot days now (above 101°F)
- 7 days/yr
- Hot days in 30 yrs
- 14 days/yr
Wind risk 2/10 · Minimal
- Chance of severe wind over 30 yrs
- —
Air-quality risk 3/10 · Minor
- Unhealthy air days now
- 2 days/yr
- Unhealthy air days in 30 yrs
- 3 days/yr
Risk factors via First Street. Map © Google.
Why this score? — see what drove the D grade
The composite is a weighted blend of 9 inputs, each scored 0–100. Each bar is that input's sub-score; the figure is the points it added to the 100-point composite (weight × sub-score).
- Cash flow +15.7/30.0
- ARV discount +7.5/15.0
- DSCR +4.8/10.0
- 1% rule +4.5/10.0
- Rent growth +4.0/5.0
- Livability +3.5/5.0
- Condition / age +2.5/5.0
- Schools +0.9/10.0
- Appreciation +0.0/10.0
$155,000
🖨 Deal sheet (PDF) 📄 Offer letter ✓ Due diligence
Listing remarks
Charming and full of updates, this inviting home offers 3 bedrooms with the potential to create 2 additional bedrooms, providing flexibility for your needs. Recent improvements include a new front door, new side door, fresh paint, new main-floor flooring, updated thermostat, new shower head, and ADT security system. Major updates completed in 2022 include a new 100-amp electrical service and panel, some updated plumbing, new water heater, new toilets, and a new garage door track. Move-in ready with a blend of character, comfort, and peace of mind! Sold "as-is".
Key facts
- Updated thermostat
- Fresh paint
- New side door
Tags
Property features AI
Finance
- Other: Lot size about 0.21 acre; Zoning R1-I1
Exterior
- Parking: Detached 1-car garage; Total of 1 garage parking space
- Utilities: Municipal water; Municipal sewer; Natural gas
- Home design: Single-family, 2-story; Estimated finished above-grade area about 1,993
- Construction: Built (year source: assessor/public record)
- Exterior features: Wood exterior; Sidewalks
Interior
- Kitchen: Range/oven; Refrigerator; Microwave (not working)
- Bedrooms: Master bedroom (Upper) about 15 x 11; Bedroom 2 (Upper) about 12 x 11; Bedroom 3 (Upper) about 11 x 11; Bonus room (Main) about 15 x 11
- Bathrooms: One full bath; One half bath; Whirlpool tub; at least one tub; no master bedroom bath
- Heating & cooling: Forced air heating; Natural gas fuel
- Interior features: Walk-in closets; Cable/satellite available; Full basement
- Laundry & utility: Washer; Dryer
Neighborhood map
What this means for you Summary
Snapshot
- This is a 3-bed/1.5-bath other listed at $155k.
Deal economics
- At list price, monthly cash flow is $67 ($808/yr) — positive.
- The deal already cash-flows at list — no discount required.
- To meet the 1% rule (rent ≥ 1% of price), the offer needs to be $147k (4.9% below list).
- Recommended offer: $147k (4.9% below list) — sets the bar for 1% rule.
- Cap rate 6.8% vs local median 3.5% in Beloit — top-decile yield for the area; either an underpriced asset or a hidden risk that comps aren't pricing in. Stress-test before assuming the spread holds.
Location & tenants
- Location reads 70/100 on livability (#283 in WI) — a middle-class / working-renter tenant base. Strengths: cost of living A+, housing A+, health & safety A+; Watch: crime D, amenities F, commute F.
- Beloit School District (urban): math 8% / reading 13% proficiency, ranked #339 of 342 in WI (top 99%) — low school quality limits family demand, transient renter base, plan for 1-2y turnover; 70% free/reduced lunch — lower-income household profile, screen leases tightly.
- Zoned schools: Hackett Elementary (math 2% / reading 2%, grade F, #1,024 of 1,041 statewide, top 100%, 287 students, 80% FRL); Cunningham Intermediate (math 6% / reading 9%, grade F, #376 of 383 statewide, top 98%, 427 students, 78% FRL); Memorial High (math 8% / reading 14%, grade F, #438 of 483 statewide, top 91%, 1,417 students, 66% FRL).
- Market conditions: Rents rising fast (+6.0%/yr); 203 active listings in the ZIP; 5 comparable units currently listed for rent nearby; rentals lingering (median 46d on market — plan ~5-8 weeks vacancy on turnover, expect pricing pressure); 60% of comp listings sitting > 30 days — soft ceiling on asking rent; 629 units permitted in Rock County in 2024 (263 in 5+ unit buildings).
Forward outlook
- Local home prices are declining (-3.0%/yr); year-one equity from $1k of loan paydown is wiped out by about $5k of value loss. Plan a longer hold.
- Rock County population projected to shrink 7% by 2050 — rents likely to lag national; underwrite the cash flow, not the appreciation.
Negotiation context
- Only 6 days on market — expect competitive offers; lowballing is unlikely to land.
- Current owner paid $120k; 29% above their basis — modest negotiation headroom, anchor on the comps not their cost.
Risks & watch-outs
- Watch-outs: built in 1900 — expect roof / HVAC / electrical / plumbing capex.
Questions for the listing agent
- Built in 1900 — when were the roof, HVAC, electrical panel, plumbing, and water heater last replaced?
- Is there a deadline driving the sale (1031 exchange, divorce, estate, relocation)? That informs how much negotiation room exists.
- Schools are F-rated, which usually means shorter tenancies and higher turnover. Who's the typical renter profile here, and what's been the actual vacancy rate?
- Crime grade is D in this area — have there been break-ins, vandalism, or insurance claims at this property in the last 3 years? What carrier currently insures it and at what premium?
- The area grade is low — what's the realistic commute time and amenity access for the typical tenant pool here? Any planned neighborhood developments (good or bad) we should know about?
- What's the average days-on-market for RENTAL listings here right now (not sales)? A rising rental-DOM trend means longer vacancies and softer asking-rent achievability than the comps imply.
- What's the recent tenant-quality profile in this submarket — average credit score on applications, eviction rate, late-payment / NSF rate, and stable-employment percentage? A property-management company in the area should have these aggregated.
- How much new for-sale + rental construction is in the pipeline within 1–3 miles? Heavy new supply typically softens prices + rents 12–24 months out; constrained supply supports both.
Investment metrics
- 1% rule
- 0.95% ✗
- Cap rate
- 6.81%
- Cash-on-cash
- 1.86%
- DSCR
- 1.08
- GRM
- 8.8
CMA / ARV
No comps found within radius.
Projected returns pro-forma
-3.0% appreciation · 6.05% rent growth · sell at horizon
- IRR
- -9.9%
- Equity multiple
- 0.63×
- Total profit
- $-16,124
- Equity at exit
- $23,111
- IRR
- 3.4%
- Equity multiple
- 1.28×
- Total profit
- $12,017
- Equity at exit
- $13,402
Cash invested: $43,400 (down + closing). Projections, not guarantees.
Landlord ↔ Tenant lean methodology
- Overall (STATE)
- 73 Landlord-Friendly
- State Wisconsin
- 73 Landlord-Friendly · R+2
- County
- — inherits STATE
- City
- — inherits STATE
ZIP-level market 53511
- Home prices YoY
- -26.9%
- Rents YoY
- 6.0%
- Active inventory
- 203
- Price-to-rent
- 8.8×
Monthly cashflow live
- Estimated rent
- $1,475 high interval (Pro) →
- Mortgage (P&I)
- −$813
- Tax from tax record
- −$220 /mo · $2,643/yr
- Insurance
- −$65
- HOA
- −$0
- Vacancy / Maint / Mgmt
- −$310
- Net cashflow
- $67
Break-even live
Sensitivity live
| Price | -10% $155 | -5% $111 | +0% $67 | +5% $24 | +10% $-20 |
|---|---|---|---|---|---|
| Rent | -10% $-49 | -5% $9 | +0% $67 | +5% $126 | +10% $184 |
| Rate | -1.0pp $145 | -0.5pp $107 | base $67 | +0.5pp $27 | +1.0pp $-14 |
UW: 25.0% down · 7.5% · 30yr · 1.5% tax · 5.0% vac · 8.0% maint · 8.0% mgmt
Financing live
Cash to close
- Down payment
- $38,750
- Closing costs
- $4,650
- Reserves months
- —
- Total cash needed
- —
Loan-product check · same deal, 3 products live
Conventional
25% down · 7.5% · 30yr
- Down + closing
- —
- Monthly P&I
- —
- Monthly cashflow
- —
- DSCR
- —
- Eligible?
- —
Personal DTI + credit; lowest rate.
DSCR
20% down · 8.5% · 30yr
- Down + closing
- —
- Monthly P&I
- —
- Monthly cashflow
- —
- DSCR
- —
- Eligible?
- —
No personal income docs; deal must DSCR.
Hard money
10% down · 12.0% · 12mo
- Down + closing
- —
- Monthly P&I
- —
- Monthly cashflow
- —
- DSCR
- —
- Eligible?
- —
Short-term bridge; refi at stabilization.
Rent comps 5 comps
| Address | Beds | Baths | Sqft | Rent | $/sqft | DOM | Units | Dist |
|---|---|---|---|---|---|---|---|---|
| 253 W Grand Ave Beloit, WI | 4.0 | 1.0 | 1600 | $1,500 | $0.94 | 45d | 1 | 0.34mi |
| 861 Bluff St Unit 861 Beloit, WI | 4.0 | 1.0 | 1282 | $1,600 | $1.25 | 45d | 1 | 0.35mi |
| 1223 6th St Beloit, WI | 4.0 | 2.0 | 1464 | $1,750 | $1.20 | 45d | 1 | 0.75mi |
| 205 Birch Ave Unit 2 Beloit, WI | 2.0 | 1.0 | 1288 | $1,000 | $0.78 | 15d | 1 | 1.28mi |
| 206 Carpenter St Unit 3 Beloit, WI | 2.0 | 1.0 | 1400 | $1,000 | $0.71 | 15d | 1 | 1.31mi |
Listing history 6 events
-
2026-06-21days on market $155,000 Active 6 DOM
-
2026-06-19days on market $155,000 Active 4 DOM
-
2026-06-18days on market $155,000 Active 3 DOM
-
2026-06-17days on market $155,000 Active 2 DOM
-
2026-06-15remarks 567-char remark
-
2026-06-15$155,000 Active 1 DOM
ⓘ Source: listings_history table (triggers on properties + properties_extension) + one-shot
backfill from property_details.listing_events for pre-trigger history.
Tax reassessment forecast WI · Partial reset (capped growth)
- Current annual tax
- $2,643 · $220/mo
- Projected year-2 tax
- $2,755 · $230/mo
- Expected delta
- +$112/yr (+$9/mo · 4.3%)
ⓘ Screening estimate from a state-policy table — verify with the county assessor before closing.
Climate risk First Street
- Flood 1/10 Low FEMA zone X (unshaded) · 0% chance over 30 yrs
- Wildfire 1/10 Low
- Heat 3/10 Moderate 7 d/yr ≥101°F today · 14 d/yr by 30 yrs out
- Wind 2/10 Low
- Air quality 3/10 Moderate 2 unhealthy d/yr today · 3 by 30 yrs out
Nearby sold comps map
Loading sold comps map…
Walkable amenities ~0.75 mi
Loading nearby amenities…
Taxation est. · year 1
- Rental income
- $17,697
- − Mortgage interest
- −$8,682
- − Property taxes
- −$2,643
- − Insurance
- −$775
- − Repairs & maintenance
- −$1,416
- − Management
- −$1,416
- − Depreciation
- −$4,509
- Taxable loss
- −$1,744
- Est. tax savings @ 24.0%
- +$419
- After-tax cash flow
- $1,227/yr
For passive investors: Depreciation is non-cash, so a rental often shows a tax loss while cash-flowing — sheltering income. Rental losses are passive: they offset passive income freely, and up to $25,000/yr can offset ordinary (W-2) income if you actively participate and your MAGI is under $100k (phasing out to $0 by $150k); unused losses carry forward. On sale, claimed depreciation is recaptured at up to 25%, and gains may owe capital-gains tax (a 1031 exchange can defer both). Figures are a year-1 estimate at your 24.0% rate — not tax advice; consult a CPA.
Schools (NCES district)
- District
- Beloit School District
- NCES district ID
- 5501050
- Math proficiency
- 8% ▼ -10.00%
- Reading proficiency
- 13% ▼ -5.00%
- Median HH income
- $37,328
- Composite
- 8.81/100
- National rank
- #9890
- State rank
- #339 of 342 in WI
Livability — Beloit
- Score
- 70/100
- State rank
- #283
- US rank
- #7336
Category grades
Schools grade is shown separately in the Schools card above.
Census & demographics
- Census place
- Beloit, WI
- County
- Rock County · 135,428 people
- City population
- 48,701
- Metro
- Janesville-Beloit, WI
- Population (ZIP)
- 48,701
- Household income
- $67,067
- Rent vs Own
- Severe rent burden
- 1341.0
Population outlook (Rock County) Hauer SSP2
- Today (2025)
- 163,403 people
- By 2030
- 162,815 · -0.4%
- By 2040
- 158,655 · -2.9%
- By 2050
- 151,235 · -7.4%
- By 2075
- 131,901 · -19.3%
- By 2100
- 108,665 · -33.5%
Race, ethnicity, and origin ACS 2023
- Neighborhood character
- Majority White (64%)
- Race & ethnicity
- White 64% Hispanic / Latino 19% Two or more races 14% Black 11% Asian 1%
- Hispanic origin (detail)
- Mexican 15% Dominican 1%
- Common ancestry
- Portuguese 8% Romanian 3% Lithuanian 2%
- Foreign-born
- 9% · Canada
- Languages at home
- 85% English-only · Spanish 14%
Political lean MEDSL · Rock
- 2024 margin
- Lean D (+7.3) · D 52.9% · R 45.6% · Other 1.4%
- 2008→2024 swing
- -22.0pp toward R · 2008: 29.3pp · 2024: 7.3pp
- All cycles
- 2024: D+7.3 2020: D+11.2 2016: D+10.5 2012: D+23.2 2008: D+29.3
Not yet ingested
- Civics
- —
Market trends
- HPI YoY
- ▼ -115.19%
- Current HPI
- 312.6591
- Rent YoY
- ▲ 6.05%
- Metro
- Janesville-Beloit, WI
- State GDP YoY
- ▲ 2.10%
- F500 in state
- 20
Industry mix (Fortune 500 HQ in WI)
| Industry | F500 HQs | Revenue |
|---|---|---|
| Industrial Machinery | 4 | $23B |
|
||
| Industrial Technology | 2 | $36B |
|
||
| Insurance | 1 | $36B |
|
||
| Professional Services | 1 | $19B |
|
||
| Utilities | 1 | $9B |
|
||
| Consumer Goods | 1 | $3B |
|
||
Price history
+229.8% since first listed3 events — show timeline
- 2026-06-15 Listed $155,000 SCWMLS
- 2022-08-23 Sold (Public Records) $120,000 Public Records
- 2017-08-02 Sold (Public Records) $47,000 Public Records
Property tax history
+4.0%/yrLatest (2025): $2,643 · +35.2% YoY. Source: county tax records.
Cash-flow waterfall
monthlySold comps — $/sqft
last 12 mo · ≤1 miLoading sold comps…