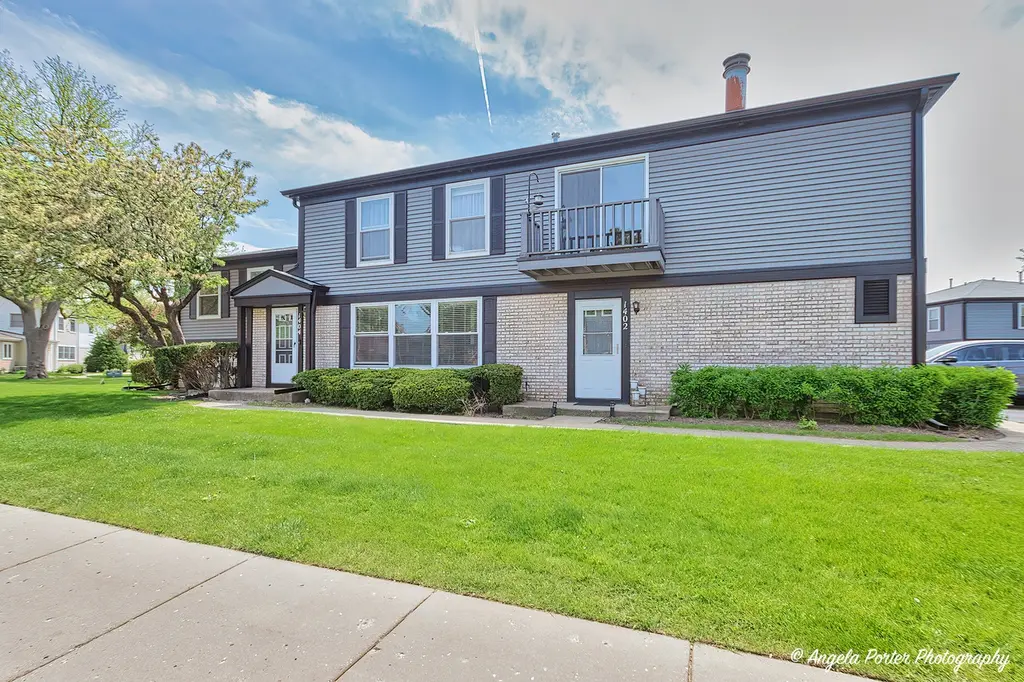
1402 Inverrary Ln #1402 · Buffalo Grove, IL
Flood risk 1/10 · Minimal
- FEMA flood zone
- X (unshaded)
- Chance of flooding over 30 yrs
- 0.0%
- Est. flood insurance / yr
- $473 – $860
Fire risk 1/10 · Minimal
- Est. fire insurance / yr
- $804 – $1,492
Heat risk 3/10 · Minor
- Hot days now (above 99°F)
- 7 days/yr
- Hot days in 30 yrs
- 14 days/yr
Wind risk 2/10 · Minimal
- Chance of severe wind over 30 yrs
- —
Air-quality risk 4/10 · Minor
- Unhealthy air days now
- 4 days/yr
- Unhealthy air days in 30 yrs
- 5 days/yr
Risk factors via First Street. Map © Google.
Why this score? — see what drove the D- grade
The composite is a weighted blend of 9 inputs, each scored 0–100. Each bar is that input's sub-score; the figure is the points it added to the 100-point composite (weight × sub-score).
- Cash flow +9.2/30.0
- ARV discount +7.5/15.0
- Schools +7.1/10.0
- 1% rule +4.3/10.0
- Livability +3.9/5.0
- DSCR +2.6/10.0
- Rent growth +2.5/5.0
- Condition / age +2.5/5.0
- Appreciation +0.0/10.0
$259,000
🖨 Deal sheet 📄 Offer letter ✓ Due diligence
Listing remarks
Welcome to this beautiful 2-bedroom, 1-bath upper-level condo located within the Adlai E. Stevenson High School District! Step inside and discover a bright, open-concept floor plan designed for both everyday living and effortless entertaining. The spacious kitchen features rich cabinetry, ample counter space, and a convenient breakfast bar that flows seamlessly into the inviting living area. Unwind in the cozy living room, complete with a charming gas-burning fireplace, or step outside to your private balcony-the perfect spot to enjoy your morning coffee, unwind after a long day, or soak in the fresh air. This move-in-ready home also offers the convenience of an in-unit washer and dryer, pl
Key facts
- Private balcony
- Spacious kitchen
- Breakfast bar
Tags
Property features AI
Finance
- Other: Unit is condominium ownership; Not rebuilt or rehabbed
- HOA & community: Monthly association fee of $304; Association covers water, insurance, clubhouse, pool, lawn care, refuse (scavenger) and snow removal; Pets allowed (cats and dogs allowed; maximum pet weight listed as 999)
Exterior
- Parking: Attached garage (garage owned) with asphalt surface — 1 garage space, 1 total parking space
- Utilities: Water source: Lake Michigan; Public sewer
- Home design: Attached single condo; Entry level: 2 (unit accessed on second level); Estimated living area; Built approximately 41–50 years ago; Unit is part of a 3-unit building
- Construction: Aluminum siding, vinyl siding and brick exterior; Asphalt roof; Concrete perimeter foundation; Built before 1978
- Exterior features: Balcony; Common grounds
Interior
- Kitchen: Range; Dishwasher; Refrigerator; Disposal
- Bedrooms: Master bedroom on the second level (16 x 12) with carpet; Second bedroom on the second level (13 x 10) with carpet
- Flooring: Carpet in living room, dining room and bedrooms
- Bathrooms: One full bathroom
- Heating & cooling: Natural gas forced air heating; Central air conditioning
- Interior features: Five total rooms; Balcony access (exterior feature connected to living space); One fireplace with gas log and gas starter in the living room
- Laundry & utility: In-unit laundry with washer and dryer
Neighborhood map
What this means for you Summary
Snapshot
- This is a 2-bed/1.0-bath condo listed at $259k.
Deal economics
- At list price, monthly cash flow is $-196 ($-2k/yr) — negative.
- To cash-flow at today's rent, offer at most $231k (11.0% below list).
- To meet the 1% rule (rent ≥ 1% of price), the offer needs to be $240k (7.3% below list).
- Recommended offer: $231k (11.0% below list) — sets the bar for cash-flow.
- Cap rate 5.4% vs local median 3.3% in Buffalo Grove — top-decile yield for the area; either an underpriced asset or a hidden risk that comps aren't pricing in. Stress-test before assuming the spread holds.
Location & tenants
- Location reads 77/100 on livability (#163 in IL, #3,025 nationally) — a middle-class / working-renter tenant base. Strengths: crime A+, employment A+, housing A+; Watch: amenities C-, health & safety C-, commute F.
- Adlai E Stevenson Hsd 125 (suburban): math 72% / reading 73% proficiency, ranked #3 of 620 in IL (top 0%) — strong family-tenant draw, lease renewals of 3-5y typical.
- Zoned schools: Adlai E Stevenson High School (math 72% / reading 73%, grade B+, #7 of 693 statewide, top 1%, 4,489 students, 0% FRL).
- Market conditions: 117 active listings in the ZIP; 40 comparable units currently listed for rent nearby; rentals leasing fast (median 10d on market — plan ~1-2 weeks tenant-placement turnaround); high-income renter base; 948 units permitted in Lake County in 2024 (424 in 5+ unit buildings).
- This rent is only 16% of the median local income ($183k/yr) — well below the 30% rent-burden line; pricing power to push rent on renewal without tenant pushback.
Forward outlook
- Local home prices are declining (-3.0%/yr); year-one equity from $2k of loan paydown is wiped out by about $8k of value loss. Plan a longer hold.
- Lake County population projected to shrink 8% by 2050 — rents likely to lag national; underwrite the cash flow, not the appreciation.
Negotiation context
- Only 6 days on market — expect competitive offers; lowballing is unlikely to land.
- 10 sale attempts since 7y ago with the ask held roughly flat each time — persistent listings suggest the price (not the market) is what's stuck; bring a comps-based counter.
Questions for the listing agent
- What do current leases actually rent for vs. the listed asking? Can we see a recent rent roll and the last 12 months of T-12 income?
- Built in 1977 — when were the roof, HVAC, electrical panel, plumbing, and water heater last replaced?
- What does the HOA fee cover, when was the last increase, and are there any pending special assessments or reserve-fund shortfalls?
- Any open or pending special assessments — roof, HVAC, plumbing, elevator, façade? What's the per-unit balance and payoff schedule, and is the seller paying it off at close or rolling it to the buyer?
- Is there a deadline driving the sale (1031 exchange, divorce, estate, relocation)? That informs how much negotiation room exists.
- Schools are A-rated — typically a magnet for longer-tenancy family renters. What's the average tenant stay here, and is there a school-zone premium baked into asking?
- The area grade is low — what's the realistic commute time and amenity access for the typical tenant pool here? Any planned neighborhood developments (good or bad) we should know about?
- What's the average days-on-market for RENTAL listings here right now (not sales)? A rising rental-DOM trend means longer vacancies and softer asking-rent achievability than the comps imply.
- What's the recent tenant-quality profile in this submarket — average credit score on applications, eviction rate, late-payment / NSF rate, and stable-employment percentage? A property-management company in the area should have these aggregated.
- How much new apartment / multifamily construction is in the pipeline within 1–3 miles? Heavy new supply (>2% of stock underway) typically softens rents 12–24 months out; light construction supports rent growth.
Investment metrics
- 1% rule
- 0.93% ✗
- Cap rate
- 5.38%
- Cash-on-cash
- -3.25%
- DSCR
- 0.86
- GRM
- 9.0
CMA / ARV
No comps found within radius.
Projected returns pro-forma
-3.0% appreciation · 3.0% rent growth · sell at horizon
- IRR
- -21.6%
- Equity multiple
- 0.25×
- Total profit
- $-54,246
- Equity at exit
- $38,618
- IRR
- -15.1%
- Equity multiple
- 0.14×
- Total profit
- $-62,425
- Equity at exit
- $22,394
Cash invested: $72,520 (down + closing). Projections, not guarantees.
Landlord ↔ Tenant lean methodology
- Overall (STATE)
- 43 Moderately Tenant-Leaning
- State Illinois
- 43 Moderately Tenant-Leaning · D+7
- County
- — inherits STATE
- City
- — inherits STATE
ZIP-level market 60015
- Active inventory
- 117
- Price-to-rent
- 9.0×
Monthly cashflow live
- Estimated rent
- $2,402 high interval (Pro) →
- Mortgage (P&I)
- −$1,358
- Tax est. 1.5%
- −$324 /mo · $3,885/yr
- Insurance
- −$108
- HOA
- −$304
- Vacancy / Maint / Mgmt
- −$504
- Net cashflow
- $-196
Break-even live
UW: 25.0% down · 7.5% · 30yr · 1.5% tax · 5.0% vac · 8.0% maint · 8.0% mgmt
Financing live
Cash to close
- Down payment
- $64,750
- Closing costs
- $7,770
- Reserves months
- —
- Total cash needed
- —
Loan-product check · same deal, 3 products live
Conventional
25% down · 7.5% · 30yr
- Down + closing
- —
- Monthly P&I
- —
- Monthly cashflow
- —
- DSCR
- —
- Eligible?
- —
Personal DTI + credit; lowest rate.
DSCR
20% down · 8.5% · 30yr
- Down + closing
- —
- Monthly P&I
- —
- Monthly cashflow
- —
- DSCR
- —
- Eligible?
- —
No personal income docs; deal must DSCR.
Hard money
10% down · 12.0% · 12mo
- Down + closing
- —
- Monthly P&I
- —
- Monthly cashflow
- —
- DSCR
- —
- Eligible?
- —
Short-term bridge; refi at stabilization.
Rent comps 40 comps
| Address | Beds | Baths | Sqft | Rent | $/sqft | DOM | Units | Dist |
|---|---|---|---|---|---|---|---|---|
| 1326 Inverrary Ln #1326 Deerfield, IL | 3.0 | 1.0 | 992 | $2,100 | $2.12 | 20d | 1 | 0.06mi |
| 1128 Johnson Dr Unit 3521 Buffalo Grove, IL | 2.0 | 2.0 | 975 | $2,150 | $2.21 | 22d | 1 | 0.10mi |
| 1216 Inverrary Ln #1216 Deerfield, IL | 2.0 | 1.0 | 1100 | $2,075 | $1.89 | 24d | 1 | 0.14mi |
| 746 Inverrary Ln Deerfield, IL | 2.0 | 1.5 | 992 | $2,500 | $2.52 | 24d | 1 | 0.41mi |
| 1411 Johnson Dr Unit 1326 Buffalo Grove, IL | 1.0 | 1.0 | 715 | $1,660 | $2.32 | 22d | 1 | 0.53mi |
| 536 Inverrary Ln Deerfield, IL | 2.0 | 1.5 | 1000 | $2,450 | $2.45 | 24d | 1 | 0.54mi |
| 544 Inverrary Ln Deerfield, IL | 2.0 | 1.5 | 922 | $2,650 | $2.87 | 24d | 1 | 0.54mi |
| 272 Le Parc Cir Buffalo Grove, IL | 3.0 | 2.5 | 1450 | $3,200 | $2.21 | 1d | 1 | 0.55mi |
| 614 Le Parc Cir Unit 22-2 Buffalo Grove, IL | 2.0 | 1.0 | 1239 | $2,200 | $1.78 | 24d | 1 | 0.59mi |
| 1225 Deerfield Pkwy Buffalo Grove, IL | 1.0–3.0 | 1.0–2.0 | 1000 | $2,290 | $2.29 | 1d | 17 | 0.62mi |
| 733 Plum Tree Ct Unit C2 Wheeling, IL | 2.0 | 1.0 | 1100 | $2,150 | $1.95 | 1d | 1 | 0.62mi |
| 360 W Inverrary Ln Deerfield, IL | 2.0 | 2.5 | 1090 | $2,600 | $2.39 | 24d | 1 | 0.67mi |
| 341 Redwing Dr Deerfield, IL | 2.0 | 2.5 | 1386 | $2,650 | $1.91 | 4d | 1 | 0.67mi |
| 1182 Northbury Ln Unit D2 Wheeling, IL | 2.0 | 2.0 | 1200 | $2,095 | $1.75 | 1d | 1 | 0.69mi |
| 1180 Northbury Ln Wheeling, IL | 3.0 | 2.0 | 1305 | $2,650 | $2.03 | 1d | 1 | 0.70mi |
| 1106 Wildberry Ct Unit B1 Wheeling, IL | 2.0 | 2.0 | 1100 | $2,350 | $2.14 | 2d | 1 | 0.73mi |
| 1106 Wildberry Ct Unit B1 Wheeling, IL | 2.0 | 2.0 | 1100 | $2,500 | $2.27 | 10d | 1 | 0.73mi |
| 576 Greystone Ln Unit C2 Wheeling, IL | 2.0 | 1.0 | 1200 | $2,400 | $2.00 | 12d | 1 | 0.81mi |
| 1168 Middlebury Ln Unit A1 Wheeling, IL | 3.0 | 2.0 | 1200 | $2,700 | $2.25 | 11d | 1 | 0.83mi |
| 1701 Johnson Dr Buffalo Grove, IL | 1.0–2.0 | 1.0–2.0 | 795 | $2,590 | $3.26 | 2d | 38 | 0.87mi |
| 146 W Inverrary Ln Unit 146 Deerfield, IL | 2.0 | 1.0 | 992 | $2,400 | $2.42 | 24d | 1 | 0.87mi |
| 146 W Inverrary Ln Unit 146 Deerfield, IL | 2.0 | 1.0 | 992 | $2,349 | $2.37 | 7d | 1 | 0.87mi |
| 450 Manda Ln Wheeling, IL | 1.0–2.0 | 1.0–2.0 | 806 | $1,962 | $2.43 | 1d | 38 | 1.01mi |
| 1160 Windbrooke Dr Unit 2 Buffalo Grove, IL | 1.0 | 1.0 | 800 | $1,950 | $2.44 | 24d | 1 | 1.02mi |
| 1160 Windbrooke Dr Buffalo Grove, IL | 1.0–2.0 | 1.0–2.0 | 891 | $2,560 | $2.87 | 3d | 12 | 1.06mi |
| 11 Marquette Pl Buffalo Grove, IL | 3.0 | 2.0 | 1330 | $2,950 | $2.22 | 1d | 1 | 1.08mi |
| 250 McHenry Rd Wheeling, IL | 1.0–3.0 | 1.0–2.0 | 1185 | $3,140 | $2.65 | 1d | 33 | 1.19mi |
| 112 White Branch Ct Buffalo Grove, IL | 3.0 | 2.0 | 1420 | $2,950 | $2.08 | 15d | 1 | 1.24mi |
| 164 White Branch Ct Buffalo Grove, IL | 3.0 | 2.0 | 1407 | $2,850 | $2.03 | 24d | 1 | 1.25mi |
| 164 White Branch Ct Buffalo Grove, IL | 3.0 | 2.0 | 1407 | $2,845 | $2.02 | 7d | 1 | 1.25mi |
| 202 E Fabish Dr Buffalo Grove, IL | 3.0 | 2.0 | 1407 | $3,100 | $2.20 | 4d | 1 | 1.25mi |
| 202 E Fabish Dr Unit 202 Buffalo Grove, IL | 3.0 | 2.0 | 1440 | $3,100 | $2.15 | 15d | 1 | 1.25mi |
| 200 Hudson Ct Wheeling, IL | 1.0–2.0 | 1.0–2.0 | 954 | $2,665 | $2.79 | 1d | 11 | 1.26mi |
| 1249 S Wellington Ct Unit 1249 Buffalo Grove, IL | 2.0 | 2.0 | 1206 | $2,575 | $2.14 | 3d | 1 | 1.31mi |
| 1242 S Wellington Ct Unit 1242 Buffalo Grove, IL | 2.0 | 2.0 | 1131 | $2,400 | $2.12 | 22d | 1 | 1.33mi |
| 444 Parkway Dr Lincolnshire, IL | 2.0 | 1.0–2.0 | 887 | $3,999 | $4.51 | 1d | 16 | 1.36mi |
| 255 N Buffalo Grove Rd Buffalo Grove, IL | 2.0 | 2.0 | 1150 | $1,675 | $1.46 | 24d | 1 | 1.37mi |
| 70 Buffalo Grove Rd Buffalo Grove, IL | 1.0–2.0 | 1.0–2.0 | 850 | $1,950 | $2.29 | 1d | 18 | 1.37mi |
| 143 Lawn Ct Buffalo Grove, IL | 2.0 | 2.0 | 1131 | $2,500 | $2.21 | 24d | 1 | 1.40mi |
| 500 W Dundee Rd Wheeling, IL | 2.0 | 1.0–2.0 | 1013 | $3,142 | $3.10 | 1d | 30 | 1.47mi |
HOA detail condo
- Monthly dues
- $304 · $3,648/yr
- Likely covers
- gas
- Assessments
- None detected in remarks — confirm with the listing agent.
Listing history 6 events
-
2026-06-18days on market $259,000 Active 6 DOM
-
2026-06-17days on market $259,000 Active 5 DOM
-
2026-06-16days on market $259,000 Active 4 DOM
-
2026-06-15days on market $259,000 Active 3 DOM
-
2026-06-13remarks 699-char remark
-
2026-06-13$259,000 Active 1 DOM
ⓘ Source: listings_history table (triggers on properties + properties_extension) + one-shot
backfill from property_details.listing_events for pre-trigger history.
Climate risk First Street
- Flood 1/10 Low FEMA zone X (unshaded) · 0% chance over 30 yrs
- Wildfire 1/10 Low
- Heat 3/10 Moderate 7 d/yr ≥99°F today · 14 d/yr by 30 yrs out
- Wind 2/10 Low
- Air quality 4/10 Moderate 4 unhealthy d/yr today · 5 by 30 yrs out
Nearby sold comps map
Loading sold comps map…
Walkable amenities ~0.75 mi
Loading nearby amenities…
Taxation est. · year 1
- Rental income
- $28,825
- − Mortgage interest
- −$14,508
- − Property taxes
- −$3,885
- − Insurance
- −$1,295
- − Repairs & maintenance
- −$2,306
- − Management
- −$2,306
- − HOA
- −$3,648
- − Depreciation
- −$7,535
- Taxable loss
- −$6,658
- Est. tax savings @ 24.0%
- +$1,598
- After-tax cash flow
- $-757/yr
For passive investors: Depreciation is non-cash, so a rental often shows a tax loss while cash-flowing — sheltering income. Rental losses are passive: they offset passive income freely, and up to $25,000/yr can offset ordinary (W-2) income if you actively participate and your MAGI is under $100k (phasing out to $0 by $150k); unused losses carry forward. On sale, claimed depreciation is recaptured at up to 25%, and gains may owe capital-gains tax (a 1031 exchange can defer both). Figures are a year-1 estimate at your 24.0% rate — not tax advice; consult a CPA.
Schools (NCES district)
- District
- Adlai E Stevenson Hsd 125
- NCES district ID
- 1732580
- Math proficiency
- 72% ▼ -4.00%
- Reading proficiency
- 73% ▼ -2.00%
- Median HH income
- $146,434
- Composite
- 70.66/100
- National rank
- #253
- State rank
- #3 of 620 in IL
Livability — Buffalo Grove
- Score
- 77/100
- State rank
- #163
- US rank
- #3025
Category grades
Schools grade is shown separately in the Schools card above.
Census & demographics
- County
- Lake County · 591,991 people
- City population
- 42,872
- Metro
- Chicago-Naperville-Elgin, IL-IN-WI
- Population (ZIP)
- 28,096
- Household income
- $183,125
- Rent vs Own
- Severe rent burden
- 450.0
Population outlook (Lake County) Hauer SSP2
- Today (2025)
- 700,217 people
- By 2030
- 693,290 · -1.0%
- By 2040
- 673,588 · -3.8%
- By 2050
- 643,556 · -8.1%
- By 2075
- 562,792 · -19.6%
- By 2100
- 457,715 · -34.6%
Race, ethnicity, and origin ACS 2023
- Neighborhood character
- Predominantly White (84%)
- Race & ethnicity
- White 84% Asian 8% Hispanic / Latino 5% Two or more races 3% Black 1%
- Common ancestry
- Romanian 11% Scotch-Irish 10% Italian 4%
- Foreign-born
- 14% · China, South Korea, Canada
- Languages at home
- 82% English-only · Russian/Polish/Slavic 6% Other Indo-European 3% Spanish 3%
Political lean MEDSL · Lake
- 2024 margin
- Strong D (+20.8) · D 59.7% · R 38.9% · Other 1.4%
- 2008→2024 swing
- +1.1pp toward D · 2008: 19.6pp · 2024: 20.8pp
- All cycles
- 2024: D+20.8 2020: D+24.1 2016: D+20.3 2012: D+8.1 2008: D+19.6
Not yet ingested
- Civics
- —
Market trends
- HPI YoY
- ▼ -318.91%
- Current HPI
- 184.8993
- Rent YoY
- —
- Metro
- Chicago-Naperville-Elgin, IL-IN-WI
- State GDP YoY
- ▲ 1.59%
- F500 in state
- 60
Industry mix (Fortune 500 HQ in IL)
| Industry | F500 HQs | Revenue |
|---|---|---|
| Insurance | 4 | $201B |
|
||
| Consumer Goods | 4 | $87B |
|
||
| Industrial Machinery | 3 | $64B |
|
||
| Healthcare | 2 | $55B |
|
||
| Retail / Pharmacy | 1 | $148B |
|
||
| Agriculture / Food | 1 | $86B |
|
||
Price history
+11672.7% since first listed21 events — show timeline
- 2026-06-12 Listed $259,000 MRED as Distributed by MLS Grid
- 2025-05-23 Rental Removed $2,200 MRED
- 2025-05-14 Listed for Rent $2,200 MRED
- 2025-04-12 Listing Removed — MRED as Distributed by MLS Grid
- 2025-04-12 Relisted — MRED as Distributed by MLS Grid
- 2025-04-11 Listing Removed — MRED as Distributed by MLS Grid
- 2025-04-10 Relisted — MRED as Distributed by MLS Grid
- 2025-03-26 Listing Removed — MRED as Distributed by MLS Grid
- 2025-03-26 Relisted — MRED as Distributed by MLS Grid
- 2025-03-20 Listing Removed — MRED as Distributed by MLS Grid
- 2025-01-17 Price Changed — MRED as Distributed by MLS Grid
- 2025-01-17 Listing Removed — MRED as Distributed by MLS Grid
- 2025-01-17 Listed — MRED as Distributed by MLS Grid
- 2024-11-18 Price Changed — MRED as Distributed by MLS Grid
- 2024-11-04 Listed — MRED as Distributed by MLS Grid
- 2021-04-26 Listing Removed — MRED as Distributed by MLS Grid
- 2021-02-05 Listed — MRED as Distributed by MLS Grid
- 2020-06-04 Listing Removed — MRED as Distributed by MLS Grid
- 2020-01-30 Listing Removed — MRED as Distributed by MLS Grid
- 2020-01-30 Listed — MRED as Distributed by MLS Grid
- 2019-11-16 Listed — MRED as Distributed by MLS Grid
Cash-flow waterfall
monthlySold comps — $/sqft
last 12 mo · ≤1 miLoading sold comps…