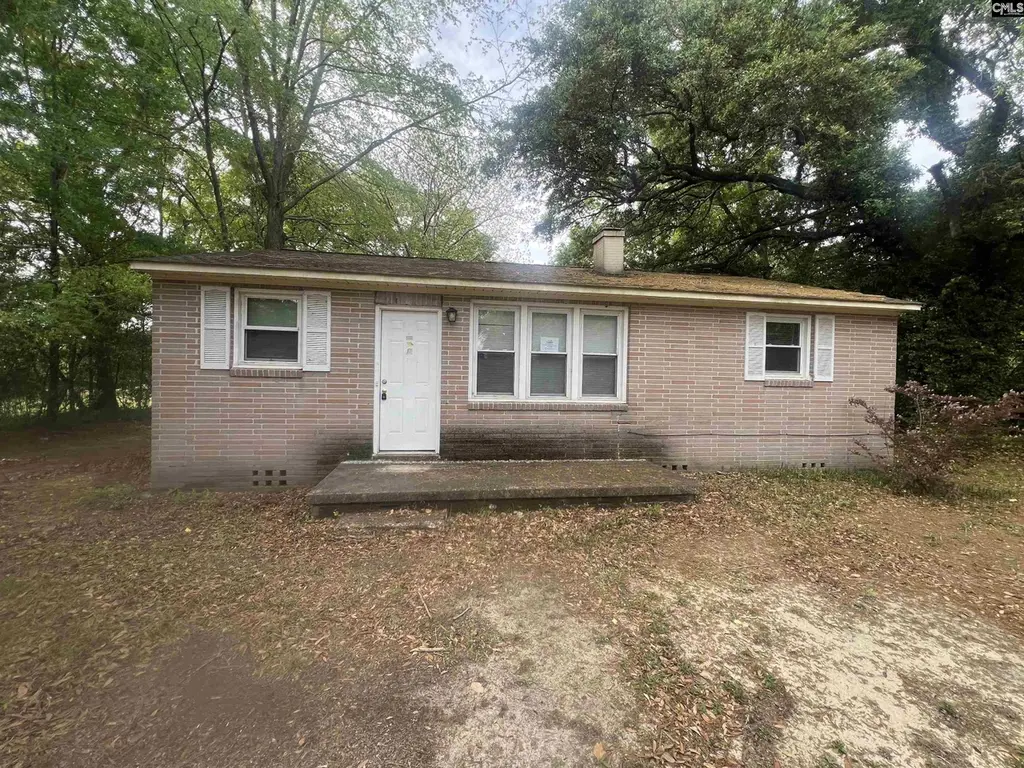
7626 Terry St · Capitol View, SC
Flood risk 1/10 · Minimal
- FEMA flood zone
- X (unshaded)
- Chance of flooding over 30 yrs
- 0.0%
- Est. flood insurance / yr
- $507 – $1,088
Fire risk 4/10 · Minor
- Est. fire insurance / yr
- $783 – $1,453
Heat risk 6/10 · Moderate
- Hot days now (above 108°F)
- 7 days/yr
- Hot days in 30 yrs
- 16 days/yr
Wind risk 7/10 · Major
- Chance of severe wind over 30 yrs
- 78.0%
Air-quality risk 3/10 · Minor
- Unhealthy air days now
- 2 days/yr
- Unhealthy air days in 30 yrs
- 2 days/yr
Risk factors via First Street. Map © Google.
Why this score? — see what drove the C grade
The composite is a weighted blend of 9 inputs, each scored 0–100. Each bar is that input's sub-score; the figure is the points it added to the 100-point composite (weight × sub-score).
- Cash flow +26.0/30.0
- DSCR +8.8/10.0
- ARV discount +7.5/15.0
- 1% rule +6.6/10.0
- Rent growth +3.0/5.0
- Schools +2.6/10.0
- Livability +2.5/5.0
- Condition / age +2.5/5.0
- Appreciation +0.0/10.0
$117,500
🖨 Deal sheet 📄 Offer letter ✓ Due diligence
Listing remarks
Charming all-brick one-story ranch offering comfort, functionality, and timeless appeal. This 3-bedroom, 1-bath home features a layout with a mix of durable and stylish flooring throughout. The living room welcomes you with beautiful hardwood floors, creating a warm and inviting space to relax or entertain. The kitchen is thoughtfully designed with granite countertops, ample cabinet storage, and low-maintenance LVP flooring, flowing seamlessly into the dining area—also finished with LVP for easy upkeep. All three bedrooms are comfortably sized and feature carpet for added warmth and comfort. Step outside to enjoy the rear deck, perfect for grilling, outdoor dining, or simply unwinding
Key facts
- All brick
- Storage shed
- Granite countertops
Tags
Property features AI
Finance
- Other:
- Financial info:
- HOA & community:
Exterior
- Parking:
- Security:
- Utilities: Public water; Public sewer
- Home design: Single-family property
- Construction: Crawlspace foundation
- Exterior features: Deck; Storage shed; Brick exterior above foundation; Paved road access
Interior
- Kitchen: Granite countertops; Painted cabinets; Luxury vinyl plank flooring
- Bedrooms: Master bedroom on the main level with private closet and carpeted floors; Second bedroom on the main level with private closet and carpeted floors; Third bedroom on the main level with private closet and carpeted floors
- Flooring: Carpet in bedrooms; Hardwood in living room; Luxury vinyl plank in dining room and kitchen
- Bathrooms: One full bathroom
- Heating & cooling: Central cooling; Electric heating
- Interior features: Hardwood floors in the living room; Luxury vinyl plank floors in the formal dining room and kitchen
- Laundry & utility: Electric hookup in kitchen area for laundry (washer/dryer on main level)
Neighborhood map
What this means for you Summary
Snapshot
- This is a 2-bed/2.0-bath single-family listed at $118k.
Deal economics
- At list price, monthly cash flow is $294 ($4k/yr) — positive.
- The deal already cash-flows at list — no discount required.
- Meets the 1% rule at list price ($1k rent vs $118k).
- Recommended offer: $110k (6.0% below list) — sets the bar for market timing.
Location & tenants
- Location reads: area grade C — affects rentability + tenant quality, not the cash-flow math above.
- Richland 01 (urban): math 26% / reading 36% proficiency, ranked #54 of 80 in SC (top 68%) — families likely to look elsewhere, expect single-tenant / working-renter base with shorter leases; 64% free/reduced lunch — lower-income household profile, screen leases tightly.
- Zoned schools: Mill Creek Elementary (math 22% / reading 22%, grade F, #475 of 597 statewide, top 81%, 339 students, 100% FRL); Lower Richland High (math 5% / reading 64%, grade F, #185 of 196 statewide, top 94%, 1,244 students, 100% FRL) — zoned schools average 100% FRL vs 64% district-wide (36 pts higher); higher-poverty schools than district average — tighter screening recommended.
- Market conditions: Rents rising (+2.1%/yr); 295 active listings in the ZIP; 14 comparable units currently listed for rent nearby; rentals at typical pace (median 15d on market — plan ~3-4 weeks tenant-placement turnaround); 3,472 units permitted in Richland County in 2024 (1,096 in 5+ unit buildings).
Forward outlook
- Local home prices are declining (-3.0%/yr); year-one equity from $812 of loan paydown is wiped out by about $4k of value loss. Plan a longer hold.
- Richland County population projected at +30% by 2050 — long-run rental-demand tailwind backs the buy-and-hold thesis.
Negotiation context
- It's been on market 67 days — a 6% lower offer ($110k) is reasonable based on typical stale-listing flexibility.
- 2 sale attempts since 3y ago; this cycle's ask has dropped $10k (8%) from the opening price — seller is motivated, your offer sets the floor, not the list.
Risks & watch-outs
- Watch-outs: built in 1957 — expect roof / HVAC / electrical / plumbing capex.
- Climate carrying-cost: major wind risk, 78% chance of damaging wind over 30y; extreme-heat days projected 7→16/yr by 2055 (HVAC capex compounding) — expect insurance premiums to compound above CPI over the hold.
Questions for the listing agent
- It's been on market 67 days. Have you received any prior offers? Is the seller open to a 6% concession, seller financing, or rate buy-down credit?
- Built in 1957 — when were the roof, HVAC, electrical panel, plumbing, and water heater last replaced?
- Why hasn't it sold? Are there any deal-killer items the seller is aware of (foundation, flood, title, zoning, code violations)?
- Is there a deadline driving the sale (1031 exchange, divorce, estate, relocation)? That informs how much negotiation room exists.
- What's the average days-on-market for RENTAL listings here right now (not sales)? A rising rental-DOM trend means longer vacancies and softer asking-rent achievability than the comps imply.
- What's the recent tenant-quality profile in this submarket — average credit score on applications, eviction rate, late-payment / NSF rate, and stable-employment percentage? A property-management company in the area should have these aggregated.
- How much new for-sale + rental construction is in the pipeline within 1–3 miles? Heavy new supply typically softens prices + rents 12–24 months out; constrained supply supports both.
Investment metrics
- 1% rule
- 1.16% ✓
- Cap rate
- 9.29%
- Cash-on-cash
- 10.71%
- DSCR
- 1.48
- GRM
- 7.2
CMA / ARV
No comps found within radius.
Projected returns pro-forma
-3.0% appreciation · 2.08% rent growth · sell at horizon
- IRR
- -1.3%
- Equity multiple
- 0.95×
- Total profit
- $-1,592
- Equity at exit
- $17,520
- IRR
- 7.4%
- Equity multiple
- 1.54×
- Total profit
- $17,667
- Equity at exit
- $10,159
Cash invested: $32,900 (down + closing). Projections, not guarantees.
Landlord ↔ Tenant lean methodology
- Overall (STATE)
- 90 Strongly Landlord-Friendly
- State South Carolina
- 90 Strongly Landlord-Friendly · R+6
- County
- — inherits STATE
- City
- — inherits STATE
ZIP-level market 29209
- Rents YoY
- 2.1%
- Active inventory
- 295
- Price-to-rent
- 7.2×
Monthly cashflow live
- Estimated rent
- $1,360 high interval (Pro) →
- Mortgage (P&I)
- −$616
- Tax from tax record
- −$116 /mo · $1,388/yr
- Insurance
- −$49
- HOA
- −$0
- Vacancy / Maint / Mgmt
- −$286
- Net cashflow
- $294
Break-even live
UW: 25.0% down · 7.5% · 30yr · 1.5% tax · 5.0% vac · 8.0% maint · 8.0% mgmt
Financing live
Cash to close
- Down payment
- $29,375
- Closing costs
- $3,525
- Reserves months
- —
- Total cash needed
- —
Loan-product check · same deal, 3 products live
Conventional
25% down · 7.5% · 30yr
- Down + closing
- —
- Monthly P&I
- —
- Monthly cashflow
- —
- DSCR
- —
- Eligible?
- —
Personal DTI + credit; lowest rate.
DSCR
20% down · 8.5% · 30yr
- Down + closing
- —
- Monthly P&I
- —
- Monthly cashflow
- —
- DSCR
- —
- Eligible?
- —
No personal income docs; deal must DSCR.
Hard money
10% down · 12.0% · 12mo
- Down + closing
- —
- Monthly P&I
- —
- Monthly cashflow
- —
- DSCR
- —
- Eligible?
- —
Short-term bridge; refi at stabilization.
Rent comps 14 comps
| Address | Beds | Baths | Sqft | Rent | $/sqft | DOM | Units | Dist |
|---|---|---|---|---|---|---|---|---|
| 1101 Hallbrook Dr Columbia, SC | 1.0–3.0 | 1.0–2.0 | 1050 | $1,079 | $1.03 | 14d | 1 | 0.18mi |
| 7712 Burdell Dr Columbia, SC | 3.0 | 1.0 | 1025 | $1,750 | $1.71 | 23d | 1 | 0.18mi |
| 164 Ashewood Commons Dr Columbia, SC | 2.0 | 2.0 | 1025 | $1,349 | $1.32 | 14d | 1 | 0.27mi |
| 7524 Marie St Columbia, SC | 3.0 | 1.0 | 1075 | $1,350 | $1.26 | 21d | 1 | 0.40mi |
| 7743 Garners Ferry Rd Columbia, SC | 1.0–3.0 | 1.0–2.5 | 1045 | $1,719 | $1.64 | 3d | 19 | 0.58mi |
| 3 Ashley's Pl Unit 04 Columbia, SC | 2.0 | 1.5 | 1100 | $995 | $0.90 | 23d | 1 | 0.59mi |
| 7648 Garners Ferry Rd Columbia, SC | 3.0 | 1.0–2.0 | 828 | $1,146 | $1.38 | 14d | 1 | 0.66mi |
| 150 Daphne Rd Columbia, SC | 3.0 | 2.0 | 1123 | $1,025 | $0.91 | 23d | 1 | 0.69mi |
| 7251 Patricia Dr Apt F Columbia, SC | 1.0 | 1.0 | 546 | $950 | $1.74 | 14d | 1 | 0.77mi |
| 7116 Tama Rd Columbia, SC | 3.0 | 1.0–1.5 | 600 | $1,100 | $1.83 | 23d | 1 | 1.01mi |
| 514 Spindrift Ln Columbia, SC | 2.0 | 1.0–1.5 | 1032 | $1,212 | $1.17 | 3d | 1 | 1.08mi |
| 1401 Elmtree Rd Apt B4 Columbia, SC | 2.0 | 2.0 | 1000 | $1,095 | $1.09 | 23d | 1 | 1.20mi |
| 1030 Atlas Rd Columbia, SC | 2.0 | 1.0 | 833 | $1,224 | $1.47 | 14d | 5 | 1.37mi |
| 600 Greenlawn Dr Columbia, SC | 1.0–3.0 | 1.0–2.0 | 1017 | $1,625 | $1.60 | 3d | 25 | 1.39mi |
Listing history 20 events
-
2026-06-18days on market $117,500 Active 67 DOM
-
2026-06-17days on market $117,500 Active 66 DOM
-
2026-06-16days on market $117,500 Active 65 DOM
-
2026-06-15days on market $117,500 Active 64 DOM
-
2026-06-14days on market $117,500 Active 62 DOM
-
2026-06-10days on market $117,500 Active 59 DOM
-
2026-06-09days on market $117,500 Active 58 DOM
-
2026-06-08days on market $117,500 Active 57 DOM
-
2026-06-07days on market $117,500 Active 56 DOM
-
2026-06-03days on market $117,500 Active 52 DOM
-
2026-06-03days on market $117,500 Active 51 DOM
-
2026-06-01days on market $117,500 Active 50 DOM
-
2026-05-31days on market $117,500 Active 49 DOM
-
2026-05-14price $117,500
-
2026-04-10$127,500 Active
-
2023-04-14soldstatus $150,000
-
2023-03-23price $145,000
-
2023-03-14$155,000 Active
-
2022-09-02soldstatus $65,000
-
2003-11-05soldstatus $52,000
ⓘ Source: listings_history table (triggers on properties + properties_extension) + one-shot
backfill from property_details.listing_events for pre-trigger history.
Tax reassessment forecast SC · Resets to sale price
- Current annual tax
- $1,388 · $116/mo
- Projected year-2 tax
- $1,388 · $116/mo
- Expected delta
- $0/yr ($0/mo · 0.0%)
ⓘ Screening estimate from a state-policy table — verify with the county assessor before closing.
Climate risk First Street
- Flood 1/10 Low FEMA zone X (unshaded) · 0% chance over 30 yrs
- Wildfire 4/10 Moderate
- Heat 6/10 Major 7 d/yr ≥108°F today · 16 d/yr by 30 yrs out
- Wind 7/10 Severe 78% chance of damaging wind over 30 yrs
- Air quality 3/10 Moderate 2 unhealthy d/yr today · 2 by 30 yrs out
Nearby sold comps map
Loading sold comps map…
Walkable amenities ~0.75 mi
Loading nearby amenities…
Taxation est. · year 1
- Rental income
- $16,319
- − Mortgage interest
- −$6,582
- − Property taxes
- −$1,388
- − Insurance
- −$588
- − Repairs & maintenance
- −$1,306
- − Management
- −$1,306
- − Depreciation
- −$3,418
- Taxable income
- $1,732
- Est. tax owed @ 24.0%
- −$416
- After-tax cash flow
- $3,106/yr
For passive investors: Depreciation is non-cash, so a rental often shows a tax loss while cash-flowing — sheltering income. Rental losses are passive: they offset passive income freely, and up to $25,000/yr can offset ordinary (W-2) income if you actively participate and your MAGI is under $100k (phasing out to $0 by $150k); unused losses carry forward. On sale, claimed depreciation is recaptured at up to 25%, and gains may owe capital-gains tax (a 1031 exchange can defer both). Figures are a year-1 estimate at your 24.0% rate — not tax advice; consult a CPA.
Schools (NCES district)
- District
- Richland 01
- NCES district ID
- 4503360
- Math proficiency
- 26% ▼ -7.00%
- Reading proficiency
- 36% ▼ -5.00%
- Median HH income
- $38,931
- Composite
- 25.94/100
- National rank
- #7335
- State rank
- #54 of 80 in SC
Livability — Capitol View
No livability data for this city. (Only ~50 U.S. cities are tracked.)
Census & demographics
- Census place
- Capitol View, SC
- County
- Richland County · 389,530 people
- Metro
- Columbia, SC
- Population (ZIP)
- 38,041
- Household income
- $58,772
- Rent vs Own
- Severe rent burden
- 1716.0
Population outlook (Richland County) Hauer SSP2
- Today (2025)
- 459,667 people
- By 2030
- 487,524 · +6.1%
- By 2040
- 542,035 · +17.9%
- By 2050
- 595,371 · +29.5%
- By 2075
- 732,998 · +59.5%
- By 2100
- 820,415 · +78.5%
Race, ethnicity, and origin ACS 2023
- Neighborhood character
- Diverse neighborhood (Simpson 0.62)
- Race & ethnicity
- Black 48% White 39% Two or more races 6% Hispanic / Latino 6% Asian 2%
- Hispanic origin (detail)
- Mexican 3% Puerto Rican 2%
- Common ancestry
- Slovak 2% Serbian 2% Italian 1%
- Foreign-born
- 6% · Canada, Jamaica
- Languages at home
- 93% English-only · Spanish 3% Arabic 1% Other Indo-European 1%
Political lean MEDSL · Richland
- 2024 margin
- Solid D (+34.6) · D 66.4% · R 31.8% · Other 1.8%
- 2008→2024 swing
- +5.7pp toward D · 2008: 28.9pp · 2024: 34.6pp
- All cycles
- 2024: D+34.6 2020: D+38.3 2016: D+32.9 2012: D+33.3 2008: D+28.9
Not yet ingested
- Civics
- —
Market trends
- HPI YoY
- ▼ -142.10%
- Current HPI
- 205.5679
- Rent YoY
- ▲ 2.08%
- Metro
- Columbia, SC
- State GDP YoY
- ▲ 4.51%
- F500 in state
- 2
Industry mix (Fortune 500 HQ in SC)
| Industry | F500 HQs | Revenue |
|---|---|---|
| Packaging | 1 | $7B |
|
||
Price history
+126.0% since first listed7 events — show timeline
- 2026-05-14 Price Changed $117,500 Consolidated MLS
- 2026-04-10 Listed $127,500 Consolidated MLS
- 2023-04-14 Sold (Public Records) $150,000 Public Records
- 2023-03-23 Price Changed $145,000 Consolidated MLS
- 2023-03-14 Listed $155,000 Consolidated MLS
- 2022-09-02 Sold (Public Records) $65,000 Public Records
- 2003-11-05 Sold (Public Records) $52,000 Public Records
Property tax history
-1.9%/yrLatest (2025): $1,388 · +4.3% YoY. Source: county tax records.
Cash-flow waterfall
monthlySold comps — $/sqft
last 12 mo · ≤1 miLoading sold comps…