 Triplex
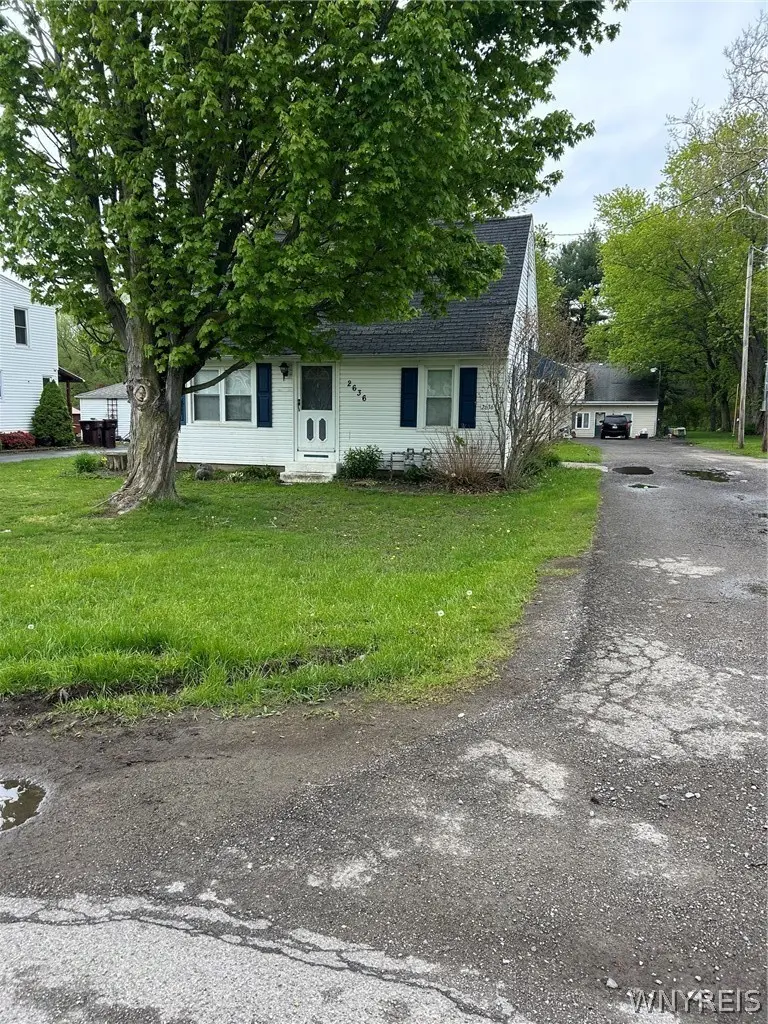
2636 Sunset Dr · Eden, NY
Flood risk 4/10 · Minor
- FEMA flood zone
- X (unshaded)
- Chance of flooding over 30 yrs
- 0.2%
- Est. flood insurance / yr
- $473 – $860
Fire risk 3/10 · Minor
- Est. fire insurance / yr
- $691 – $1,283
Heat risk 2/10 · Minimal
- Hot days now (above 93°F)
- 7 days/yr
- Hot days in 30 yrs
- 17 days/yr
Wind risk 1/10 · Minimal
- Chance of severe wind over 30 yrs
- —
Air-quality risk 2/10 · Minimal
- Unhealthy air days now
- 1 days/yr
- Unhealthy air days in 30 yrs
- 2 days/yr
Risk factors via First Street. Map © Google.
Why this score? — see what drove the C+ grade
The composite is a weighted blend of 9 inputs, each scored 0–100. Each bar is that input's sub-score; the figure is the points it added to the 100-point composite (weight × sub-score).
- Cash flow +23.7/30.0
- 1% rule +8.5/10.0
- DSCR +7.6/10.0
- ARV discount +7.5/15.0
- Schools +5.2/10.0
- Livability +4.2/5.0
- Rent growth +2.5/5.0
- Condition / age +2.5/5.0
- Appreciation +0.0/10.0
$209,900
🖨 Deal sheet 📄 Offer letter ✓ Due diligence
Multi-family units
County records classify this as Multi-Family (2-4 Unit). Listing-text estimate: 3 units. confirmed
Listing remarks
3 Unit, investor special in the heart of Eden! Live in the main house and rent out the two back units and have your mortgage paid for! The main home is a 3 bedroom 1 bath Cape Cod. The rear building is an upper lower two unit. Lower apartment, 2 beds, 2 baths (one under construction). Upper apartment is 1 bed, 1 bath. There is also a large workshop/garage. Offers reviewed as received. 24 hour notice required for showings. Showings allowed 12- 7 PM daily.
Key facts
- 0.51 acre lot
- 2 parking spots
- Built 1971
Property features AI
Finance
- Other: Three-unit multi-family building; Two separate electric meters; Two separate gas meters
- Financial info: Operating expense details provided in remarks
Exterior
- Parking: Paved parking with two or more spaces
- Utilities: Public water connected; Sewer connected; Cable available; High-speed internet available; Circuit breaker electrical
- Home design: Two-story property; Resale condition
- Construction: Vinyl siding; Wood siding; Copper plumbing; Asphalt roof
- Exterior features: Rectangular residential lot; City street frontage
Interior
- Flooring: Carpet; Laminate; Tile; Vinyl; Varied flooring
- Bathrooms: Four full bathrooms
- Heating & cooling: Gas forced-air heating
- Interior features: Ceiling fans
- Laundry & utility: Gas water heater
Neighborhood map
What this means for you Summary
Snapshot
- This is a 2×2bd/1.3ba + 1×1bd/1.3ba units multifamily listed at $210k.
Deal economics
- At list price, monthly cash flow is $401 ($5k/yr) — positive. Per door: $134/mo.
- The deal already cash-flows at list — no discount required.
- Meets the 1% rule at list price ($3k rent vs $210k).
- Recommended offer: $207k (1.5% below list) — sets the bar for market timing.
- Cap rate 8.6% vs local median 2.3% in Eden — top-decile yield for the area; either an underpriced asset or a hidden risk that comps aren't pricing in. Stress-test before assuming the spread holds.
Location & tenants
- Location reads 83/100 on livability (#62 in NY, #896 nationally) — a professional / high-income tenant draw. Strengths: employment A+, housing A+, health & safety A+; Watch: amenities F.
- Eden Central School District (rural): math 56% / reading 63% proficiency, ranked #226 of 590 in NY (top 38%) — acceptable for families but not a draw, mixed tenant base, ~2y average lease; only 14% free/reduced lunch — higher-income household profile.
- Market conditions: 36 active listings in the ZIP; 1,244 units permitted in Erie County in 2024 (563 in 5+ unit buildings).
Forward outlook
- Local home prices are declining (-3.0%/yr); year-one equity from $1k of loan paydown is wiped out by about $6k of value loss. Plan a longer hold.
Negotiation context
- It's been on market 29 days — a 2% lower offer ($207k) is reasonable based on typical stale-listing flexibility.
- Current owner paid $160k; 31% above their basis — modest negotiation headroom, anchor on the comps not their cost.
Risks & watch-outs
- Watch-outs: property tax is 3.8% of price.
Questions for the listing agent
- Can we see the unit-by-unit rent roll, current vacancy, and any below-market leases? What's the average tenancy length?
- What capital expenditures (roof, boiler, parking lot, exteriors) have been made in the last 5 years, and what's planned in the next 2?
- Built in 1971 — when were the roof, HVAC, electrical panel, plumbing, and water heater last replaced?
- Property tax is high relative to price — has the assessment been appealed recently, and will the sale trigger a re-assessment?
- Is there a deadline driving the sale (1031 exchange, divorce, estate, relocation)? That informs how much negotiation room exists.
- Schools are B-rated — typically a magnet for longer-tenancy family renters. What's the average tenant stay here, and is there a school-zone premium baked into asking?
- What's the average days-on-market for RENTAL listings here right now (not sales)? A rising rental-DOM trend means longer vacancies and softer asking-rent achievability than the comps imply.
- What's the recent tenant-quality profile in this submarket — average credit score on applications, eviction rate, late-payment / NSF rate, and stable-employment percentage? A property-management company in the area should have these aggregated.
- How much new apartment / multifamily construction is in the pipeline within 1–3 miles? Heavy new supply (>2% of stock underway) typically softens rents 12–24 months out; light construction supports rent growth.
Investment metrics
- 1% rule
- 1.35% ✓
- Cap rate
- 8.58%
- Cash-on-cash
- 8.18%
- DSCR
- 1.36
- GRM
- 6.2
CMA / ARV
No comps found within radius.
Projected returns pro-forma
-3.0% appreciation · 3.0% rent growth · sell at horizon
- IRR
- -3.7%
- Equity multiple
- 0.86×
- Total profit
- $-8,217
- Equity at exit
- $31,297
- IRR
- 6.1%
- Equity multiple
- 1.46×
- Total profit
- $26,854
- Equity at exit
- $18,148
Cash invested: $58,772 (down + closing). Projections, not guarantees.
Landlord ↔ Tenant lean methodology
- Overall (STATE)
- 15 Strongly Tenant-Friendly
- State New York
- 15 Strongly Tenant-Friendly · D+10
- County
- — inherits STATE
- City
- — inherits STATE
ZIP-level market 14057
- Home prices YoY
- -23.9%
- Active inventory
- 36
- Price-to-rent
- 17.9×
Monthly cashflow live
- Estimated rent
- $2,843 medium interval (Pro) →
- Mortgage (P&I)
- −$1,101
- Tax from tax record
- −$657 /mo · $7,887/yr
- Insurance
- −$87
- HOA
- −$0
- Vacancy / Maint / Mgmt
- −$597
- Net cashflow
- $401
Break-even live
3-unit breakdown (identical units grouped — click to expand)
| Units | Beds | Baths | Est. rent |
|---|---|---|---|
| 2× units | 2 | 1.3 | $1,952 |
| #1 | 2 | 1.3 | $976 |
| #2 | 2 | 1.3 | $976 |
| 1× unit | 1 | 1.3 | $892 |
| Total (3 units) | $2,843 | ||
UW: 25.0% down · 7.5% · 30yr · 1.5% tax · 5.0% vac · 8.0% maint · 8.0% mgmt
Financing live
Cash to close
- Down payment
- $52,475
- Closing costs
- $6,297
- Reserves months
- —
- Total cash needed
- —
Loan-product check · same deal, 3 products live
Conventional
25% down · 7.5% · 30yr
- Down + closing
- —
- Monthly P&I
- —
- Monthly cashflow
- —
- DSCR
- —
- Eligible?
- —
Personal DTI + credit; lowest rate.
DSCR
20% down · 8.5% · 30yr
- Down + closing
- —
- Monthly P&I
- —
- Monthly cashflow
- —
- DSCR
- —
- Eligible?
- —
No personal income docs; deal must DSCR.
Hard money
10% down · 12.0% · 12mo
- Down + closing
- —
- Monthly P&I
- —
- Monthly cashflow
- —
- DSCR
- —
- Eligible?
- —
Short-term bridge; refi at stabilization.
Listing history 16 events
-
2026-06-18days on market $209,900 Active 29 DOM
-
2026-06-17days on market $209,900 Active 28 DOM
-
2026-06-16days on market $209,900 Active 27 DOM
-
2026-06-15days on market $209,900 Active 26 DOM
-
2026-06-13days on market $209,900 Active 24 DOM
-
2026-06-10days on market $209,900 Active 21 DOM
-
2026-06-09days on market $209,900 Active 20 DOM
-
2026-06-08days on market $209,900 Active 19 DOM
-
2026-06-07days on market $209,900 Active 18 DOM
-
2026-06-05days on market $209,900 Active 15 DOM
-
2026-06-03days on market $209,900 Active 14 DOM
-
2026-06-02days on market $209,900 Active 13 DOM
-
2026-06-01days on market $209,900 Active 12 DOM
-
2026-05-31days on market $209,900 Active 11 DOM
-
2026-05-20$209,900 Active
-
2010-03-17soldstatus $160,000
ⓘ Source: listings_history table (triggers on properties + properties_extension) + one-shot
backfill from property_details.listing_events for pre-trigger history.
Tax reassessment forecast NY · Partial reset (capped growth)
- Current annual tax
- $7,887 · $657/mo
- Projected year-2 tax
- $7,887 · $657/mo
- Expected delta
- $0/yr ($0/mo · 0.0%)
ⓘ Screening estimate from a state-policy table — verify with the county assessor before closing.
Climate risk First Street
- Flood 4/10 Moderate FEMA zone X (unshaded) · 20% chance over 30 yrs
- Wildfire 3/10 Moderate
- Heat 2/10 Low 7 d/yr ≥93°F today · 17 d/yr by 30 yrs out
- Wind 1/10 Low
- Air quality 2/10 Low 1 unhealthy d/yr today · 2 by 30 yrs out
Nearby sold comps map
Loading sold comps map…
Walkable amenities ~0.75 mi
Loading nearby amenities…
Taxation est. · year 1
- Rental income
- $34,116
- − Mortgage interest
- −$11,758
- − Property taxes
- −$7,887
- − Insurance
- −$1,050
- − Repairs & maintenance
- −$2,729
- − Management
- −$2,729
- − Depreciation
- −$6,106
- Taxable income
- $1,857
- Est. tax owed @ 24.0%
- −$446
- After-tax cash flow
- $4,361/yr
For passive investors: Depreciation is non-cash, so a rental often shows a tax loss while cash-flowing — sheltering income. Rental losses are passive: they offset passive income freely, and up to $25,000/yr can offset ordinary (W-2) income if you actively participate and your MAGI is under $100k (phasing out to $0 by $150k); unused losses carry forward. On sale, claimed depreciation is recaptured at up to 25%, and gains may owe capital-gains tax (a 1031 exchange can defer both). Figures are a year-1 estimate at your 24.0% rate — not tax advice; consult a CPA.
Schools (NCES district)
- District
- Eden Central School District
- NCES district ID
- 3610170
- Math proficiency
- 56% ▼ -9.00%
- Reading proficiency
- 63% ▼ -3.00%
- Median HH income
- $64,812
- Composite
- 52.05/100
- National rank
- #1631
- State rank
- #226 of 590 in NY
Livability — Eden
- Score
- 83/100
- State rank
- #62
- US rank
- #896
Category grades
Schools grade is shown separately in the Schools card above.
Census & demographics
- Census place
- Eden, NY
- Population (ZIP)
- 7,632
Population outlook (Erie County) Hauer SSP2
- Today (2025)
- 933,037 people
- By 2030
- 935,181 · +0.2%
- By 2040
- 928,531 · -0.5%
- By 2050
- 905,725 · -2.9%
- By 2075
- 834,037 · -10.6%
- By 2100
- 708,033 · -24.1%
Race, ethnicity, and origin ACS 2023
- Neighborhood character
- Predominantly White (94%)
- Race & ethnicity
- White 94% Hispanic / Latino 2% Black 1% Two or more races 1%
- Common ancestry
- Romanian 18% Lithuanian 1% Danish 1%
- Foreign-born
- 3% · Canada
- Languages at home
- 95% English-only · Spanish 2% Russian/Polish/Slavic 1% French/Haitian/Cajun 1%
Political lean MEDSL · Erie
- 2024 margin
- Lean D (+9.7) · D 54.8% · R 45.2%
- 2008→2024 swing
- -7.9pp toward R · 2008: 17.5pp · 2024: 9.7pp
- All cycles
- 2024: D+9.7 2020: D+14.7 2016: D+4.8 2012: D+15.6 2008: D+17.5
Not yet ingested
- Civics
- —
Market trends
- HPI YoY
- ▼ -99.08%
- Current HPI
- 315.2681
- Rent YoY
- —
- Metro
- —
- State GDP YoY
- ▲ 2.60%
- F500 in state
- 92
Industry mix (Fortune 500 HQ in NY)
| Industry | F500 HQs | Revenue |
|---|---|---|
| Financial Services | 10 | $950B |
|
||
| Consumer Goods | 9 | $162B |
|
||
| Insurance | 4 | $225B |
|
||
| Telecommunications | 2 | $144B |
|
||
| Pharmaceuticals | 2 | $112B |
|
||
| Media / Entertainment | 2 | $69B |
|
||
Price history
+31.2% since first listed2 events — show timeline
- 2026-05-20 Listed $209,900 WNYREIS
- 2010-03-17 Sold (Public Records) $160,000 Public Records
Property tax history
+1.7%/yrLatest (2025): $7,887 · +0.5% YoY. Source: county tax records.
Cash-flow waterfall
monthlySold comps — $/sqft
last 12 mo · ≤1 miLoading sold comps…