 Multi-family
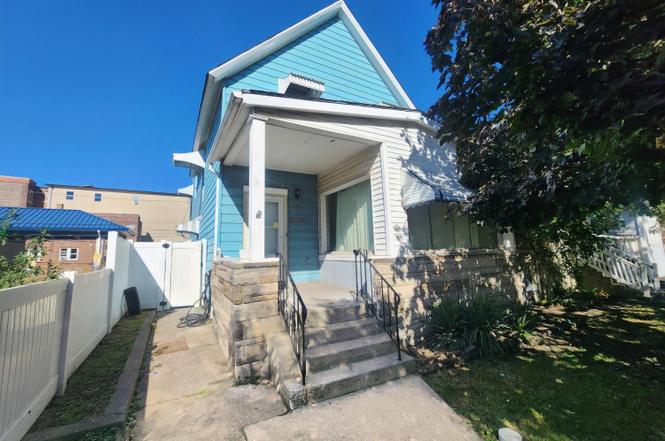
716 W 145th St · East Chicago, IN
Flood risk 6/10 · Moderate
- FEMA flood zone
- X (unshaded)
- Chance of flooding over 30 yrs
- 0.73%
- Est. flood insurance / yr
- $473 – $860
Fire risk 1/10 · Minimal
- Est. fire insurance / yr
- $717 – $1,331
Heat risk 3/10 · Minor
- Hot days now (above 101°F)
- 7 days/yr
- Hot days in 30 yrs
- 15 days/yr
Wind risk 2/10 · Minimal
- Chance of severe wind over 30 yrs
- 1.0%
Air-quality risk 4/10 · Minor
- Unhealthy air days now
- 5 days/yr
- Unhealthy air days in 30 yrs
- 6 days/yr
Risk factors via First Street. Map © Google.
Why this score? — see what drove the B- grade
The composite is a weighted blend of 9 inputs, each scored 0–100. Each bar is that input's sub-score; the figure is the points it added to the 100-point composite (weight × sub-score).
- Cash flow +23.5/30.0
- ARV discount +13.8/15.0
- DSCR +7.5/10.0
- 1% rule +5.8/10.0
- Appreciation +4.8/10.0
- Rent growth +4.5/5.0
- Livability +3.2/5.0
- Condition / age +2.5/5.0
- Schools +0.8/10.0
$124,900
🖨 Deal sheet (PDF) 📄 Offer letter ✓ Due diligence
Multi-family units
County records classify this as Multi-Family (2-4 Unit). Listing-text estimate: 1 unit. estimate disagrees with records
Listing remarks MLS
Welcome to this lovely two story home! The main level features a cozy kitchen with large pantry that spills into a spacious dining area. The rec/den area is adjacent to dining room and has a convenient 1/2 bath. The homey living room boasts a gas fireplace that adjoins to a cheery sunroom that not only extends the living area, but is ideal for plant lovers! The second level has four bedrooms (one of which has small kitchen with separate entrance). The upstairs closets/cabinets storage space seems endless! The large main bath is conveniently located for all. The private PVC fenced yard yields a concrete patio with perenial blooming flowers! Most rooms include remote controlled lighted ceiling fans. Unfinished basement provides tremendous amount of storage space! Updated electrical and new central air!! Come and take a look!
Key facts
- Working furnace
- Brand new a/c
- Brick fireplace
Tags
Property features AI
Finance
- Other: Occupant status: Vacant
Exterior
- Parking: Detached parking; Off-street parking; Detached 2-car garage
- Utilities: Public water; Public sewer
- Home design: Two-story home; Built in 1920
- Construction: Vinyl siding; Has foundation (basement)
- Exterior features: Private yard; Deck; Front porch; Neighborhood and park/greenbelt views; Garage(s) on property
Interior
- Kitchen: No appliances included
- Bedrooms: Primary bedroom; Four additional bedrooms (total 5 bedrooms); Bedrooms located across main and upper levels
- Bathrooms: 1 full bathroom; 1 half bathroom
- Heating & cooling: Forced air heating; Central air conditioning
- Interior features: Entrance foyer; Open floorplan; In-law floorplan; Living room fireplace; Has basement (interior entry, unfinished); 9 total rooms
- Laundry & utility: Basement utility area
Neighborhood map
What this means for you Summary
Snapshot
- This is a 3-bed/1.5-bath multifamily listed at $125k.
Deal economics
- At list price, monthly cash flow is $232 ($3k/yr) — positive.
- The deal already cash-flows at list — no discount required.
- Meets the 1% rule at list price ($1k rent vs $125k).
- Recommended offer: $110k (12.0% below list) — sets the bar for market timing.
Location & tenants
- Location reads 64/100 on livability (#371 in IN) — a middle-class / working-renter tenant base. Strengths: commute A+, cost of living A+, housing A; Watch: health & safety D+, crime F, amenities F.
- School City Of East Chicago (suburban): math 7% / reading 15% proficiency, ranked #293 of 301 in IN (top 97%) — low school quality limits family demand, transient renter base, plan for 1-2y turnover; 89% free/reduced lunch — lower-income household profile, screen leases tightly.
- Zoned schools: Benjamin Harrison Elementary Sch (math 4% / reading 5%, grade F, #983 of 994 statewide, top 99%, 396 students, 82% FRL); Joseph Block Middle School (math 3% / reading 13%, grade F, #317 of 330 statewide, top 96%, 487 students, 82% FRL); East Chicago Central High School (math 23% / reading 56%, grade F, #221 of 369 statewide, top 63%, 1,079 students, 77% FRL).
- Market conditions: Rents rising fast (+8.1%/yr); 79 active listings in the ZIP; lower-income renter base — watch delinquency; 1,642 units permitted in Lake County in 2024 (14 in 5+ unit buildings).
- This rent runs 39% of the median local income ($42k/yr) — at the standard rent-burdened threshold; future hikes will face affordability resistance.
Forward outlook
- In year one you build about $485 of equity ($864 loan paydown + $-379 appreciation (-0.3% local appreciation)).
- Lake County population projected to shrink 7% by 2050 — rents likely to lag national; underwrite the cash flow, not the appreciation.
- At projected returns (-0.3% appreciation + 8.0% rent growth), your $35k cash investment doubles in ~6 years — after that, you're playing with house money.
Negotiation context
- It's been on market 248 days — a 12% lower offer ($110k) is reasonable based on typical stale-listing flexibility.
- 3 sale attempts since 13y ago; this cycle's ask has dropped $15k (11%) from the opening price — seller is motivated, your offer sets the floor, not the list.
- Current owner paid $30k; list at $125k implies a 316% gain — meaningful room to come down on a strong offer.
Risks & watch-outs
- Watch-outs: built in 1920 — expect roof / HVAC / electrical / plumbing capex.
- Climate carrying-cost: major flood risk — expect insurance premiums to compound above CPI over the hold.
Questions for the listing agent
- It's been on market 248 days. Have you received any prior offers? Is the seller open to a 12% concession, seller financing, or rate buy-down credit?
- Built in 1920 — when were the roof, HVAC, electrical panel, plumbing, and water heater last replaced?
- Why hasn't it sold? Are there any deal-killer items the seller is aware of (foundation, flood, title, zoning, code violations)?
- Is there a deadline driving the sale (1031 exchange, divorce, estate, relocation)? That informs how much negotiation room exists.
- Schools are F-rated, which usually means shorter tenancies and higher turnover. Who's the typical renter profile here, and what's been the actual vacancy rate?
- Crime grade is F in this area — have there been break-ins, vandalism, or insurance claims at this property in the last 3 years? What carrier currently insures it and at what premium?
- What's the average days-on-market for RENTAL listings here right now (not sales)? A rising rental-DOM trend means longer vacancies and softer asking-rent achievability than the comps imply.
- What's the recent tenant-quality profile in this submarket — average credit score on applications, eviction rate, late-payment / NSF rate, and stable-employment percentage? A property-management company in the area should have these aggregated.
- How much new apartment / multifamily construction is in the pipeline within 1–3 miles? Heavy new supply (>2% of stock underway) typically softens rents 12–24 months out; light construction supports rent growth.
Investment metrics
- 1% rule
- 1.08% ✓
- Cap rate
- 8.52%
- Cash-on-cash
- 7.97%
- DSCR
- 1.35
- GRM
- 7.7
CMA / ARV
- ARV (on-the-fly)
- $145,336
- Comps found
- 2
Show comp detail 2 sales within ~0.75 mi
| Address | Dist | Beds/Ba | Sqft | Sold | Price | $/sf | Match |
|---|---|---|---|---|---|---|---|
| 519 W 144th St | 0.19mi | 3/2.0 | 2,160 (+10%) | 12mo | $90,000 | $42 | 63 |
| 517 W Columbus Dr | 0.49mi | 3/2.0 | 1,904 (-3%) | 14mo | $140,000 | $74 | 58 |
Match score weights: distance 35% · size 25% · config 20% · recency 20%. Top-matched comps best support the ARV.
Projected returns pro-forma
-0.3% appreciation · 8.0% rent growth · sell at horizon
- IRR
- 9.7%
- Equity multiple
- 1.47×
- Total profit
- $16,510
- Equity at exit
- $34,383
- IRR
- 18.3%
- Equity multiple
- 3.30×
- Total profit
- $80,361
- Equity at exit
- $39,855
Cash invested: $34,972 (down + closing). Projections, not guarantees.
Landlord ↔ Tenant lean methodology
- Overall (STATE)
- 90 Strongly Landlord-Friendly
- State Indiana
- 90 Strongly Landlord-Friendly · R+11
- County
- — inherits STATE
- City
- — inherits STATE
ZIP-level market 46312
- Home prices YoY
- -0.1%
- Rents YoY
- 8.1%
- Active inventory
- 79
- Price-to-rent
- 7.7×
Monthly cashflow live
- Estimated rent
- $1,352 medium interval (Pro) →
- Mortgage (P&I)
- −$655
- Tax from tax record
- −$129 /mo · $1,546/yr
- Insurance
- −$52
- HOA
- −$0
- Vacancy / Maint / Mgmt
- −$284
- Net cashflow
- $232
Break-even live
Sensitivity live
| Price | -10% $303 | -5% $268 | +0% $232 | +5% $197 | +10% $161 |
|---|---|---|---|---|---|
| Rent | -10% $125 | -5% $179 | +0% $232 | +5% $286 | +10% $339 |
| Rate | -1.0pp $295 | -0.5pp $264 | base $232 | +0.5pp $200 | +1.0pp $167 |
UW: 25.0% down · 7.5% · 30yr · 1.5% tax · 5.0% vac · 8.0% maint · 8.0% mgmt
Financing live
Cash to close
- Down payment
- $31,225
- Closing costs
- $3,747
- Reserves months
- —
- Total cash needed
- —
Loan-product check · same deal, 3 products live
Conventional
25% down · 7.5% · 30yr
- Down + closing
- —
- Monthly P&I
- —
- Monthly cashflow
- —
- DSCR
- —
- Eligible?
- —
Personal DTI + credit; lowest rate.
DSCR
20% down · 8.5% · 30yr
- Down + closing
- —
- Monthly P&I
- —
- Monthly cashflow
- —
- DSCR
- —
- Eligible?
- —
No personal income docs; deal must DSCR.
Hard money
10% down · 12.0% · 12mo
- Down + closing
- —
- Monthly P&I
- —
- Monthly cashflow
- —
- DSCR
- —
- Eligible?
- —
Short-term bridge; refi at stabilization.
Listing history 23 events
-
2026-06-21days on market $124,900 Active 248 DOM
-
2026-06-18days on market $124,900 Active 245 DOM
-
2026-06-17days on market $124,900 Active 244 DOM
-
2026-06-16days on market $124,900 Active 243 DOM
-
2026-06-15pricedays on market $124,900 Active 242 DOM
-
2026-06-13days on market $127,900 Active 240 DOM
-
2026-06-13days on market $127,900 Active 239 DOM
-
2026-06-09days on market $127,900 Active 236 DOM
-
2026-06-08days on market $127,900 Active 235 DOM
-
2026-06-07days on market $127,900 Active 234 DOM
-
2026-06-04days on market $127,900 Active 231 DOM
-
2026-06-03days on market $127,900 Active 230 DOM
-
2026-06-02days on market $127,900 Active 229 DOM
-
2026-06-01days on market $127,900 Active 228 DOM
-
2026-05-31days on market $127,900 Active 227 DOM
-
2026-05-08status Active
-
2026-05-04status Pending
-
2026-04-22price $127,900
-
2025-12-19price $129,900
-
2025-11-07price $134,900
-
2025-10-12$139,900 Active
-
2013-09-06soldstatus $30,000 834-char remark
Show marketing remark (834 chars)
Welcome to this lovely two story home! The main level features a cozy kitchen with large pantry that spills into a spacious dining area. The rec/den area is adjacent to dining room and has a convenient 1/2 bath. The homey living room boasts a gas fireplace that adjoins to a cheery sunroom that not only extends the living area, but is ideal for plant lovers! The second level has four bedrooms (one of which has small kitchen with separate entrance). The upstairs closets/cabinets storage space seems endless! The large main bath is conveniently located for all. The private PVC fenced yard yields a concrete patio with perenial blooming flowers! Most rooms include remote controlled lighted ceiling fans. Unfinished basement provides tremendous amount of storage space! Updated electrical and new central air!! Come and take a look!
-
2013-04-22$49,500 834-char remark
Show marketing remark (834 chars)
Welcome to this lovely two story home! The main level features a cozy kitchen with large pantry that spills into a spacious dining area. The rec/den area is adjacent to dining room and has a convenient 1/2 bath. The homey living room boasts a gas fireplace that adjoins to a cheery sunroom that not only extends the living area, but is ideal for plant lovers! The second level has four bedrooms (one of which has small kitchen with separate entrance). The upstairs closets/cabinets storage space seems endless! The large main bath is conveniently located for all. The private PVC fenced yard yields a concrete patio with perenial blooming flowers! Most rooms include remote controlled lighted ceiling fans. Unfinished basement provides tremendous amount of storage space! Updated electrical and new central air!! Come and take a look!
ⓘ Source: listings_history table (triggers on properties + properties_extension) + one-shot
backfill from property_details.listing_events for pre-trigger history.
Tax reassessment forecast IN · Partial reset (capped growth)
- Current annual tax
- $1,546 · $129/mo
- Projected year-2 tax
- $1,546 · $129/mo
- Expected delta
- $0/yr ($0/mo · 0.0%)
ⓘ Screening estimate from a state-policy table — verify with the county assessor before closing.
Climate risk First Street
- Flood 6/10 Major FEMA zone X (unshaded) · 73% chance over 30 yrs
- Wildfire 1/10 Low
- Heat 3/10 Moderate 7 d/yr ≥101°F today · 15 d/yr by 30 yrs out
- Wind 2/10 Low 100% chance of damaging wind over 30 yrs
- Air quality 4/10 Moderate 5 unhealthy d/yr today · 6 by 30 yrs out
Nearby sold comps map
Loading sold comps map…
Walkable amenities ~0.75 mi
Loading nearby amenities…
Taxation est. · year 1
- Rental income
- $16,223
- − Mortgage interest
- −$6,996
- − Property taxes
- −$1,546
- − Insurance
- −$624
- − Repairs & maintenance
- −$1,298
- − Management
- −$1,298
- − Depreciation
- −$3,633
- Taxable income
- $827
- Est. tax owed @ 24.0%
- −$198
- After-tax cash flow
- $2,587/yr
For passive investors: Depreciation is non-cash, so a rental often shows a tax loss while cash-flowing — sheltering income. Rental losses are passive: they offset passive income freely, and up to $25,000/yr can offset ordinary (W-2) income if you actively participate and your MAGI is under $100k (phasing out to $0 by $150k); unused losses carry forward. On sale, claimed depreciation is recaptured at up to 25%, and gains may owe capital-gains tax (a 1031 exchange can defer both). Figures are a year-1 estimate at your 24.0% rate — not tax advice; consult a CPA.
Schools (NCES district)
- District
- School City Of East Chicago
- NCES district ID
- 1802880
- Math proficiency
- 7% ▼ -10.00%
- Reading proficiency
- 15% ▼ -7.00%
- Median HH income
- $28,423
- Composite
- 8.36/100
- National rank
- #9909
- State rank
- #293 of 301 in IN
Livability — East Chicago
- Score
- 64/100
- State rank
- #371
- US rank
- #13869
Category grades
Schools grade is shown separately in the Schools card above.
Census & demographics
- Census place
- East Chicago, IN
- County
- Lake County · 422,878 people
- City population
- 26,022
- Metro
- Chicago-Naperville-Elgin, IL-IN-WI
- Population (ZIP)
- 26,022
- Household income
- $42,125
- Rent vs Own
- Severe rent burden
- 1227.0
Population outlook (Lake County) Hauer SSP2
- Today (2025)
- 484,026 people
- By 2030
- 478,091 · -1.2%
- By 2040
- 462,974 · -4.3%
- By 2050
- 449,894 · -7.1%
- By 2075
- 436,169 · -9.9%
- By 2100
- 426,607 · -11.9%
Race, ethnicity, and origin ACS 2023
- Neighborhood character
- Majority Hispanic (56%)
- Race & ethnicity
- Hispanic / Latino 56% Black 36% Two or more races 11% White 7%
- Hispanic origin (detail)
- Mexican 45% Puerto Rican 6%
- Common ancestry
- Romanian 2%
- Foreign-born
- 16% · Canada
- Languages at home
- 59% English-only · Spanish 40%
Political lean MEDSL · Lake
- 2024 margin
- Lean D (+5.6) · D 52.1% · R 46.5% · Other 1.5%
- 2008→2024 swing
- -28.6pp toward R · 2008: 34.3pp · 2024: 5.6pp
- All cycles
- 2024: D+5.6 2020: D+15.1 2016: D+20.6 2012: D+31.0 2008: D+34.3
Not yet ingested
- Civics
- —
Market trends
- HPI YoY
- ▼ -0.30%
- Current HPI
- 267.9232
- Rent YoY
- ▲ 8.06%
- Metro
- Chicago-Naperville-Elgin, IL-IN-WI
- State GDP YoY
- ▲ 2.90%
- F500 in state
- 18
Industry mix (Fortune 500 HQ in IN)
| Industry | F500 HQs | Revenue |
|---|---|---|
| Industrial Machinery | 2 | $37B |
|
||
| Healthcare | 1 | $177B |
|
||
| Pharmaceuticals | 1 | $45B |
|
||
| Metals / Steel | 1 | $18B |
|
||
| Agriculture | 1 | $17B |
|
||
| Packaging | 1 | $12B |
|
||
Price history
+158.4% since first listed8 events — show timeline
- 2026-05-08 Relisted — NIRA MLS as Distributed by MLS Grid
- 2026-05-04 Pending — NIRA MLS as Distributed by MLS Grid
- 2026-04-22 Price Changed $127,900 NIRA MLS as Distributed by MLS Grid
- 2025-12-19 Price Changed $129,900 NIRA MLS as Distributed by MLS Grid
- 2025-11-07 Price Changed $134,900 NIRA MLS as Distributed by MLS Grid
- 2025-10-12 Listed $139,900 NIRA MLS as Distributed by MLS Grid
- 2013-09-06 Sold (MLS) $30,000 NIRA MLS as Distributed by MLS Grid
- 2013-04-22 Listed $49,500 NIRA MLS as Distributed by MLS Grid
Property tax history
+23.1%/yrLatest (2024): $1,546 · +8.9% YoY. Source: county tax records.
Cash-flow waterfall
monthlySold comps — $/sqft
last 12 mo · ≤1 miLoading sold comps…