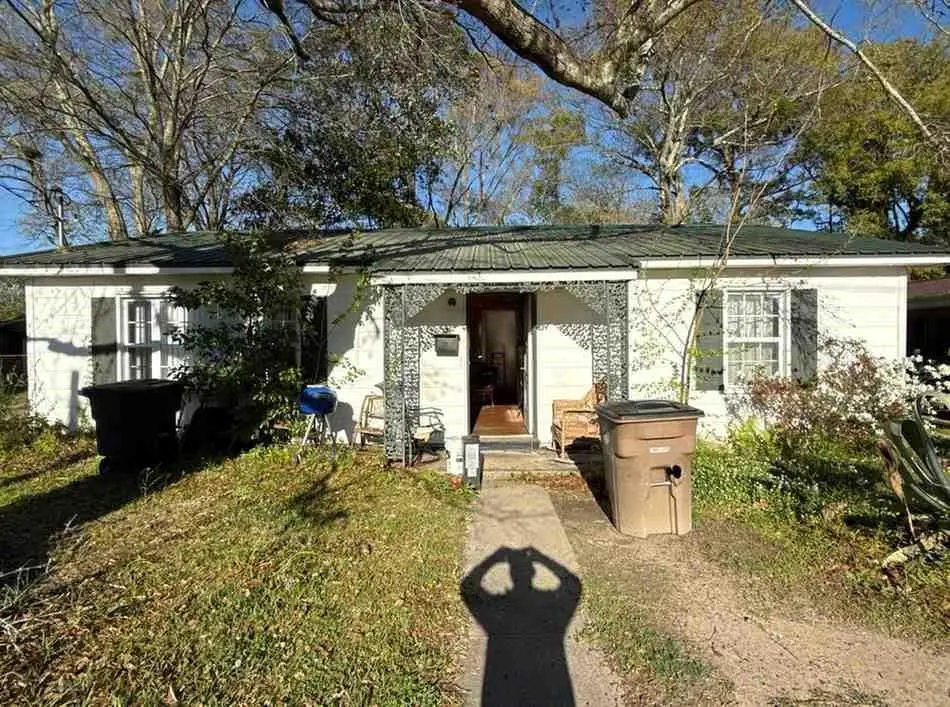
1014 Barbara Dr E · Mobile, AL
Flood risk 1/10 · Minimal
- FEMA flood zone
- X (unshaded)
- Chance of flooding over 30 yrs
- 0.0%
- Est. flood insurance / yr
- $507 – $1,088
Fire risk 1/10 · Minimal
- Est. fire insurance / yr
- $916 – $1,700
Heat risk 9/10 · Severe
- Hot days now (above 104°F)
- 7 days/yr
- Hot days in 30 yrs
- 21 days/yr
Wind risk 9/10 · Severe
- Chance of severe wind over 30 yrs
- 99.0%
Air-quality risk 2/10 · Minimal
- Unhealthy air days now
- 1 days/yr
- Unhealthy air days in 30 yrs
- 1 days/yr
Risk factors via First Street. Map © Google.
Why this score? — see what drove the A- grade
The composite is a weighted blend of 9 inputs, each scored 0–100. Each bar is that input's sub-score; the figure is the points it added to the 100-point composite (weight × sub-score).
- Cash flow +30.0/30.0
- ARV discount +15.0/15.0
- 1% rule +10.0/10.0
- DSCR +10.0/10.0
- Appreciation +7.4/10.0
- Livability +3.8/5.0
- Rent growth +2.5/5.0
- Condition / age +2.5/5.0
- Schools +2.3/10.0
$39,900
🖨 Deal sheet (PDF) 📄 Offer letter ✓ Due diligence
Listing remarks
Great opportunity for investors! This charming 3-bedroom, 1-bath home offers approximately 1,040 sq ft of living space and is priced to move. With a little TLC, this property has strong potential as a profitable rental or flip. The home features a durable metal roof and a functional layout, making it a solid foundation for your next project. While it does need some rehab, it’s competitively priced to reflect the updates needed—leaving plenty of room for value-add and a strong return on investment. Whether you’re looking to expand your rental portfolio or secure your next quick-turn project, this property is full of potential. Don’t miss out on this affordable investm
Key facts
- Metal roof
- Functional layout
- 8,276 sq ft lot
Tags
Property features AI
Finance
- Other: Property located in the Jewel Downs subdivision; Land is not leasehold; Property has a view
Exterior
- Parking: Driveway; 1 parking space
- Utilities: Public sewer; No electric provider listed; No additional utilities listed
- Home design: Single Family Residence; Residential property
- Construction: Built in 1986; Asbestos and frame construction; Metal roof; Slab foundation
- Exterior features: No notable exterior features listed; No fencing
Interior
- Kitchen: Other kitchen features
- Bedrooms: 3 bedrooms
- Flooring: Hardwood floors
- Bathrooms: 1 full bathroom
- Heating & cooling: No central heating; Window unit(s) for cooling
- Interior features: Fireplace in family room; Other built-in interior features
Neighborhood map
What this means for you Summary
Snapshot
- This is a 3-bed/1.0-bath single-family listed at $40k.
Deal economics
- At list price, monthly cash flow is $634 ($8k/yr) — positive.
- The deal already cash-flows at list — no discount required.
- Meets the 1% rule at list price ($1k rent vs $40k).
- Cap rate 25.4% vs local median 4.9% in Mobile — top-decile yield for the area; either an underpriced asset or a hidden risk that comps aren't pricing in. Stress-test before assuming the spread holds.
Location & tenants
- Location reads 75/100 on livability (#20 in AL, #4,262 nationally) — a middle-class / working-renter tenant base. Strengths: commute A+, cost of living A+, housing A+; Watch: crime F, employment D-.
- Mobile County (urban): math 15% / reading 39% proficiency, ranked #81 of 129 in AL (top 63%) — low school quality limits family demand, transient renter base, plan for 1-2y turnover; 67% free/reduced lunch — lower-income household profile, screen leases tightly.
- Zoned schools: Grant Elementary School (math 8% / reading 22%, grade F, #508 of 627 statewide, top 84%, 236 students, 98% FRL); Booker T Washington Middle School (math 0% / reading 12%, grade F, #252 of 257 statewide, top 98%, 340 students, 95% FRL); John L Leflore Magnet School (math 2% / reading 2%, grade F, #291 of 305 statewide, top 100%, 618 students, 84% FRL) — zoned schools average 92% FRL vs 67% district-wide (25 pts higher); higher-poverty schools than district average — tighter screening recommended.
- Zoned-school proficiency averages 8% at this address vs 27% district-wide (-19 pts) — the specific schools serving this property underperform the Mobile County average; the district grade overstates school quality for this exact location.
- Market conditions: 40 active listings in the ZIP; 8 comparable units currently listed for rent nearby; rentals at typical pace (median 23d on market — plan ~3-4 weeks tenant-placement turnaround); 1,678 units permitted in Mobile County in 2024 (264 in 5+ unit buildings).
Forward outlook
- In year one you build about $2k of equity ($276 loan paydown + $2k appreciation (4.8% local appreciation)).
- Mobile County population projected to shrink 8% by 2050 — rents likely to lag national; underwrite the cash flow, not the appreciation.
- At projected returns (4.8% appreciation + 3.0% rent growth), your $11k cash investment doubles in ~2 years — after that, you're playing with house money.
Negotiation context
- Only 6 days on market — expect competitive offers; lowballing is unlikely to land.
- 2 sale attempts with the ask held roughly flat each time — persistent listings suggest the price (not the market) is what's stuck; bring a comps-based counter.
- Current owner paid $25k; list at $40k implies a 60% gain — meaningful room to come down on a strong offer.
Risks & watch-outs
- Climate carrying-cost: severe wind risk, 99% chance of damaging wind over 30y; extreme-heat days projected 7→21/yr by 2055 (HVAC capex compounding) — expect insurance premiums to compound above CPI over the hold.
Questions for the listing agent
- Is there a deadline driving the sale (1031 exchange, divorce, estate, relocation)? That informs how much negotiation room exists.
- Schools are D-rated, which usually means shorter tenancies and higher turnover. Who's the typical renter profile here, and what's been the actual vacancy rate?
- Crime grade is F in this area — have there been break-ins, vandalism, or insurance claims at this property in the last 3 years? What carrier currently insures it and at what premium?
- What's the average days-on-market for RENTAL listings here right now (not sales)? A rising rental-DOM trend means longer vacancies and softer asking-rent achievability than the comps imply.
- What's the recent tenant-quality profile in this submarket — average credit score on applications, eviction rate, late-payment / NSF rate, and stable-employment percentage? A property-management company in the area should have these aggregated.
- How much new for-sale + rental construction is in the pipeline within 1–3 miles? Heavy new supply typically softens prices + rents 12–24 months out; constrained supply supports both.
Investment metrics
- 1% rule
- 2.86% ✓
- Cap rate
- 25.37%
- Cash-on-cash
- 68.14%
- DSCR
- 4.03
- GRM
- 2.9
CMA / ARV
- ARV (on-the-fly)
- $53,040
- Comps found
- 12
Show comp detail 12 sales within ~0.75 mi
| Address | Dist | Beds/Ba | Sqft | Sold | Price | $/sf | Match |
|---|---|---|---|---|---|---|---|
| 1014 Barbara Dr E | 0.00mi | 3/1.0 | 1,040 (0%) | 1mo | $25,000 | $24 | 99 |
| 1007 Barbara Dr | 0.04mi | 3/1.0 | 1,166 (+12%) | 3mo | $60,000 | $51 | 75 |
| 1823 Idell St | 0.15mi | 3/2.0 | 1,080 (+4%) | 14mo | $148,000 | $137 | 70 |
| 2435 St Stephens Rd | 0.37mi | 3/1.0 | 1,172 (+13%) | 0mo | $107,999 | $92 | 61 |
| 2409 Elsevier St | 0.71mi | 3/1.5 | 1,032 (-1%) | 4mo | $115,000 | $111 | 60 |
| 759 Wellington St | 0.45mi | 3/1.0 | 1,044 (+0%) | 22mo | $89,900 | $86 | 60 |
| 2502 Dubose St | 0.52mi | 3/1.0 | 1,025 (-1%) | 21mo | $50,000 | $49 | 56 |
| 2203 Rosa Dr | 0.50mi | 3/1.0 | 1,171 (+13%) | 0mo | $160,500 | $137 | 55 |
| 515 Gilbert St | 0.51mi | 3/1.0 | 1,154 (+11%) | 3mo | $10,000 | $9 | 55 |
| 818 Carleton Ave | 0.49mi | 2/1.0 (-1) | 900 (-14%) | 7mo | $17,000 | $19 | 44 |
| 439 Zieman | 0.67mi | 3/1.0 | 888 (-15%) | 17mo | $26,000 | $29 | 30 |
| 1815 Toulmin Ave | 0.71mi | 3/1.5 | 890 (-14%) | 15mo | $19,500 | $22 | 28 |
Match score weights: distance 35% · size 25% · config 20% · recency 20%. Top-matched comps best support the ARV.
Projected returns pro-forma
4.78% appreciation · 3.0% rent growth · sell at horizon
- IRR
- 74.4%
- Equity multiple
- 5.40×
- Total profit
- $49,105
- Equity at exit
- $22,072
- IRR
- 72.6%
- Equity multiple
- 11.19×
- Total profit
- $113,792
- Equity at exit
- $37,655
Cash invested: $11,172 (down + closing). Projections, not guarantees.
Landlord ↔ Tenant lean methodology
- Overall (STATE)
- 90 Strongly Landlord-Friendly
- State Alabama
- 90 Strongly Landlord-Friendly · R+15
- County
- — inherits STATE
- City
- — inherits STATE
ZIP-level market 36617
- Home prices YoY
- 3.9%
- Active inventory
- 40
- Price-to-rent
- 2.9×
Monthly cashflow live
- Estimated rent
- $1,143 high interval (Pro) →
- Mortgage (P&I)
- −$209
- Tax from tax record
- −$43 /mo · $512/yr
- Insurance
- −$17
- HOA
- −$0
- Vacancy / Maint / Mgmt
- −$240
- Net cashflow
- $634
Break-even live
Sensitivity live
| Price | -10% $657 | -5% $646 | +0% $634 | +5% $623 | +10% $612 |
|---|---|---|---|---|---|
| Rent | -10% $544 | -5% $589 | +0% $634 | +5% $679 | +10% $725 |
| Rate | -1.0pp $654 | -0.5pp $644 | base $634 | +0.5pp $624 | +1.0pp $613 |
UW: 25.0% down · 7.5% · 30yr · 1.5% tax · 5.0% vac · 8.0% maint · 8.0% mgmt
Financing live
Cash to close
- Down payment
- $9,975
- Closing costs
- $1,197
- Reserves months
- —
- Total cash needed
- —
Loan-product check · same deal, 3 products live
Conventional
25% down · 7.5% · 30yr
- Down + closing
- —
- Monthly P&I
- —
- Monthly cashflow
- —
- DSCR
- —
- Eligible?
- —
Personal DTI + credit; lowest rate.
DSCR
20% down · 8.5% · 30yr
- Down + closing
- —
- Monthly P&I
- —
- Monthly cashflow
- —
- DSCR
- —
- Eligible?
- —
No personal income docs; deal must DSCR.
Hard money
10% down · 12.0% · 12mo
- Down + closing
- —
- Monthly P&I
- —
- Monthly cashflow
- —
- DSCR
- —
- Eligible?
- —
Short-term bridge; refi at stabilization.
Rent comps 8 comps
| Address | Beds | Baths | Sqft | Rent | $/sqft | DOM | Units | Dist |
|---|---|---|---|---|---|---|---|---|
| 672 Burden St Mobile, AL | 3.0 | 1.5 | 1421 | $1,300 | $0.91 | 23d | 1 | 1.13mi |
| 708 Bond St Mobile, AL | 3.0 | 1.0 | 1100 | $1,350 | $1.23 | 23d | 1 | 1.13mi |
| 2966 Northwest Dr Mobile, AL | 3.0 | 1.0 | 792 | $895 | $1.13 | 23d | 1 | 1.20mi |
| 510 Schwartz St Mobile, AL | 3.0 | 2.0 | 1288 | $1,400 | $1.09 | 15d | 1 | 1.25mi |
| 38 Flock Ave Mobile, AL | 2.0 | 1.0 | 849 | $795 | $0.94 | 45d | 1 | 1.37mi |
| 423 Devon Dr Mobile, AL | 3.0 | 1.0 | 1220 | $950 | $0.78 | 45d | 1 | 1.39mi |
| 2853 Josephine St Mobile, AL | 2.0 | 1.0 | 780 | $975 | $1.25 | 23d | 1 | 1.44mi |
| 402 Havens St Mobile, AL | 4.0 | 2.0 | 960 | $1,350 | $1.41 | 15d | 1 | 1.48mi |
Listing history 3 events
-
2026-05-20status Active
-
2026-04-24status Pending
-
2026-04-20$39,900 Active
ⓘ Source: listings_history table (triggers on properties + properties_extension) + one-shot
backfill from property_details.listing_events for pre-trigger history.
Tax reassessment forecast AL · Resets to sale price
- Current annual tax
- $512 · $43/mo
- Projected year-2 tax
- $512 · $43/mo
- Expected delta
- $0/yr ($0/mo · 0.0%)
ⓘ Screening estimate from a state-policy table — verify with the county assessor before closing.
Climate risk First Street
- Flood 1/10 Low FEMA zone X (unshaded) · 0% chance over 30 yrs
- Wildfire 1/10 Low
- Heat 9/10 Extreme 7 d/yr ≥104°F today · 21 d/yr by 30 yrs out
- Wind 9/10 Extreme 99% chance of damaging wind over 30 yrs
- Air quality 2/10 Low 1 unhealthy d/yr today · 1 by 30 yrs out
Nearby sold comps map
Loading sold comps map…
Walkable amenities ~0.75 mi
Loading nearby amenities…
Taxation est. · year 1
- Rental income
- $13,714
- − Mortgage interest
- −$2,235
- − Property taxes
- −$512
- − Insurance
- −$200
- − Repairs & maintenance
- −$1,097
- − Management
- −$1,097
- − Depreciation
- −$1,161
- Taxable income
- $7,413
- Est. tax owed @ 24.0%
- −$1,779
- After-tax cash flow
- $5,833/yr
For passive investors: Depreciation is non-cash, so a rental often shows a tax loss while cash-flowing — sheltering income. Rental losses are passive: they offset passive income freely, and up to $25,000/yr can offset ordinary (W-2) income if you actively participate and your MAGI is under $100k (phasing out to $0 by $150k); unused losses carry forward. On sale, claimed depreciation is recaptured at up to 25%, and gains may owe capital-gains tax (a 1031 exchange can defer both). Figures are a year-1 estimate at your 24.0% rate — not tax advice; consult a CPA.
Schools (NCES district)
- District
- Mobile County
- NCES district ID
- 0102370
- Math proficiency
- 15% ▼ -28.00%
- Reading proficiency
- 39% ▬ 0.00%
- Median HH income
- $42,455
- Composite
- 22.9/100
- National rank
- #8002
- State rank
- #81 of 129 in AL
Livability — Mobile
- Score
- 75/100
- State rank
- #20
- US rank
- #4262
Category grades
Schools grade is shown separately in the Schools card above.
Census & demographics
- Census place
- Mobile, AL
- City population
- 205,729
- Population (ZIP)
- 11,952
Population outlook (Mobile County) Hauer SSP2
- Today (2025)
- 415,303 people
- By 2030
- 411,755 · -0.9%
- By 2040
- 399,670 · -3.8%
- By 2050
- 382,616 · -7.9%
- By 2075
- 337,353 · -18.8%
- By 2100
- 283,391 · -31.8%
Race, ethnicity, and origin ACS 2023
- Neighborhood character
- Predominantly Black (97%)
- Race & ethnicity
- Black 97% White 2%
- Foreign-born
- 0%
Political lean MEDSL · Mobile
- 2024 margin
- R (+16.4) · D 41.3% · R 57.7%
- 2008→2024 swing
- -7.7pp toward R · 2008: -8.7pp · 2024: -16.4pp
- All cycles
- 2024: R+16.4 2020: R+11.9 2016: R+13.9 2012: R+9.3 2008: R+8.7
Not yet ingested
- Civics
- —
Market trends
- HPI YoY
- ▲ 4.78%
- Current HPI
- 128.8377
- Rent YoY
- —
- Metro
- —
- State GDP YoY
- ▲ 2.94%
- F500 in state
- 4
Industry mix (Fortune 500 HQ in AL)
| Industry | F500 HQs | Revenue |
|---|---|---|
| Financial Services | 1 | $8B |
|
||
| Healthcare | 1 | $5B |
|
||
Price history
-37.3% since first listed5 events — show timeline
- 2026-06-02 Sold (MLS) $25,000 GCMLS AL
- 2026-05-22 Pending — GCMLS AL
- 2026-05-20 Relisted — GCMLS AL
- 2026-04-24 Pending — GCMLS AL
- 2026-04-20 Listed $39,900 GCMLS AL
Property tax history
+11.1%/yrLatest (2025): $512 · +0.0% YoY. Source: county tax records.
Cash-flow waterfall
monthlySold comps — $/sqft
last 12 mo · ≤1 miLoading sold comps…