 78-Plex
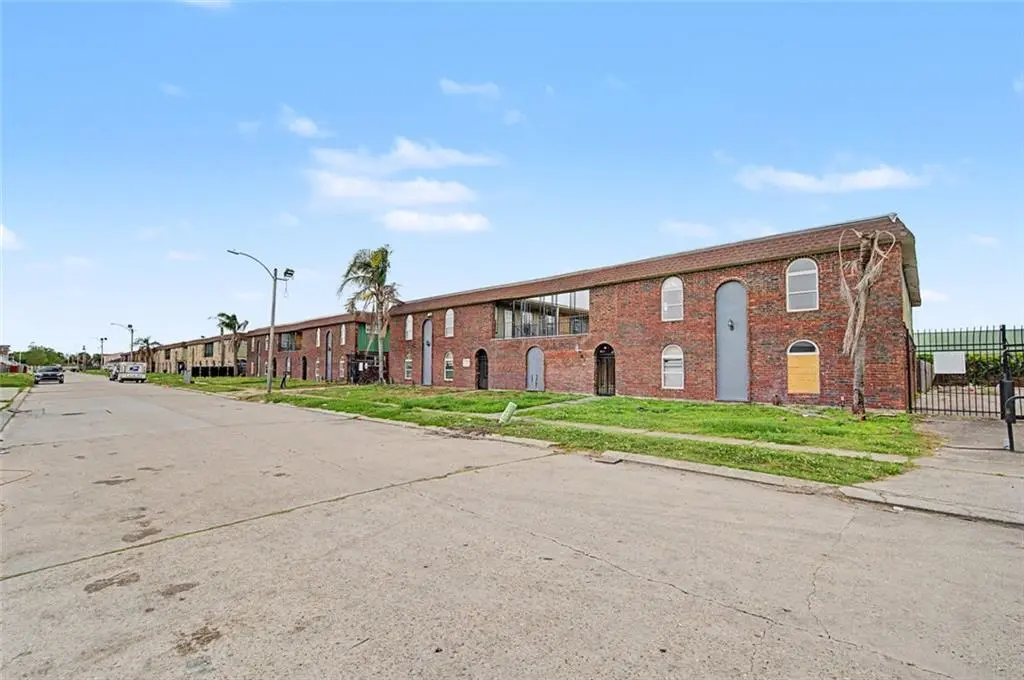
6711-6817 Tara Ln · New Orleans, LA
Flood risk 9/10 · Severe
- FEMA flood zone
- X (shaded)
- Chance of flooding over 30 yrs
- 0.6%
- Est. flood insurance / yr
- $507 – $1,088
Fire risk 1/10 · Minimal
- Est. fire insurance / yr
- $1,269 – $2,357
Heat risk 10/10 · Severe
- Hot days now (above 107°F)
- 7 days/yr
- Hot days in 30 yrs
- 21 days/yr
Wind risk 10/10 · Severe
- Chance of severe wind over 30 yrs
- 99.0%
Air-quality risk 3/10 · Minor
- Unhealthy air days now
- 3 days/yr
- Unhealthy air days in 30 yrs
- 3 days/yr
Risk factors via First Street. Map © Google.
Why this score? — see what drove the D grade
The composite is a weighted blend of 9 inputs, each scored 0–100. Each bar is that input's sub-score; the figure is the points it added to the 100-point composite (weight × sub-score).
- Cash flow +15.0/30.0
- ARV discount +7.5/15.0
- 1% rule +5.0/10.0
- DSCR +5.0/10.0
- Livability +4.0/5.0
- Rent growth +2.5/5.0
- Condition / age +2.5/5.0
- Schools +1.6/10.0
- Appreciation +0.0/10.0
$1,200,000
🖨 Deal sheet 📄 Offer letter ✓ Due diligence
Multi-family units
County records classify this as Multi-Family (5+ Unit). Listing-text estimate: 78 units. confirmed
5+ unit building — per-unit beds/baths from public records are typically unavailable; the breakdown below (if shown) is an estimate from the listing text.
Listing remarks MLS
Plaza Park Apartments is a 78-unit, Class C multifamily community offered at $1,200,000 -- representing one of the most compelling deep-value-add acquisition opportunities currently available in the greater New Orleans market. Situated on 2.77 acres in the West Lake Forest submarket of New Orleans East, the property comprises approximately 98,710 gross square feet with 76,100 rentable square feet across a mix of one-, two-, and three-bedroom units. The site is zoned S-RM2 (Suburban Multifamily) and is not located within a designated FEMA flood zone. Originally constructed in 1986, the asset has experienced significant deferred maintenance following foreclosure and is priced accordingly -- at just $15,385 per unit and $12.16 per gross square foot. For experienced value-add operators and distressed asset investors, the rehabilitation path is well-defined: estimated total CapEx of $3,950,000 yields a projected After-Repair Value of approximately $5,125,000, a stabilized NOI of $614,400, and an equity creation potential of nearly $4,000,000. A stabilization timeline of 18 to 24 months post-acquisition is considered reasonable.
Key facts
- Built 1986
- Listed 24 days
Neighborhood map
What this means for you Summary
Snapshot
- This is a 78 × 1-bed/1-bath units multifamily listed at $1.20M.
Deal economics
- At list price, monthly cash flow is $58k ($700k/yr) — positive. Per door: $748/mo.
- The deal already cash-flows at list — no discount required.
- Meets the 1% rule at list price ($83k rent vs $1.20M).
- Recommended offer: $1.18M (1.5% below list) — sets the bar for market timing.
- Cap rate 64.7% vs local median 4.4% in New Orleans — top-decile yield for the area; either an underpriced asset or a hidden risk that comps aren't pricing in. Stress-test before assuming the spread holds.
Location & tenants
- Location reads 81/100 on livability (#3 in LA, #1,383 nationally) — a professional / high-income tenant draw. Strengths: amenities A+, commute A+, health & safety A+; Watch: crime C-, employment D.
- Orleans Parish (urban): math 11% / reading 27% proficiency, ranked #69 of 98 in LA (top 70%) — low school quality limits family demand, transient renter base, plan for 1-2y turnover; 68% free/reduced lunch — lower-income household profile, screen leases tightly.
- Market conditions: 128 active listings in the ZIP; lower-income renter base — watch delinquency; 710 units permitted in Orleans Parish in 2024 (244 in 5+ unit buildings).
- At $83,451/mo this rent would consume 2457% of the median local household income ($41k/yr) (locally 2030% of renters already pay >50% of income on rent) — very limited rent-growth headroom before tenants either downsize or default.
Forward outlook
- Local home prices are declining (-3.0%/yr); year-one equity from $8k of loan paydown is wiped out by about $36k of value loss. Plan a longer hold.
- Orleans County population projected at +61% by 2050 — long-run rental-demand tailwind backs the buy-and-hold thesis.
- At projected returns (-3.0% appreciation + 3.0% rent growth), your $336k cash investment doubles in ~1 year — after that, you're playing with house money.
Negotiation context
- It's been on market 24 days — a 2% lower offer ($1.18M) is reasonable based on typical stale-listing flexibility.
- 2 sale attempts with the ask held roughly flat each time — persistent listings suggest the price (not the market) is what's stuck; bring a comps-based counter.
Risks & watch-outs
- Watch-outs: flood insurance adds $66/mo.
- Climate carrying-cost: severe flood risk; severe wind risk, 99% chance of damaging wind over 30y; extreme-heat days projected 7→21/yr by 2055 (HVAC capex compounding) — expect insurance premiums to compound above CPI over the hold.
Questions for the listing agent
- Can we see the unit-by-unit rent roll, current vacancy, and any below-market leases? What's the average tenancy length?
- What capital expenditures (roof, boiler, parking lot, exteriors) have been made in the last 5 years, and what's planned in the next 2?
- What's the actual annual flood-insurance premium (NFIP or private), and is the property in a SFHA with mandatory coverage?
- Is there a deadline driving the sale (1031 exchange, divorce, estate, relocation)? That informs how much negotiation room exists.
- The area grade is low — what's the realistic commute time and amenity access for the typical tenant pool here? Any planned neighborhood developments (good or bad) we should know about?
- What's the average days-on-market for RENTAL listings here right now (not sales)? A rising rental-DOM trend means longer vacancies and softer asking-rent achievability than the comps imply.
- What's the recent tenant-quality profile in this submarket — average credit score on applications, eviction rate, late-payment / NSF rate, and stable-employment percentage? A property-management company in the area should have these aggregated.
- How much new apartment / multifamily construction is in the pipeline within 1–3 miles? Heavy new supply (>2% of stock underway) typically softens rents 12–24 months out; light construction supports rent growth.
Investment metrics
- 1% rule
- 6.95% ✓
- Cap rate
- 64.70%
- Cash-on-cash
- 208.61%
- DSCR
- 10.28
- GRM
- 1.2
CMA / ARV
No comps found within radius.
Projected returns pro-forma
-3.0% appreciation · 3.0% rent growth · sell at horizon
- IRR
- —
- Equity multiple
- 11.48×
- Total profit
- $3,522,324
- Equity at exit
- $178,924
- IRR
- —
- Equity multiple
- 24.38×
- Total profit
- $7,855,402
- Equity at exit
- $103,754
Cash invested: $336,000 (down + closing). Projections, not guarantees.
Landlord ↔ Tenant lean methodology
- Overall (STATE)
- 90 Strongly Landlord-Friendly
- State Louisiana
- 90 Strongly Landlord-Friendly · R+12
- County
- — inherits STATE
- City
- — inherits STATE
ZIP-level market 70127
- Home prices YoY
- -29.2%
- Active inventory
- 128
- Price-to-rent
- 93.5×
Monthly cashflow live
- Estimated rent
- $83,451 high interval (Pro) →
- Mortgage (P&I)
- −$6,293
- Tax from tax record
- −$723 /mo · $8,676/yr
- Insurance
- −$500
- Flood insurance flood zone
- −$66 /mo · $798/yr
- HOA
- −$0
- Vacancy / Maint / Mgmt
- −$17,525
- Net cashflow
- $58,344
Break-even live
78-unit breakdown (identical units grouped — click to expand)
| Units | Beds | Baths | Est. rent |
|---|---|---|---|
| 78× units | 1 | 1 | $83,460 |
| #1 | 1 | 1 | $1,070 |
| #2 | 1 | 1 | $1,070 |
| #3 | 1 | 1 | $1,070 |
| #4 | 1 | 1 | $1,070 |
| #5 | 1 | 1 | $1,070 |
| #6 | 1 | 1 | $1,070 |
| #7 | 1 | 1 | $1,070 |
| #8 | 1 | 1 | $1,070 |
| #9 | 1 | 1 | $1,070 |
| #10 | 1 | 1 | $1,070 |
| #11 | 1 | 1 | $1,070 |
| #12 | 1 | 1 | $1,070 |
| #13 | 1 | 1 | $1,070 |
| #14 | 1 | 1 | $1,070 |
| #15 | 1 | 1 | $1,070 |
| #16 | 1 | 1 | $1,070 |
| #17 | 1 | 1 | $1,070 |
| #18 | 1 | 1 | $1,070 |
| #19 | 1 | 1 | $1,070 |
| #20 | 1 | 1 | $1,070 |
| #21 | 1 | 1 | $1,070 |
| #22 | 1 | 1 | $1,070 |
| #23 | 1 | 1 | $1,070 |
| #24 | 1 | 1 | $1,070 |
| #25 | 1 | 1 | $1,070 |
| #26 | 1 | 1 | $1,070 |
| #27 | 1 | 1 | $1,070 |
| #28 | 1 | 1 | $1,070 |
| #29 | 1 | 1 | $1,070 |
| #30 | 1 | 1 | $1,070 |
| #31 | 1 | 1 | $1,070 |
| #32 | 1 | 1 | $1,070 |
| #33 | 1 | 1 | $1,070 |
| #34 | 1 | 1 | $1,070 |
| #35 | 1 | 1 | $1,070 |
| #36 | 1 | 1 | $1,070 |
| #37 | 1 | 1 | $1,070 |
| #38 | 1 | 1 | $1,070 |
| #39 | 1 | 1 | $1,070 |
| #40 | 1 | 1 | $1,070 |
| #41 | 1 | 1 | $1,070 |
| #42 | 1 | 1 | $1,070 |
| #43 | 1 | 1 | $1,070 |
| #44 | 1 | 1 | $1,070 |
| #45 | 1 | 1 | $1,070 |
| #46 | 1 | 1 | $1,070 |
| #47 | 1 | 1 | $1,070 |
| #48 | 1 | 1 | $1,070 |
| #49 | 1 | 1 | $1,070 |
| #50 | 1 | 1 | $1,070 |
| #51 | 1 | 1 | $1,070 |
| #52 | 1 | 1 | $1,070 |
| #53 | 1 | 1 | $1,070 |
| #54 | 1 | 1 | $1,070 |
| #55 | 1 | 1 | $1,070 |
| #56 | 1 | 1 | $1,070 |
| #57 | 1 | 1 | $1,070 |
| #58 | 1 | 1 | $1,070 |
| #59 | 1 | 1 | $1,070 |
| #60 | 1 | 1 | $1,070 |
| #61 | 1 | 1 | $1,070 |
| #62 | 1 | 1 | $1,070 |
| #63 | 1 | 1 | $1,070 |
| #64 | 1 | 1 | $1,070 |
| #65 | 1 | 1 | $1,070 |
| #66 | 1 | 1 | $1,070 |
| #67 | 1 | 1 | $1,070 |
| #68 | 1 | 1 | $1,070 |
| #69 | 1 | 1 | $1,070 |
| #70 | 1 | 1 | $1,070 |
| #71 | 1 | 1 | $1,070 |
| #72 | 1 | 1 | $1,070 |
| #73 | 1 | 1 | $1,070 |
| #74 | 1 | 1 | $1,070 |
| #75 | 1 | 1 | $1,070 |
| #76 | 1 | 1 | $1,070 |
| #77 | 1 | 1 | $1,070 |
| #78 | 1 | 1 | $1,070 |
| Total (78 units) | $83,451 | ||
UW: 25.0% down · 7.5% · 30yr · 1.5% tax · 5.0% vac · 8.0% maint · 8.0% mgmt
Financing live
Cash to close
- Down payment
- $300,000
- Closing costs
- $36,000
- Reserves months
- —
- Total cash needed
- —
Loan-product check · same deal, 3 products live
Conventional
25% down · 7.5% · 30yr
- Down + closing
- —
- Monthly P&I
- —
- Monthly cashflow
- —
- DSCR
- —
- Eligible?
- —
Personal DTI + credit; lowest rate.
DSCR
20% down · 8.5% · 30yr
- Down + closing
- —
- Monthly P&I
- —
- Monthly cashflow
- —
- DSCR
- —
- Eligible?
- —
No personal income docs; deal must DSCR.
Hard money
10% down · 12.0% · 12mo
- Down + closing
- —
- Monthly P&I
- —
- Monthly cashflow
- —
- DSCR
- —
- Eligible?
- —
Short-term bridge; refi at stabilization.
Listing history 7 events
-
2026-05-14status Pending 1140-char remark
Show marketing remark (1150 chars)
Plaza Park Apartments is a 78-unit, Class C multifamily community offered at $1,200,000 — representing one of the most compelling deep-value-add acquisition opportunities currently available in the greater New Orleans market. Situated on 2.77 acres in the West Lake Forest submarket of New Orleans East, the property comprises approximately 98,710 gross square feet with 76,100 rentable square feet across a mix of one-, two-, and three-bedroom units. The site is zoned S-RM2 (Suburban Multifamily) and is not located within a designated FEMA flood zone. Originally constructed in 1986, the asset has experienced significant deferred maintenance following foreclosure and is priced accordingly — at just $15,385 per unit and $12.16 per gross square foot. For experienced value-add operators and distressed asset investors, the rehabilitation path is well-defined: estimated total CapEx of $3,950,000 yields a projected After-Repair Value of approximately $5,125,000, a stabilized NOI of $614,400, and an equity creation potential of nearly $4,000,000. A stabilization timeline of 18 to 24 months post-acquisition is considered reasonable.
-
2026-05-14status Pending 1150-char remark
Show marketing remark (1150 chars)
Plaza Park Apartments is a 78-unit, Class C multifamily community offered at $1,200,000 — representing one of the most compelling deep-value-add acquisition opportunities currently available in the greater New Orleans market. Situated on 2.77 acres in the West Lake Forest submarket of New Orleans East, the property comprises approximately 98,710 gross square feet with 76,100 rentable square feet across a mix of one-, two-, and three-bedroom units. The site is zoned S-RM2 (Suburban Multifamily) and is not located within a designated FEMA flood zone. Originally constructed in 1986, the asset has experienced significant deferred maintenance following foreclosure and is priced accordingly — at just $15,385 per unit and $12.16 per gross square foot. For experienced value-add operators and distressed asset investors, the rehabilitation path is well-defined: estimated total CapEx of $3,950,000 yields a projected After-Repair Value of approximately $5,125,000, a stabilized NOI of $614,400, and an equity creation potential of nearly $4,000,000. A stabilization timeline of 18 to 24 months post-acquisition is considered reasonable.
-
2026-04-16$1,200,000 Active 1140-char remark
Show marketing remark (1150 chars)
Plaza Park Apartments is a 78-unit, Class C multifamily community offered at $1,200,000 — representing one of the most compelling deep-value-add acquisition opportunities currently available in the greater New Orleans market. Situated on 2.77 acres in the West Lake Forest submarket of New Orleans East, the property comprises approximately 98,710 gross square feet with 76,100 rentable square feet across a mix of one-, two-, and three-bedroom units. The site is zoned S-RM2 (Suburban Multifamily) and is not located within a designated FEMA flood zone. Originally constructed in 1986, the asset has experienced significant deferred maintenance following foreclosure and is priced accordingly — at just $15,385 per unit and $12.16 per gross square foot. For experienced value-add operators and distressed asset investors, the rehabilitation path is well-defined: estimated total CapEx of $3,950,000 yields a projected After-Repair Value of approximately $5,125,000, a stabilized NOI of $614,400, and an equity creation potential of nearly $4,000,000. A stabilization timeline of 18 to 24 months post-acquisition is considered reasonable.
-
2026-04-16$1,200,000 Active 1150-char remark
Show marketing remark (1150 chars)
Plaza Park Apartments is a 78-unit, Class C multifamily community offered at $1,200,000 — representing one of the most compelling deep-value-add acquisition opportunities currently available in the greater New Orleans market. Situated on 2.77 acres in the West Lake Forest submarket of New Orleans East, the property comprises approximately 98,710 gross square feet with 76,100 rentable square feet across a mix of one-, two-, and three-bedroom units. The site is zoned S-RM2 (Suburban Multifamily) and is not located within a designated FEMA flood zone. Originally constructed in 1986, the asset has experienced significant deferred maintenance following foreclosure and is priced accordingly — at just $15,385 per unit and $12.16 per gross square foot. For experienced value-add operators and distressed asset investors, the rehabilitation path is well-defined: estimated total CapEx of $3,950,000 yields a projected After-Repair Value of approximately $5,125,000, a stabilized NOI of $614,400, and an equity creation potential of nearly $4,000,000. A stabilization timeline of 18 to 24 months post-acquisition is considered reasonable.
-
2026-03-30soldstatus $3,533,400
-
2022-11-15soldstatus $6,100,000
-
1991-07-29soldstatus $123,000
ⓘ Source: listings_history table (triggers on properties + properties_extension) + one-shot
backfill from property_details.listing_events for pre-trigger history.
Tax reassessment forecast LA · Resets to sale price
- Current annual tax
- $8,676 · $723/mo
- Projected year-2 tax
- $8,676 · $723/mo
- Expected delta
- $0/yr ($0/mo · 0.0%)
ⓘ Screening estimate from a state-policy table — verify with the county assessor before closing.
Climate risk First Street
- Flood 9/10 Extreme FEMA zone X (shaded) · 60% chance over 30 yrs
- Wildfire 1/10 Low
- Heat 10/10 Extreme 7 d/yr ≥107°F today · 21 d/yr by 30 yrs out
- Wind 10/10 Extreme 99% chance of damaging wind over 30 yrs
- Air quality 3/10 Moderate 3 unhealthy d/yr today · 3 by 30 yrs out
Nearby sold comps map
Loading sold comps map…
Walkable amenities ~0.75 mi
Loading nearby amenities…
Taxation est. · year 1
- Rental income
- $1,001,412
- − Mortgage interest
- −$67,219
- − Property taxes
- −$8,676
- − Insurance
- −$6,798
- − Repairs & maintenance
- −$80,113
- − Management
- −$80,113
- − Depreciation
- −$34,909
- Taxable income
- $723,585
- Est. tax owed @ 24.0%
- −$173,660
- After-tax cash flow
- $526,466/yr
For passive investors: Depreciation is non-cash, so a rental often shows a tax loss while cash-flowing — sheltering income. Rental losses are passive: they offset passive income freely, and up to $25,000/yr can offset ordinary (W-2) income if you actively participate and your MAGI is under $100k (phasing out to $0 by $150k); unused losses carry forward. On sale, claimed depreciation is recaptured at up to 25%, and gains may owe capital-gains tax (a 1031 exchange can defer both). Figures are a year-1 estimate at your 24.0% rate — not tax advice; consult a CPA.
Schools (NCES district)
- District
- Orleans Parish
- NCES district ID
- 2201170
- Math proficiency
- 11% ▼ -52.00%
- Reading proficiency
- 27% ▼ -46.00%
- Median HH income
- $37,011
- Composite
- 15.78/100
- National rank
- #9271
- State rank
- #69 of 98 in LA
Livability — New Orleans
- Score
- 81/100
- State rank
- #3
- US rank
- #1383
Category grades
Schools grade is shown separately in the Schools card above.
Census & demographics
- Census place
- New Orleans, LA
- County
- Orleans Parish · 338,817 people
- City population
- 338,817
- Metro
- New Orleans-Metairie, LA
- Population (ZIP)
- 23,107
- Household income
- $40,765
- Rent vs Own
- Severe rent burden
- 2030.0
Population outlook (Orleans County) Hauer SSP2
- Today (2025)
- 513,025 people
- By 2030
- 575,781 · +12.2%
- By 2040
- 700,174 · +36.5%
- By 2050
- 826,541 · +61.1%
- By 2075
- 1,123,374 · +119.0%
- By 2100
- 1,355,609 · +164.2%
Race, ethnicity, and origin ACS 2023
- Neighborhood character
- Predominantly Black (91%)
- Race & ethnicity
- Black 91% Hispanic / Latino 4% Two or more races 4% White 2%
- Common ancestry
- Lithuanian 1% Hispanic 1%
- Foreign-born
- 3% · Canada, Vietnam
- Languages at home
- 96% English-only · Spanish 2%
Political lean MEDSL · Orleans
- 2024 margin
- Solid D (+67.0) · D 82.2% · R 15.2% · Other 2.7%
- 2008→2024 swing
- +6.7pp toward D · 2008: 60.3pp · 2024: 67.0pp
- All cycles
- 2024: D+67.0 2020: D+68.2 2016: D+66.2 2012: D+62.5 2008: D+60.3
Not yet ingested
- Civics
- —
Market trends
- HPI YoY
- ▼ -72.43%
- Current HPI
- 175.4465
- Rent YoY
- —
- Metro
- New Orleans-Metairie, LA
- State GDP YoY
- ▲ 3.29%
- F500 in state
- 10
Industry mix (Fortune 500 HQ in LA)
| Industry | F500 HQs | Revenue |
|---|---|---|
| Telecommunications | 2 | $23B |
|
||
| Utilities | 1 | $12B |
|
||
| Wholesale / Distribution | 1 | $5B |
|
||
| Advertising | 1 | $2B |
|
||
Price history
+875.6% since first listed7 events — show timeline
- 2026-05-14 Pending — AcadianaMLS
- 2026-05-14 Pending — GSREIN
- 2026-04-16 Listed $1,200,000 GSREIN
- 2026-04-16 Listed $1,200,000 AcadianaMLS
- 2026-03-30 Sold (Public Records) $3,533,400 Public Records
- 2022-11-15 Sold (Public Records) $6,100,000 Public Records
- 1991-07-29 Sold (Public Records) $123,000 Public Records
Property tax history
+6.5%/yrLatest (2026): $8,676 · +1.1% YoY. Source: county tax records.
Cash-flow waterfall
monthlySold comps — $/sqft
last 12 mo · ≤1 miLoading sold comps…