301 Rosewood Dr · Victoria, TX
Flood risk 6/10 · Moderate
- FEMA flood zone
- X
- Chance of flooding over 30 yrs
- 0.71%
- Est. flood insurance / yr
- $507 – $1,088
Fire risk 2/10 · Minimal
- Est. fire insurance / yr
- $1,222 – $2,270
Heat risk 9/10 · Severe
- Hot days now (above 112°F)
- 7 days/yr
- Hot days in 30 yrs
- 19 days/yr
Wind risk 9/10 · Severe
- Chance of severe wind over 30 yrs
- 99.0%
Air-quality risk 1/10 · Minimal
- Unhealthy air days now
- 0 days/yr
- Unhealthy air days in 30 yrs
- 0 days/yr
Risk factors via First Street. Map © Google.
Why this score? — see what drove the D grade
The composite is a weighted blend of 9 inputs, each scored 0–100. Each bar is that input's sub-score; the figure is the points it added to the 100-point composite (weight × sub-score).
- ARV discount +15.0/15.0
- Cash flow +9.6/30.0
- Livability +3.6/5.0
- 1% rule +3.3/10.0
- DSCR +2.7/10.0
- Schools +2.5/10.0
- Condition / age +2.5/5.0
- Rent growth +2.3/5.0
- Appreciation +0.0/10.0
$175,000
🖨 Deal sheet 📄 Offer letter ✓ Due diligence
Listing remarks MLS
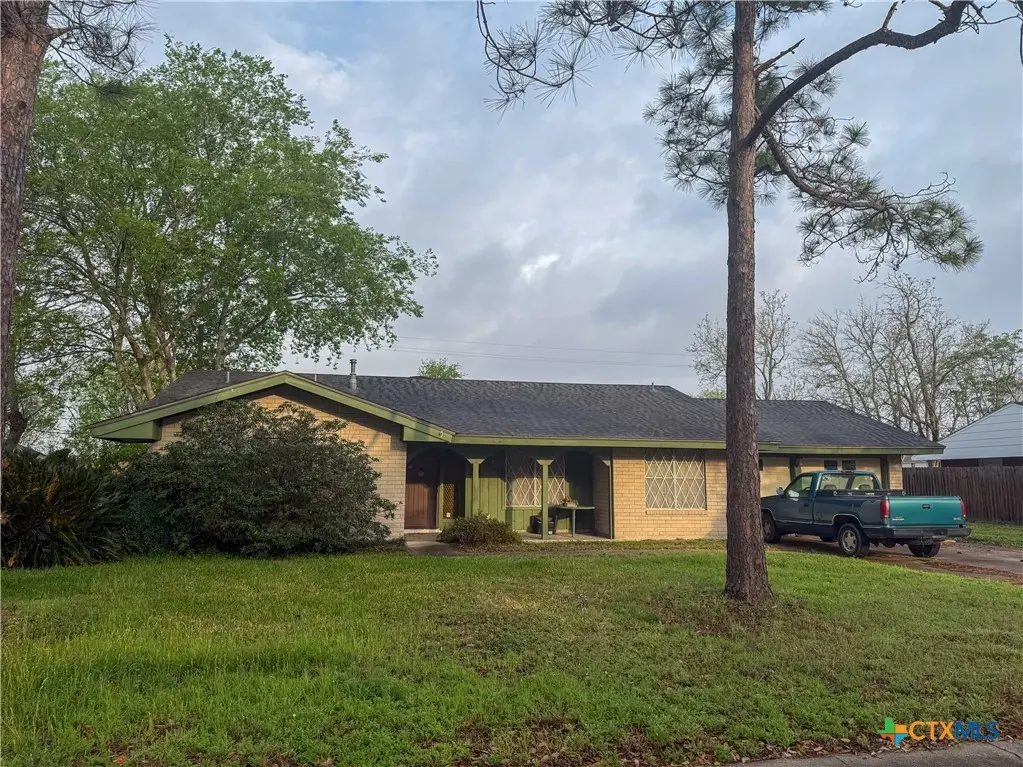
Great opportunity for an investor or a group of investors, first-time home buyer with skills. This brick home has a wood-burning fireplace, vaulted ceiling, 3 bedrooms, and 2 baths. Located near schools, shopping, and a medical center, as well as the University and Victoria College. This is the blank slate you are looking for to make it your own. This home is near the Fine Arts Center and the Tanglewood pool and clubhouse.
Key facts
- Near schools
- Near shopping
- Vaulted ceiling
Tags
Neighborhood map
What this means for you Summary
Snapshot
- This is a 3-bed/2.0-bath single-family listed at $175k.
Deal economics
- At list price, monthly cash flow is $-119 ($-1k/yr) — negative.
- To cash-flow at today's rent, offer at most $154k (12.0% below list).
- To meet the 1% rule (rent ≥ 1% of price), the offer needs to be $146k (16.8% below list).
- Recommended offer: $146k (16.8% below list) — sets the bar for 1% rule.
- Cap rate 5.5% vs local median 3.7% in Victoria — top-decile yield for the area; either an underpriced asset or a hidden risk that comps aren't pricing in. Stress-test before assuming the spread holds.
Location & tenants
- Location reads 71/100 on livability (#309 in TX) — a middle-class / working-renter tenant base. Strengths: cost of living A+, housing A+, health & safety A+; Watch: crime D+, schools D, amenities F.
- Victoria ISD (urban): math 24% / reading 33% proficiency, ranked #645 of 826 in TX (top 78%) — low school quality limits family demand, transient renter base, plan for 1-2y turnover.
- Market conditions: Rents soft (-0.8%/yr); 196 active listings in the ZIP; 5 comparable units currently listed for rent nearby; rentals lingering (median 44d on market — plan ~5-8 weeks vacancy on turnover, expect pricing pressure); 100% of comp listings sitting > 30 days — soft ceiling on asking rent; 43 units permitted in Victoria County in 2024 (0 in 5+ unit buildings).
- This rent runs 30% of the median local income ($58k/yr) — at the standard rent-burdened threshold; future hikes will face affordability resistance.
Forward outlook
- Local home prices are declining (-3.0%/yr); year-one equity from $1k of loan paydown is wiped out by about $5k of value loss. Plan a longer hold.
- Victoria County population projected at +34% by 2050 — long-run rental-demand tailwind backs the buy-and-hold thesis.
Negotiation context
- It's been on market 100 days — a 9% lower offer ($159k) is reasonable based on typical stale-listing flexibility.
Risks & watch-outs
- Climate carrying-cost: major flood risk; severe wind risk, 99% chance of damaging wind over 30y; extreme-heat days projected 7→19/yr by 2055 (HVAC capex compounding) — expect insurance premiums to compound above CPI over the hold.
Questions for the listing agent
- What do current leases actually rent for vs. the listed asking? Can we see a recent rent roll and the last 12 months of T-12 income?
- It's been on market 100 days. Have you received any prior offers? Is the seller open to a 17% concession, seller financing, or rate buy-down credit?
- Built in 1973 — when were the roof, HVAC, electrical panel, plumbing, and water heater last replaced?
- Why hasn't it sold? Are there any deal-killer items the seller is aware of (foundation, flood, title, zoning, code violations)?
- Is there a deadline driving the sale (1031 exchange, divorce, estate, relocation)? That informs how much negotiation room exists.
- Schools are D-rated, which usually means shorter tenancies and higher turnover. Who's the typical renter profile here, and what's been the actual vacancy rate?
- Crime grade is D in this area — have there been break-ins, vandalism, or insurance claims at this property in the last 3 years? What carrier currently insures it and at what premium?
- The area grade is low — what's the realistic commute time and amenity access for the typical tenant pool here? Any planned neighborhood developments (good or bad) we should know about?
- What's the average days-on-market for RENTAL listings here right now (not sales)? A rising rental-DOM trend means longer vacancies and softer asking-rent achievability than the comps imply.
- What's the recent tenant-quality profile in this submarket — average credit score on applications, eviction rate, late-payment / NSF rate, and stable-employment percentage? A property-management company in the area should have these aggregated.
- How much new for-sale + rental construction is in the pipeline within 1–3 miles? Heavy new supply typically softens prices + rents 12–24 months out; constrained supply supports both.
Investment metrics
- 1% rule
- 0.83% ✗
- Cap rate
- 5.47%
- Cash-on-cash
- -2.92%
- DSCR
- 0.87
- GRM
- 10.0
CMA / ARV
- ARV (median comp)
- $226,500
- List price
- $175,000
- Delta
- -22.74%
- Verdict
- UNDERPRICED
- Comps
- 20 within 1.0 mi
Show comp detail 12 sales within ~0.75 mi
| Address | Dist | Beds/Ba | Sqft | Sold | Price | $/sf | Match |
|---|---|---|---|---|---|---|---|
| 402 Teakwood | 0.30mi | 3/2.0 | 1,844 (+1%) | 4mo | $295,000 | $160 | 81 |
| 503 Sherwood Dr | 0.27mi | 3/2.0 | 1,750 (-4%) | 3mo | $230,000 | $131 | 79 |
| 304 Sherwood Dr | 0.37mi | 3/2.0 | 1,746 (-4%) | 1mo | $233,000 | $133 | 75 |
| 517 Maplewood Dr | 0.23mi | 3/2.0 | 1,637 (-10%) | 3mo | $220,000 | $134 | 70 |
| 2407 E Airline Rd | 0.55mi | 3/2.0 | 1,796 (-1%) | 3mo | $223,000 | $124 | 70 |
| 3301 Cypress St | 0.33mi | 3/2.0 | 1,658 (-9%) | 2mo | $185,000 | $112 | 69 |
| 603 Maplewood Dr | 0.29mi | 3/2.5 | 1,644 (-10%) | 2mo | $179,990 | $109 | 67 |
| 106 Fieldstone | 0.62mi | 4/2.0 (+1) | 1,819 (-0%) | 8mo | $273,000 | $150 | 59 |
| 2708 E Poplar Ave | 0.41mi | 3/2.0 | 1,580 (-13%) | 1mo | $239,900 | $152 | 58 |
| 2602 College Dr | 0.47mi | 4/2.5 (+1) | 2,022 (+11%) | 3mo | $187,500 | $93 | 50 |
| 2303 Bon Aire Ave | 0.63mi | 3/2.0 | 1,654 (-9%) | 7mo | $230,000 | $139 | 49 |
| 3402 Erwin Ave | 0.70mi | 4/2.0 (+1) | 2,038 (+12%) | 8mo | $225,000 | $110 | 36 |
Match score weights: distance 35% · size 25% · config 20% · recency 20%. Top-matched comps best support the ARV.
Projected returns pro-forma
-3.0% appreciation · 0.0% rent growth · sell at horizon
- IRR
- -24.7%
- Equity multiple
- 0.18×
- Total profit
- $-40,162
- Equity at exit
- $26,093
- IRR
- -33.7%
- Equity multiple
- -0.24×
- Total profit
- $-61,002
- Equity at exit
- $15,131
Cash invested: $49,000 (down + closing). Projections, not guarantees.
Landlord ↔ Tenant lean methodology
- Overall (STATE)
- 87 Strongly Landlord-Friendly
- State Texas
- 87 Strongly Landlord-Friendly · R+5
- County
- — inherits STATE
- City
- — inherits STATE
ZIP-level market 77901
- Rents YoY
- -0.8%
- Active inventory
- 196
- Price-to-rent
- 10.0×
Monthly cashflow live
- Estimated rent
- $1,456 high interval (Pro) →
- Mortgage (P&I)
- −$918
- Tax from tax record
- −$279 /mo · $3,342/yr
- Insurance
- −$73
- HOA
- −$0
- Vacancy / Maint / Mgmt
- −$306
- Net cashflow
- $-119
Break-even live
UW: 25.0% down · 7.5% · 30yr · 1.5% tax · 5.0% vac · 8.0% maint · 8.0% mgmt
Financing live
Cash to close
- Down payment
- $43,750
- Closing costs
- $5,250
- Reserves months
- —
- Total cash needed
- —
Loan-product check · same deal, 3 products live
Conventional
25% down · 7.5% · 30yr
- Down + closing
- —
- Monthly P&I
- —
- Monthly cashflow
- —
- DSCR
- —
- Eligible?
- —
Personal DTI + credit; lowest rate.
DSCR
20% down · 8.5% · 30yr
- Down + closing
- —
- Monthly P&I
- —
- Monthly cashflow
- —
- DSCR
- —
- Eligible?
- —
No personal income docs; deal must DSCR.
Hard money
10% down · 12.0% · 12mo
- Down + closing
- —
- Monthly P&I
- —
- Monthly cashflow
- —
- DSCR
- —
- Eligible?
- —
Short-term bridge; refi at stabilization.
Rent comps 5 comps
| Address | Beds | Baths | Sqft | Rent | $/sqft | DOM | Units | Dist |
|---|---|---|---|---|---|---|---|---|
| 602 Sherwood Dr Unit C Victoria, TX | 2.0 | 2.0 | 1225 | $1,250 | $1.02 | 43d | 1 | 0.34mi |
| 2402 N Ben Wilson St Victoria, TX | 1.0–2.0 | 1.0–2.0 | 987 | $1,580 | $1.60 | 43d | 20 | 0.79mi |
| 1601 John Stockbauer Dr Victoria, TX | 1.0–3.0 | 1.0–2.0 | 998 | $1,805 | $1.81 | 43d | 8 | 1.04mi |
| 1709 Navidad St Victoria, TX | 4.0 | 1.0 | 1457 | $1,595 | $1.09 | 43d | 1 | 1.26mi |
| 114 Avant Garde Dr Victoria, TX | 3.0 | 2.0 | 1382 | $1,595 | $1.15 | 43d | 1 | 1.29mi |
Listing history 17 events
-
2026-06-19days on market $175,000 Active 100 DOM
-
2026-06-18days on market $175,000 Active 99 DOM
-
2026-06-17days on market $175,000 Active 98 DOM
-
2026-06-16days on market $175,000 Active 97 DOM
-
2026-06-15days on market $175,000 Active 96 DOM
-
2026-06-14days on market $175,000 Active 94 DOM
-
2026-06-13days on market $175,000 Active 93 DOM
-
2026-06-10days on market $175,000 Active 91 DOM
-
2026-06-09days on market $175,000 Active 90 DOM
-
2026-06-08days on market $175,000 Active 89 DOM
-
2026-06-07days on market $175,000 Active 88 DOM
-
2026-06-03days on market $175,000 Active 84 DOM
-
2026-06-02days on market $175,000 Active 83 DOM
-
2026-06-01days on market $175,000 Active 82 DOM
-
2026-05-31days on market $175,000 Active 81 DOM
-
2026-05-30days on market $175,000 Active 80 DOM
-
2026-03-10$175,000 Active 426-char remark
Show marketing remark (426 chars)
Great opportunity for an investor or a group of investors, first-time home buyer with skills. This brick home has a wood-burning fireplace, vaulted ceiling, 3 bedrooms, and 2 baths. Located near schools, shopping, and a medical center, as well as the University and Victoria College. This is the blank slate you are looking for to make it your own. This home is near the Fine Arts Center and the Tanglewood pool and clubhouse.
ⓘ Source: listings_history table (triggers on properties + properties_extension) + one-shot
backfill from property_details.listing_events for pre-trigger history.
Tax reassessment forecast TX · Resets to sale price
- Current annual tax
- $3,342 · $279/mo
- Projected year-2 tax
- $3,342 · $279/mo
- Expected delta
- $0/yr ($0/mo · 0.0%)
ⓘ Screening estimate from a state-policy table — verify with the county assessor before closing.
Climate risk First Street
- Flood 6/10 Major FEMA zone X · 71% chance over 30 yrs
- Wildfire 2/10 Low
- Heat 9/10 Extreme 7 d/yr ≥112°F today · 19 d/yr by 30 yrs out
- Wind 9/10 Extreme 99% chance of damaging wind over 30 yrs
- Air quality 1/10 Low 0 unhealthy d/yr today · 0 by 30 yrs out
Nearby sold comps map
Loading sold comps map…
Walkable amenities ~0.75 mi
Loading nearby amenities…
Taxation est. · year 1
- Rental income
- $17,467
- − Mortgage interest
- −$9,803
- − Property taxes
- −$3,342
- − Insurance
- −$875
- − Repairs & maintenance
- −$1,397
- − Management
- −$1,397
- − Depreciation
- −$5,091
- Taxable loss
- −$4,439
- Est. tax savings @ 24.0%
- +$1,065
- After-tax cash flow
- $-366/yr
For passive investors: Depreciation is non-cash, so a rental often shows a tax loss while cash-flowing — sheltering income. Rental losses are passive: they offset passive income freely, and up to $25,000/yr can offset ordinary (W-2) income if you actively participate and your MAGI is under $100k (phasing out to $0 by $150k); unused losses carry forward. On sale, claimed depreciation is recaptured at up to 25%, and gains may owe capital-gains tax (a 1031 exchange can defer both). Figures are a year-1 estimate at your 24.0% rate — not tax advice; consult a CPA.
Schools (NCES district)
- District
- Victoria ISD
- NCES district ID
- 4844150
- Math proficiency
- 24% ▼ -12.00%
- Reading proficiency
- 33% ▼ -2.00%
- Median HH income
- $50,534
- Composite
- 24.98/100
- National rank
- #7562
- State rank
- #645 of 826 in TX
Livability — Victoria
- Score
- 71/100
- State rank
- #309
- US rank
- #6960
Category grades
Schools grade is shown separately in the Schools card above.
Census & demographics
- Census place
- Victoria, TX
- County
- Victoria County · 69,915 people
- City population
- 69,915
- Metro
- Victoria, TX
- Population (ZIP)
- 39,854
- Household income
- $57,923
- Rent vs Own
- Severe rent burden
- 1802.0
Population outlook (Victoria County) Hauer SSP2
- Today (2025)
- 106,119 people
- By 2030
- 113,161 · +6.6%
- By 2040
- 127,402 · +20.1%
- By 2050
- 141,953 · +33.8%
- By 2075
- 179,410 · +69.1%
- By 2100
- 200,127 · +88.6%
Race, ethnicity, and origin ACS 2023
- Neighborhood character
- Predominantly Hispanic (66%)
- Race & ethnicity
- Hispanic / Latino 66% Two or more races 30% White 24% Black 7% Asian 2%
- Hispanic origin (detail)
- Mexican 60%
- Common ancestry
- Serbian 2% Lithuanian 1% Italian 1%
- Foreign-born
- 10% · Canada, China
- Languages at home
- 64% English-only · Spanish 35% Chinese 1%
Political lean MEDSL · Victoria
- 2024 margin
- Solid R (+42.6) · D 28.4% · R 71.0%
- 2008→2024 swing
- -9.0pp toward R · 2008: -33.6pp · 2024: -42.6pp
- All cycles
- 2024: R+42.6 2020: R+38.0 2016: R+40.0 2012: R+37.8 2008: R+33.6
Not yet ingested
- Civics
- —
Market trends
- HPI YoY
- ▼ -127.62%
- Current HPI
- 138.3569
- Rent YoY
- ▼ -0.79%
- Metro
- Victoria, TX
- State GDP YoY
- ▲ 3.95%
- F500 in state
- 110
Industry mix (Fortune 500 HQ in TX)
| Industry | F500 HQs | Revenue |
|---|---|---|
| Energy | 16 | $1,198B |
|
||
| Technology | 5 | $198B |
|
||
| Engineering / Construction | 4 | $72B |
|
||
| Energy Services | 3 | $60B |
|
||
| Utilities | 3 | $41B |
|
||
| Healthcare | 2 | $330B |
|
||
Price history
1 event — show timeline
- 2026-03-10 Listed $175,000 CTXMLS
Property tax history
-4.0%/yrLatest (2025): $3,342 · -22.5% YoY. Source: county tax records.
Cash-flow waterfall
monthlySold comps — $/sqft
last 12 mo · ≤1 miLoading sold comps…