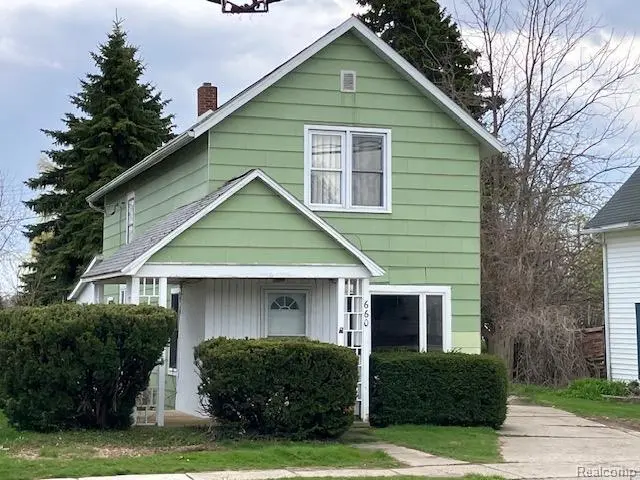
660 State St · Harbor Beach, MI
Flood risk 6/10 · Moderate
- FEMA flood zone
- X (unshaded)
- Chance of flooding over 30 yrs
- 0.74%
- Est. flood insurance / yr
- $473 – $860
Fire risk 1/10 · Minimal
- Est. fire insurance / yr
- $784 – $1,456
Heat risk 1/10 · Minimal
- Hot days now (above 95°F)
- 7 days/yr
- Hot days in 30 yrs
- 13 days/yr
Wind risk 1/10 · Minimal
- Chance of severe wind over 30 yrs
- —
Air-quality risk 2/10 · Minimal
- Unhealthy air days now
- 1 days/yr
- Unhealthy air days in 30 yrs
- 2 days/yr
Risk factors via First Street. Map © Google.
Why this score? — see what drove the C grade
The composite is a weighted blend of 9 inputs, each scored 0–100. Each bar is that input's sub-score; the figure is the points it added to the 100-point composite (weight × sub-score).
- Cash flow +23.5/30.0
- ARV discount +9.0/15.0
- DSCR +7.6/10.0
- 1% rule +4.8/10.0
- Livability +3.8/5.0
- Schools +3.2/10.0
- Rent growth +2.5/5.0
- Condition / age +2.5/5.0
- Appreciation +0.0/10.0
$99,900
🖨 Deal sheet 📄 Offer letter ✓ Due diligence
Listing remarks MLS
3 Bedroom, 1 1/2 bath, with 1 car detached garage, with attached 12 X 12 workshop. . Nice home located in Harbor Beach walking distance from Shopping, Schools, Hospital and the gorgeous sandy beach.
Key facts
- Attached workshop
- Detached garage
- 4,792 sq ft lot
Tags
Property features AI
Finance
- Other: Residential property; Located between 5th and Whitcomb on State Street (south side of the street)
Exterior
- Parking: Detached garage; Driveway; One garage space
- Utilities: Public water; Public sewer
- Home design: Single-family residence; Two levels; Entry at ground level
- Construction: Asbestos construction materials; Block and brick/mortar foundation; Built above-grade finished area of 936 square feet
- Exterior features: Paved road access; Lot dimensions approximately 120 x 60 x 130 x 50
Interior
- Bathrooms: One full bathroom; One half bathroom
- Heating & cooling: Forced air heating; Natural gas heating; No central cooling listed
- Interior features: Unfinished basement; Six total rooms; Ground-level entry
Neighborhood map
What this means for you Summary
Snapshot
- This is a 3-bed/1.0-bath single-family listed at $100k.
Deal economics
- At list price, monthly cash flow is $187 ($2k/yr) — positive.
- The deal already cash-flows at list — no discount required.
- To meet the 1% rule (rent ≥ 1% of price), the offer needs to be $98k (2.3% below list).
- Recommended offer: $97k (3.0% below list) — sets the bar for market timing.
Location & tenants
- Location reads 76/100 on livability (#134 in MI, #3,278 nationally) — a middle-class / working-renter tenant base. Strengths: crime A+, cost of living A+, housing A+; Watch: amenities F, commute F, employment F.
- Harbor Beach Community Schools (rural): math 30% / reading 46% proficiency, ranked #246 of 540 in MI (top 46%) — families likely to look elsewhere, expect single-tenant / working-renter base with shorter leases.
- Market conditions: 22 active listings in the ZIP; 67 units permitted in Huron County in 2024 (0 in 5+ unit buildings).
Forward outlook
- Local home prices are declining (-3.0%/yr); year-one equity from $691 of loan paydown is wiped out by about $3k of value loss. Plan a longer hold.
- Huron County population projected at -26% by 2050 — secular population decline; favor cash flow + early exit over multi-decade hold.
Negotiation context
- It's been on market 45 days — a 3% lower offer ($97k) is reasonable based on typical stale-listing flexibility.
- 4 sale attempts with the ask held roughly flat each time — persistent listings suggest the price (not the market) is what's stuck; bring a comps-based counter.
Risks & watch-outs
- Watch-outs: built in 1920 — expect roof / HVAC / electrical / plumbing capex.
- Climate carrying-cost: major flood risk — expect insurance premiums to compound above CPI over the hold.
Questions for the listing agent
- It's been on market 45 days. Have you received any prior offers? Is the seller open to a 3% concession, seller financing, or rate buy-down credit?
- Built in 1920 — when were the roof, HVAC, electrical panel, plumbing, and water heater last replaced?
- Is there a deadline driving the sale (1031 exchange, divorce, estate, relocation)? That informs how much negotiation room exists.
- What's the average days-on-market for RENTAL listings here right now (not sales)? A rising rental-DOM trend means longer vacancies and softer asking-rent achievability than the comps imply.
- What's the recent tenant-quality profile in this submarket — average credit score on applications, eviction rate, late-payment / NSF rate, and stable-employment percentage? A property-management company in the area should have these aggregated.
- How much new for-sale + rental construction is in the pipeline within 1–3 miles? Heavy new supply typically softens prices + rents 12–24 months out; constrained supply supports both.
Investment metrics
- 1% rule
- 0.98% ✗
- Cap rate
- 8.53%
- Cash-on-cash
- 8.00%
- DSCR
- 1.36
- GRM
- 8.5
CMA / ARV
- ARV (median comp)
- $103,356
- List price
- $99,900
- Delta
- -3.34%
- Verdict
- FAIR
- Comps
- 16 within 1.0 mi
Show comp detail 4 sales within ~0.75 mi
| Address | Dist | Beds/Ba | Sqft | Sold | Price | $/sf | Match |
|---|---|---|---|---|---|---|---|
| 363 NELSON St | 0.39mi | 3/1.0 | 960 (+3%) | 12mo | $166,000 | $173 | 68 |
| 363 Nelson St | 0.39mi | 3/1.0 | 960 (+3%) | 12mo | $166,000 | $173 | 68 |
| 724 Lytle Ave | 0.39mi | 3/1.0 | 1,040 (+11%) | 12mo | $142,000 | $137 | 53 |
| 511 N Huron Ave | 0.63mi | 2/1.0 (-1) | 820 (-12%) | 10mo | $38,000 | $46 | 36 |
Match score weights: distance 35% · size 25% · config 20% · recency 20%. Top-matched comps best support the ARV.
Projected returns pro-forma
-3.0% appreciation · 3.0% rent growth · sell at horizon
- IRR
- -4.2%
- Equity multiple
- 0.84×
- Total profit
- $-4,357
- Equity at exit
- $14,895
- IRR
- 5.5%
- Equity multiple
- 1.40×
- Total profit
- $11,301
- Equity at exit
- $8,638
Cash invested: $27,972 (down + closing). Projections, not guarantees.
Landlord ↔ Tenant lean methodology
- Overall (STATE)
- 62 Landlord-Friendly
- State Michigan
- 62 Landlord-Friendly · EVEN
- County
- — inherits STATE
- City
- — inherits STATE
ZIP-level market 48441
- Home prices YoY
- -19.3%
- Active inventory
- 22
- Price-to-rent
- 8.5×
Monthly cashflow live
- Estimated rent
- $976 medium interval (Pro) →
- Mortgage (P&I)
- −$524
- Tax from tax record
- −$19 /mo · $228/yr
- Insurance
- −$42
- HOA
- −$0
- Vacancy / Maint / Mgmt
- −$205
- Net cashflow
- $187
Break-even live
UW: 25.0% down · 7.5% · 30yr · 1.5% tax · 5.0% vac · 8.0% maint · 8.0% mgmt
Financing live
Cash to close
- Down payment
- $24,975
- Closing costs
- $2,997
- Reserves months
- —
- Total cash needed
- —
Loan-product check · same deal, 3 products live
Conventional
25% down · 7.5% · 30yr
- Down + closing
- —
- Monthly P&I
- —
- Monthly cashflow
- —
- DSCR
- —
- Eligible?
- —
Personal DTI + credit; lowest rate.
DSCR
20% down · 8.5% · 30yr
- Down + closing
- —
- Monthly P&I
- —
- Monthly cashflow
- —
- DSCR
- —
- Eligible?
- —
No personal income docs; deal must DSCR.
Hard money
10% down · 12.0% · 12mo
- Down + closing
- —
- Monthly P&I
- —
- Monthly cashflow
- —
- DSCR
- —
- Eligible?
- —
Short-term bridge; refi at stabilization.
Listing history 26 events
-
2026-06-18days on market $99,900 Active 45 DOM
-
2026-06-17days on market $99,900 Active 44 DOM
-
2026-06-16days on market $99,900 Active 43 DOM
-
2026-06-15days on market $99,900 Active 42 DOM
-
2026-06-13days on market $99,900 Active 40 DOM
-
2026-06-12days on market $99,900 Active 39 DOM
-
2026-06-09days on market $99,900 Active 36 DOM
-
2026-06-08days on market $99,900 Active 35 DOM
-
2026-06-07days on market $99,900 Active 34 DOM
-
2026-06-07days on market $99,900 Active 33 DOM
-
2026-06-04days on market $99,900 Active 30 DOM
-
2026-06-02days on market $99,900 Active 29 DOM
-
2026-06-01days on market $99,900 Active 28 DOM
-
2026-05-31days on market $99,900 Active 27 DOM
-
2026-05-31days on market $99,900 Active 26 DOM
-
2026-05-03$99,900 Active 198-char remark
Show marketing remark (198 chars)
3 Bedroom, 1 1/2 bath, with 1 car detached garage, with attached 12 X 12 workshop. . Nice home located in Harbor Beach walking distance from Shopping, Schools, Hospital and the gorgeous sandy beach.
-
2026-05-03$99,900 Active 198-char remark
Show marketing remark (198 chars)
3 Bedroom, 1 1/2 bath, with 1 car detached garage, with attached 12 X 12 workshop. . Nice home located in Harbor Beach walking distance from Shopping, Schools, Hospital and the gorgeous sandy beach.
-
2026-01-04historical
-
2025-12-03price $125,000
-
2025-12-02price $125,000
-
2025-10-13price $130,000
-
2025-10-12price $130,000
-
2025-09-23price $150,000
-
2025-09-22price $150,000
-
2025-08-26$159,900 Active
-
2025-08-26$159,900 Active
ⓘ Source: listings_history table (triggers on properties + properties_extension) + one-shot
backfill from property_details.listing_events for pre-trigger history.
Tax reassessment forecast MI · Partial reset (capped growth)
- Current annual tax
- $228 · $19/mo
- Projected year-2 tax
- $883 · $74/mo
- Expected delta
- +$655/yr (+$55/mo · 287.9%)
ⓘ Screening estimate from a state-policy table — verify with the county assessor before closing.
Climate risk First Street
- Flood 6/10 Major FEMA zone X (unshaded) · 74% chance over 30 yrs
- Wildfire 1/10 Low
- Heat 1/10 Low 7 d/yr ≥95°F today · 13 d/yr by 30 yrs out
- Wind 1/10 Low
- Air quality 2/10 Low 1 unhealthy d/yr today · 2 by 30 yrs out
Nearby sold comps map
Loading sold comps map…
Walkable amenities ~0.75 mi
Loading nearby amenities…
Taxation est. · year 1
- Rental income
- $11,712
- − Mortgage interest
- −$5,596
- − Property taxes
- −$228
- − Insurance
- −$500
- − Repairs & maintenance
- −$937
- − Management
- −$937
- − Depreciation
- −$2,906
- Taxable income
- $609
- Est. tax owed @ 24.0%
- −$146
- After-tax cash flow
- $2,093/yr
For passive investors: Depreciation is non-cash, so a rental often shows a tax loss while cash-flowing — sheltering income. Rental losses are passive: they offset passive income freely, and up to $25,000/yr can offset ordinary (W-2) income if you actively participate and your MAGI is under $100k (phasing out to $0 by $150k); unused losses carry forward. On sale, claimed depreciation is recaptured at up to 25%, and gains may owe capital-gains tax (a 1031 exchange can defer both). Figures are a year-1 estimate at your 24.0% rate — not tax advice; consult a CPA.
Schools (NCES district)
- District
- Harbor Beach Community Schools
- NCES district ID
- 2600007
- Math proficiency
- 30% ▼ -14.00%
- Reading proficiency
- 46% ▼ -11.00%
- Median HH income
- $40,037
- Composite
- 31.82/100
- National rank
- #5879
- State rank
- #246 of 540 in MI
Livability — Harbor Beach
- Score
- 76/100
- State rank
- #134
- US rank
- #3278
Category grades
Schools grade is shown separately in the Schools card above.
Census & demographics
- Census place
- Harbor Beach, MI
- Population (ZIP)
- 3,867
Population outlook (Huron County) Hauer SSP2
- Today (2025)
- 29,325 people
- By 2030
- 27,810 · -5.2%
- By 2040
- 24,571 · -16.2%
- By 2050
- 21,573 · -26.4%
- By 2075
- 16,120 · -45.0%
- By 2100
- 11,097 · -62.2%
Race, ethnicity, and origin ACS 2023
- Neighborhood character
- Predominantly White (95%)
- Race & ethnicity
- White 95% Two or more races 4% Hispanic / Latino 1%
- Common ancestry
- Romanian 17% Lithuanian 3% Slovak 3%
- Foreign-born
- 2%
- Languages at home
- 97% English-only · Spanish 1%
Political lean MEDSL · Huron
- 2024 margin
- Solid R (+40.6) · D 29.1% · R 69.7% · Other 1.2%
- 2008→2024 swing
- -40.2pp toward R · 2008: -0.4pp · 2024: -40.6pp
- All cycles
- 2024: R+40.6 2020: R+39.3 2016: R+38.2 2012: R+14.8 2008: R+0.4
Not yet ingested
- Civics
- —
Market trends
- HPI YoY
- ▼ -60.03%
- Current HPI
- 250.479
- Rent YoY
- —
- Metro
- —
- State GDP YoY
- ▲ 1.37%
- F500 in state
- 28
Industry mix (Fortune 500 HQ in MI)
| Industry | F500 HQs | Revenue |
|---|---|---|
| Automotive Parts | 3 | $48B |
|
||
| Automotive | 2 | $372B |
|
||
| Chemicals | 1 | $45B |
|
||
| Automotive Retail | 1 | $29B |
|
||
| Healthcare / Medical Devices | 1 | $23B |
|
||
| Automotive Technology | 1 | $20B |
|
||
Price history
-37.5% since first listed11 events — show timeline
- 2026-05-03 Listed $99,900 REALCOMP
- 2026-05-03 Listed $99,900 MiRealSource-MiMLS
- 2026-01-04 Listing Removed — MiRealSource-MiMLS
- 2025-12-03 Price Changed $125,000 MiRealSource-MiMLS
- 2025-12-02 Price Changed $125,000 REALCOMP
- 2025-10-13 Price Changed $130,000 MiRealSource-MiMLS
- 2025-10-12 Price Changed $130,000 REALCOMP
- 2025-09-23 Price Changed $150,000 MiRealSource-MiMLS
- 2025-09-22 Price Changed $150,000 REALCOMP
- 2025-08-26 Listed $159,900 REALCOMP
- 2025-08-26 Listed $159,900 MiRealSource-MiMLS
Property tax history
-10.1%/yrLatest (2025): $228 · -71.9% YoY. Source: county tax records.
Cash-flow waterfall
monthlySold comps — $/sqft
last 12 mo · ≤1 miLoading sold comps…