 🏗️ New Construction
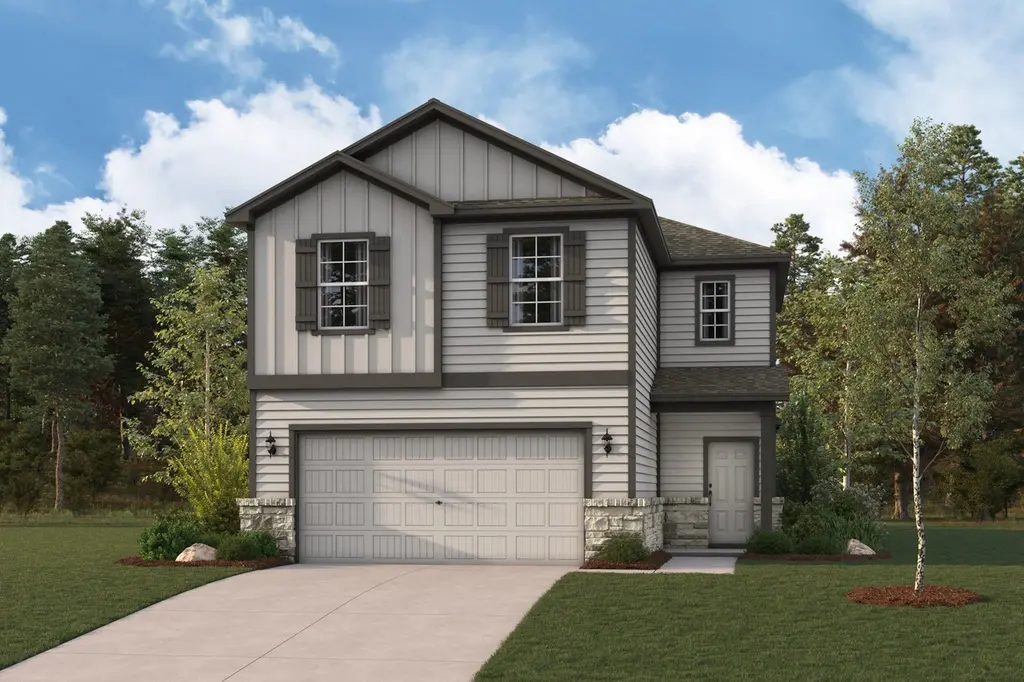
Silverbell Plan · Grangerland, TX
Flood risk No data
- FEMA flood zone
- —
- Chance of flooding over 30 yrs
- —
- Est. flood insurance / yr
- —
Fire risk No data
- Est. fire insurance / yr
- —
Heat risk No data
- Hot days now (above threshold)
- —
- Hot days in 30 yrs
- —
Wind risk No data
- Chance of severe wind over 30 yrs
- —
Air-quality risk No data
- Unhealthy air days now
- —
- Unhealthy air days in 30 yrs
- —
Risk factors via First Street. Map © Google.
Why this score? — see what drove the C- grade
The composite is a weighted blend of 9 inputs, each scored 0–100. Each bar is that input's sub-score; the figure is the points it added to the 100-point composite (weight × sub-score).
- Cash flow +19.9/30.0
- ARV discount +7.5/15.0
- DSCR +6.3/10.0
- 1% rule +5.3/10.0
- Schools +5.1/10.0
- Condition / age +4.8/5.0
- Rent growth +3.3/5.0
- Livability +2.5/5.0
- Appreciation +0.0/10.0
$294,990
🖨 Deal sheet (PDF) 📄 Offer letter ✓ Due diligence
Listing remarks MLS
The desirable Silverbell floor plan offers an expansive main-floor layout, centered around an airy great room. A dining area and a well-equipped kitchen with a center island are steps away and make for the perfect place to entertain. The floor also features a luxurious primary suite, complete with walk-in shower, dual vanities, and a spacious walk-in closet. The upper floor features three bedrooms and a roomy loft.
Key facts
- Dual vanities
- Walk-in closet
- Primary suite
Tags
Neighborhood map
What this means for you Summary
Snapshot
- This is a 4-bed/2.5-bath single-family listed at $295k. Condition is rated excellent.
Deal economics
- At list price, monthly cash flow is $325 ($4k/yr) — positive.
- The deal already cash-flows at list — no discount required.
- To meet the 1% rule (rent ≥ 1% of price), the offer needs to be $278k (5.9% below list).
- Recommended offer: $260k (12.0% below list) — sets the bar for market timing.
- Cap rate 7.7% vs local median 5.1% in Grangerland — top-decile yield for the area; either an underpriced asset or a hidden risk that comps aren't pricing in. Stress-test before assuming the spread holds.
Location & tenants
- Location reads: area grade C — affects rentability + tenant quality, not the cash-flow math above.
- Conroe ISD (other): math 57% / reading 57% proficiency, ranked #69 of 826 in TX (top 8%) — acceptable for families but not a draw, mixed tenant base, ~2y average lease.
- Zoned schools: Milam El (math 49% / reading 35%, grade F, #1,335 of 4,322 statewide, top 33%, 524 students, 82% FRL); Moorhead J H (math 35% / reading 42%, grade F, #704 of 1,662 statewide, top 43%, 1,391 students, 82% FRL); Conroe H S (math 32% / reading 51%, grade F, #767 of 1,632 statewide, top 47%, 4,915 students, 61% FRL) — zoned schools average 75% FRL vs 34% district-wide (40 pts higher); higher-poverty schools than district average — tighter screening recommended.
- Zoned-school proficiency averages 41% at this address vs 57% district-wide (-16 pts) — the specific schools serving this property underperform the Conroe ISD average; the district grade overstates school quality for this exact location.
- Market conditions: Rents rising (+3.3%/yr); 1117 active listings in the ZIP; 2 comparable units currently listed for rent nearby; solid renter incomes; 13,259 units permitted in Montgomery County in 2024 (1,402 in 5+ unit buildings).
- This rent runs 39% of the median local income ($85k/yr) — at the standard rent-burdened threshold; future hikes will face affordability resistance.
Forward outlook
- Local home prices are declining (-3.0%/yr); year-one equity from $2k of loan paydown is wiped out by about $8k of value loss. Plan a longer hold.
- Montgomery County population projected at +65% by 2050 — long-run rental-demand tailwind backs the buy-and-hold thesis.
Negotiation context
- It's been on market 337 days — a 12% lower offer ($260k) is reasonable based on typical stale-listing flexibility.
- 2 sale attempts with the ask held roughly flat each time — persistent listings suggest the price (not the market) is what's stuck; bring a comps-based counter.
Questions for the listing agent
- It's been on market 337 days. Have you received any prior offers? Is the seller open to a 12% concession, seller financing, or rate buy-down credit?
- Why hasn't it sold? Are there any deal-killer items the seller is aware of (foundation, flood, title, zoning, code violations)?
- Is there a deadline driving the sale (1031 exchange, divorce, estate, relocation)? That informs how much negotiation room exists.
- What's the average days-on-market for RENTAL listings here right now (not sales)? A rising rental-DOM trend means longer vacancies and softer asking-rent achievability than the comps imply.
- What's the recent tenant-quality profile in this submarket — average credit score on applications, eviction rate, late-payment / NSF rate, and stable-employment percentage? A property-management company in the area should have these aggregated.
- How much new for-sale + rental construction is in the pipeline within 1–3 miles? Heavy new supply typically softens prices + rents 12–24 months out; constrained supply supports both.
Investment metrics
- 1% rule
- 1.03% ✓
- Cap rate
- 7.74%
- Cash-on-cash
- 5.16%
- DSCR
- 1.23
- GRM
- 8.1
CMA / ARV
- ARV (median comp)
- $270,270
- List price
- $294,990
- Delta
- 9.15%
- Verdict
- FAIR
- Comps
- 20 within 1.0 mi
Show comp detail 12 sales within ~0.75 mi
| Address | Dist | Beds/Ba | Sqft | Sold | Price | $/sf | Match |
|---|---|---|---|---|---|---|---|
| 14300 Ash Tree Dr | 0.03mi | 3/2.5 (-1) | 2,447 (+8%) | 1mo | $324,900 | $133 | 79 |
| 16866 Needlepoint Dr | 0.12mi | 4/2.5 | 2,049 (-9%) | 2mo | $279,212 | $136 | 78 |
| 14337 Ash Tree Dr | 0.12mi | 3/2.5 (-1) | 2,447 (+8%) | 1mo | $319,900 | $131 | 75 |
| 16812 Needlepoint Dr | 0.06mi | 3/2.5 (-1) | 2,026 (-10%) | 1mo | $269,765 | $133 | 74 |
| 16981 Hazelnut Dr | 0.11mi | 3/2.5 (-1) | 2,447 (+8%) | 2mo | $334,900 | $137 | 74 |
| 14154 Granger Pointe | 0.75mi | 4/2.5 | 2,255 (-0%) | 1mo | $269,540 | $120 | 64 |
| 16827 Country Roots Ave | 0.64mi | 4/3.0 | 2,173 (-4%) | 2mo | $306,990 | $141 | 60 |
| 15611 Country Charm Trl | 0.52mi | 4/3.0 | 2,084 (-8%) | 1mo | $322,258 | $155 | 60 |
| 16767 Country Roots Ave | 0.51mi | 4/3.0 | 2,034 (-10%) | 0mo | $310,990 | $153 | 58 |
| 17343 Western Hill Dr | 0.65mi | 3/2.0 (-1) | 2,190 (-3%) | 1mo | $299,999 | $137 | 56 |
| 16763 Country Roots Ave | 0.50mi | 4/2.5 | 2,561 (+13%) | 0mo | $336,990 | $132 | 54 |
| 16823 Country Roots Ave | 0.63mi | 4/2.5 | 2,561 (+13%) | 2mo | $326,990 | $128 | 47 |
Match score weights: distance 35% · size 25% · config 20% · recency 20%. Top-matched comps best support the ARV.
Projected returns pro-forma
-3.0% appreciation · 3.3% rent growth · sell at horizon
- IRR
- -7.9%
- Equity multiple
- 0.71×
- Total profit
- $-22,190
- Equity at exit
- $40,298
- IRR
- 2.0%
- Equity multiple
- 1.15×
- Total profit
- $11,002
- Equity at exit
- $23,368
Cash invested: $75,676 (down + closing). Projections, not guarantees.
Landlord ↔ Tenant lean methodology
- Overall (STATE)
- 87 Strongly Landlord-Friendly
- State Texas
- 87 Strongly Landlord-Friendly · R+5
- County
- — inherits STATE
- City
- — inherits STATE
ZIP-level market 77302
- Rents YoY
- 3.3%
- Active inventory
- 1117
- Price-to-rent
- 8.9×
Monthly cashflow live
- Estimated rent
- $2,776 medium interval (Pro) →
- Mortgage (P&I)
- −$1,417
- Tax est. 1.5%
- −$338 /mo · $4,054/yr
- Insurance
- −$113
- HOA
- −$0
- Vacancy / Maint / Mgmt
- −$583
- Net cashflow
- $325
Break-even live
Sensitivity live
| Price | -10% $512 | -5% $419 | +0% $325 | +5% $232 | +10% $139 |
|---|---|---|---|---|---|
| Rent | -10% $106 | -5% $216 | +0% $325 | +5% $435 | +10% $545 |
| Rate | -1.0pp $461 | -0.5pp $394 | base $325 | +0.5pp $255 | +1.0pp $184 |
UW: 25.0% down · 7.5% · 30yr · 1.5% tax · 5.0% vac · 8.0% maint · 8.0% mgmt
Financing live
Cash to close
- Down payment
- $67,567
- Closing costs
- $8,108
- Reserves months
- —
- Total cash needed
- —
Loan-product check · same deal, 3 products live
Conventional
25% down · 7.5% · 30yr
- Down + closing
- —
- Monthly P&I
- —
- Monthly cashflow
- —
- DSCR
- —
- Eligible?
- —
Personal DTI + credit; lowest rate.
DSCR
20% down · 8.5% · 30yr
- Down + closing
- —
- Monthly P&I
- —
- Monthly cashflow
- —
- DSCR
- —
- Eligible?
- —
No personal income docs; deal must DSCR.
Hard money
10% down · 12.0% · 12mo
- Down + closing
- —
- Monthly P&I
- —
- Monthly cashflow
- —
- DSCR
- —
- Eligible?
- —
Short-term bridge; refi at stabilization.
Rent comps 2 comps
| Address | Beds | Baths | Sqft | Rent | $/sqft | DOM | Units | Dist |
|---|---|---|---|---|---|---|---|---|
| 16703 Twisted Pine Dr Conroe, TX | 3.0–4.0 | 2.0–3.0 | 1671 | $2,230 | $1.33 | 0d | 13 | 0.19mi |
| 15447 Dapple Bluff Ln Conroe, TX | 4.0 | 2.5 | 2265 | $2,900 | $1.28 | 45d | 1 | 1.49mi |
Listing history 16 events
-
2026-06-21days on market $294,990 Active 337 DOM
-
2026-06-18days on market $294,990 Active 334 DOM
-
2026-06-17days on market $294,990 Active 333 DOM
-
2026-06-16days on market $294,990 Active 332 DOM
-
2026-06-15days on market $294,990 Active 331 DOM
-
2026-06-13days on market $294,990 Active 329 DOM
-
2026-06-09days on market $294,990 Active 325 DOM
-
2026-06-08days on market $294,990 Active 324 DOM
-
2026-06-07days on market $294,990 Active 323 DOM
-
2026-06-04days on market $294,990 Active 320 DOM
-
2026-06-03days on market $294,990 Active 319 DOM
-
2026-06-02days on market $294,990 Active 318 DOM
-
2026-06-01days on market $294,990 Active 317 DOM
-
2026-05-31days on market $294,990 Active 316 DOM
-
2025-07-19$294,990 Active 418-char remark
Show marketing remark (418 chars)
The desirable Silverbell floor plan offers an expansive main-floor layout, centered around an airy great room. A dining area and a well-equipped kitchen with a center island are steps away and make for the perfect place to entertain. The floor also features a luxurious primary suite, complete with walk-in shower, dual vanities, and a spacious walk-in closet. The upper floor features three bedrooms and a roomy loft.
ⓘ Source: listings_history table (triggers on properties + properties_extension) + one-shot
backfill from property_details.listing_events for pre-trigger history.
Nearby sold comps map
Loading sold comps map…
Walkable amenities ~0.75 mi
Loading nearby amenities…
Taxation est. · year 1
- Rental income
- $33,314
- − Mortgage interest
- −$15,139
- − Property taxes
- −$4,054
- − Insurance
- −$1,351
- − Repairs & maintenance
- −$2,665
- − Management
- −$2,665
- − Depreciation
- −$7,862
- Taxable loss
- −$424
- Est. tax savings @ 24.0%
- +$102
- After-tax cash flow
- $4,006/yr
For passive investors: Depreciation is non-cash, so a rental often shows a tax loss while cash-flowing — sheltering income. Rental losses are passive: they offset passive income freely, and up to $25,000/yr can offset ordinary (W-2) income if you actively participate and your MAGI is under $100k (phasing out to $0 by $150k); unused losses carry forward. On sale, claimed depreciation is recaptured at up to 25%, and gains may owe capital-gains tax (a 1031 exchange can defer both). Figures are a year-1 estimate at your 24.0% rate — not tax advice; consult a CPA.
Condition & rehab AI · 5 photos
This Silverbell plan home is in excellent condition with no visible repairs or maintenance needed. It offers a good return on investment with updates that would significantly increase its resale and rental value.
Value-add opportunities
- Both Painting exterior and interior — Enhances curb appeal and interior aesthetics
- Both Landscaping improvements — Enhances curb appeal and adds value
- Resale New flooring in bathrooms — Improves appearance and functionality
- Resale New kitchen appliances — Enhances functionality and appeal
Renovation cost estimate screening
Value-add ROI direction
- Both Painting exterior and interior — Enhances curb appeal and interior aesthetics ↑
- Both Landscaping improvements — Enhances curb appeal and adds value ↑
- Resale New flooring in bathrooms — Improves appearance and functionality ↑
- Resale New kitchen appliances — Enhances functionality and appeal ↑
ⓘ Cost ranges are severity-bucket heuristics (US national rule-of-thumb). Get contractor quotes + a written scope before underwriting a rehab budget.
Schools (NCES district)
- District
- Conroe ISD
- NCES district ID
- 4815000
- Math proficiency
- 57% ▼ -6.00%
- Reading proficiency
- 57% ▼ -1.00%
- Median HH income
- $71,541
- Composite
- 50.65/100
- National rank
- #1833
- State rank
- #69 of 826 in TX
Livability — Grangerland
No livability data for this city. (Only ~50 U.S. cities are tracked.)
Census & demographics
- County
- Montgomery County · 663,713 people
- Metro
- Houston-The Woodlands-Sugar Land, TX
- Population (ZIP)
- 21,546
- Household income
- $84,673
- Rent vs Own
- Severe rent burden
- 205.0
Population outlook (Montgomery County) Hauer SSP2
- Today (2025)
- 713,896 people
- By 2030
- 805,263 · +12.8%
- By 2040
- 992,708 · +39.1%
- By 2050
- 1,179,590 · +65.2%
- By 2075
- 1,628,084 · +128.1%
- By 2100
- 1,937,880 · +171.5%
Race, ethnicity, and origin ACS 2023
- Neighborhood character
- Majority White (63%)
- Race & ethnicity
- White 63% Hispanic / Latino 29% Two or more races 19% Black 3% Asian 1%
- Hispanic origin (detail)
- Mexican 26% Puerto Rican 1%
- Common ancestry
- Lithuanian 3% Italian 2% Slovak 2%
- Foreign-born
- 13% · Canada, Vietnam, China
- Languages at home
- 78% English-only · Spanish 20% Russian/Polish/Slavic 1% Other Indo-European 0%
Political lean MEDSL · Montgomery
- 2024 margin
- Solid R (+45.5) · D 26.8% · R 72.3%
- 2008→2024 swing
- +7.2pp toward D · 2008: -52.7pp · 2024: -45.5pp
- All cycles
- 2024: R+45.5 2020: R+43.8 2016: R+51.4 2012: R+60.7 2008: R+52.7
Not yet ingested
- Civics
- —
Market trends
- HPI YoY
- ▼ -187.56%
- Current HPI
- 262.1879
- Rent YoY
- ▲ 3.30%
- Metro
- Houston-The Woodlands-Sugar Land, TX
- State GDP YoY
- ▲ 3.95%
- F500 in state
- 110
Industry mix (Fortune 500 HQ in TX)
| Industry | F500 HQs | Revenue |
|---|---|---|
| Energy | 16 | $1,198B |
|
||
| Technology | 5 | $198B |
|
||
| Engineering / Construction | 4 | $72B |
|
||
| Energy Services | 3 | $60B |
|
||
| Utilities | 3 | $41B |
|
||
| Healthcare | 2 | $330B |
|
||
Price history
+0.0% since first listed2 events — show timeline
- 2025-07-19 Listed $294,990 Zillow
- 2025-07-19 Listed $294,990 Zillow
Cash-flow waterfall
monthlySold comps — $/sqft
last 12 mo · ≤1 miLoading sold comps…