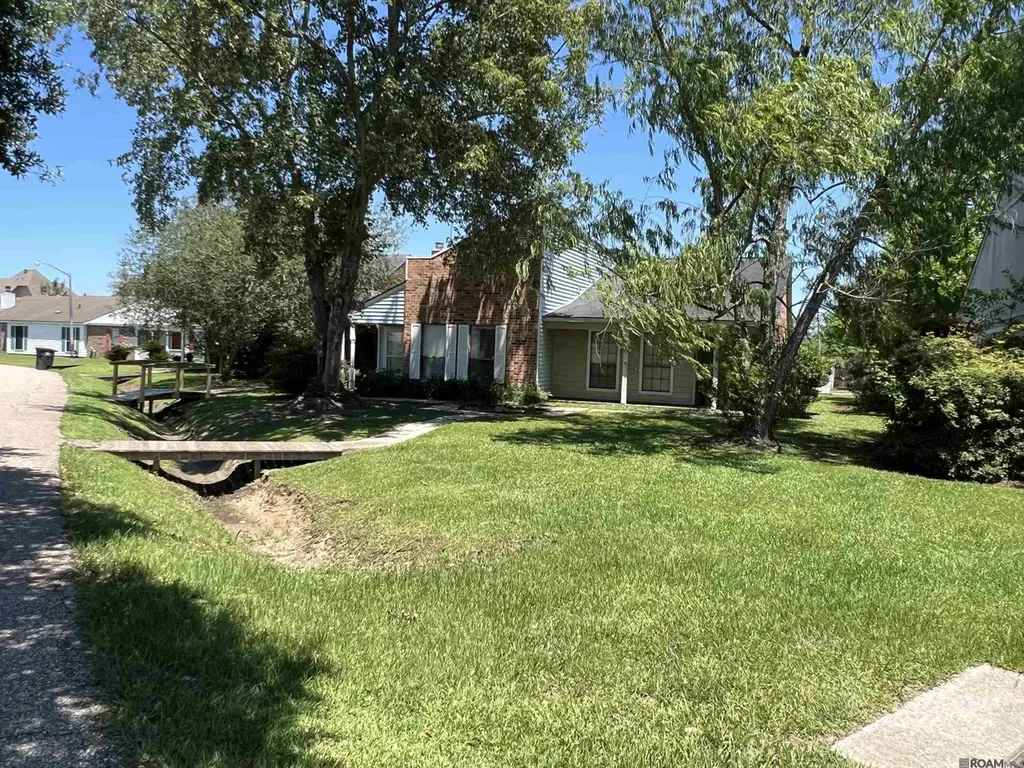
5109 Cumberland Cove Dr · Shenandoah, LA
Flood risk 1/10 · Minimal
- FEMA flood zone
- X
- Chance of flooding over 30 yrs
- 0.0%
- Est. flood insurance / yr
- $507 – $1,088
Fire risk 1/10 · Minimal
- Est. fire insurance / yr
- $1,269 – $2,357
Heat risk 8/10 · Major
- Hot days now (above 108°F)
- 7 days/yr
- Hot days in 30 yrs
- 21 days/yr
Wind risk 9/10 · Severe
- Chance of severe wind over 30 yrs
- 99.0%
Air-quality risk 3/10 · Minor
- Unhealthy air days now
- 2 days/yr
- Unhealthy air days in 30 yrs
- 3 days/yr
Risk factors via First Street. Map © Google.
Why this score? — see what drove the B- grade
The composite is a weighted blend of 9 inputs, each scored 0–100. Each bar is that input's sub-score; the figure is the points it added to the 100-point composite (weight × sub-score).
- Cash flow +26.2/30.0
- ARV discount +15.0/15.0
- DSCR +8.9/10.0
- 1% rule +7.0/10.0
- Livability +3.8/5.0
- Rent growth +3.0/5.0
- Condition / age +2.5/5.0
- Schools +2.4/10.0
- Appreciation +0.0/10.0
$130,000
🖨 Deal sheet 📄 Offer letter ✓ Due diligence
Listing remarks MLS
2-bedroom, 2-full-bath home in Cumberland Cove featuring a fireplace, computer nook, and garden window over the kitchen sink -- perfect for herbs, plants, or added natural light. The backyard includes two storage sheds for extra storage, and the property also offers covered parking for two vehicles. Conveniently located near shopping, dining, major roadways, and everyday amenities. Located in flood zone X. Needs some TLC and offers a great opportunity for a buyer ready to add personal touches or explore investment potential. Schedule your showing today.
Key facts
- Covered parking
- Computer nook
- Backyard
Tags
Property features AI
Finance
- Other: Located in the Cumberland Cove subdivision
- HOA & community: Homeowners association with an annual fee of $254 (about $21.17/month)
Exterior
- Parking: 2 total parking spaces; 2 covered carport spaces
- Utilities: Public water; Public sewer
- Home design: Attached townhouse (residential); Property is attached
- Construction: Vinyl siding; Shingle roof; Slab foundation; Built as a townhouse
- Exterior features: Shed(s)
Interior
- Bathrooms: 2 full bathrooms
- Heating & cooling: Central heating; Central air; Ceiling fans
- Interior features: Walk-in closets; Tray ceilings; One fireplace
- Laundry & utility: Washer hookup
Neighborhood map
What this means for you Summary
Snapshot
- This is a 2-bed/2.0-bath single-family listed at $130k.
Deal economics
- At list price, monthly cash flow is $331 ($4k/yr) — positive.
- The deal already cash-flows at list — no discount required.
- Meets the 1% rule at list price ($2k rent vs $130k).
- Recommended offer: $126k (3.0% below list) — sets the bar for market timing.
- Cap rate 9.4% vs local median 4.0% in Shenandoah — top-decile yield for the area; either an underpriced asset or a hidden risk that comps aren't pricing in. Stress-test before assuming the spread holds.
Location & tenants
- Location reads 76/100 on livability (#16 in LA, #3,778 nationally) — a middle-class / working-renter tenant base. Strengths: employment A+, housing A+, health & safety A; Watch: amenities F, commute F.
- East Baton Rouge Parish (urban): math 22% / reading 34% proficiency, ranked #47 of 98 in LA (top 48%) — low school quality limits family demand, transient renter base, plan for 1-2y turnover; 77% free/reduced lunch — lower-income household profile, screen leases tightly.
- Market conditions: Rents rising (+2.0%/yr); 360 active listings in the ZIP; 20 comparable units currently listed for rent nearby; rentals lingering (median 44d on market — plan ~5-8 weeks vacancy on turnover, expect pricing pressure); 50% of comp listings sitting > 30 days — soft ceiling on asking rent; solid renter incomes; 2,252 units permitted in East Baton Rouge Parish in 2024 (440 in 5+ unit buildings).
Forward outlook
- Local home prices are declining (-3.0%/yr); year-one equity from $899 of loan paydown is wiped out by about $4k of value loss. Plan a longer hold.
- East Baton Rouge County population projected at +4% by 2050 — modest demand growth; plan on rents tracking national, not racing it.
Negotiation context
- It's been on market 34 days — a 3% lower offer ($126k) is reasonable based on typical stale-listing flexibility.
- 4 sale attempts since 10y ago with the ask held roughly flat each time — persistent listings suggest the price (not the market) is what's stuck; bring a comps-based counter.
Risks & watch-outs
- Climate carrying-cost: severe wind risk, 99% chance of damaging wind over 30y; extreme-heat days projected 7→21/yr by 2055 (HVAC capex compounding) — expect insurance premiums to compound above CPI over the hold.
Questions for the listing agent
- It's been on market 34 days. Have you received any prior offers? Is the seller open to a 3% concession, seller financing, or rate buy-down credit?
- What does the HOA fee cover, when was the last increase, and are there any pending special assessments or reserve-fund shortfalls?
- Is there a deadline driving the sale (1031 exchange, divorce, estate, relocation)? That informs how much negotiation room exists.
- What's the average days-on-market for RENTAL listings here right now (not sales)? A rising rental-DOM trend means longer vacancies and softer asking-rent achievability than the comps imply.
- What's the recent tenant-quality profile in this submarket — average credit score on applications, eviction rate, late-payment / NSF rate, and stable-employment percentage? A property-management company in the area should have these aggregated.
- How much new for-sale + rental construction is in the pipeline within 1–3 miles? Heavy new supply typically softens prices + rents 12–24 months out; constrained supply supports both.
Investment metrics
- 1% rule
- 1.20% ✓
- Cap rate
- 9.35%
- Cash-on-cash
- 10.92%
- DSCR
- 1.49
- GRM
- 7.0
CMA / ARV
- ARV (median comp)
- $157,097
- List price
- $130,000
- Delta
- -17.25%
- Verdict
- UNDERPRICED
- Comps
- 20 within 1.0 mi
Show comp detail 12 sales within ~0.75 mi
| Address | Dist | Beds/Ba | Sqft | Sold | Price | $/sf | Match |
|---|---|---|---|---|---|---|---|
| 5345 Sleepy Hollow Dr | 0.09mi | 2/2.0 | 1,172 (-4%) | 6mo | $149,500 | $128 | 83 |
| 15474 Springwood Ave | 0.36mi | 2/2.0 | 1,218 (-1%) | 2mo | $149,500 | $123 | 80 |
| 5224 Cumberland Cove Dr | 0.10mi | 3/2.0 (+1) | 1,185 (-3%) | 12mo | $155,000 | $131 | 75 |
| 5111 Paducah Ct | 0.25mi | 3/2.0 (+1) | 1,263 (+3%) | 5mo | $199,500 | $158 | 74 |
| 5138 Cumberland Cove Dr | 0.05mi | 2/1.5 | 1,057 (-14%) | 4mo | $114,500 | $108 | 69 |
| 5101 Paducah Ct | 0.26mi | 3/2.0 (+1) | 1,320 (+8%) | 4mo | $199,500 | $151 | 66 |
| 5104 Berryville Ct | 0.17mi | 3/2.0 (+1) | 1,298 (+6%) | 13mo | $180,000 | $139 | 66 |
| 5219 Carnifix Ct | 0.31mi | 2/2.0 | 1,068 (-13%) | 1mo | $159,900 | $150 | 63 |
| 15512 Summerwood Ave | 0.30mi | 2/2.0 | 1,354 (+10%) | 10mo | $189,000 | $140 | 60 |
| 15463 Springwood Ave | 0.40mi | 2/2.0 | 1,382 (+13%) | 4mo | $159,000 | $115 | 57 |
| 5942 N Fort Clarke Dr | 0.57mi | 3/2.0 (+1) | 1,330 (+8%) | 2mo | $175,000 | $132 | 53 |
| 15443 Springwood Ave | 0.41mi | 3/2.0 (+1) | 1,348 (+10%) | 8mo | $219,000 | $162 | 53 |
Match score weights: distance 35% · size 25% · config 20% · recency 20%. Top-matched comps best support the ARV.
Projected returns pro-forma
-3.0% appreciation · 2.05% rent growth · sell at horizon
- IRR
- -1.0%
- Equity multiple
- 0.96×
- Total profit
- $-1,415
- Equity at exit
- $19,383
- IRR
- 7.6%
- Equity multiple
- 1.55×
- Total profit
- $20,101
- Equity at exit
- $11,240
Cash invested: $36,400 (down + closing). Projections, not guarantees.
Landlord ↔ Tenant lean methodology
- Overall (STATE)
- 90 Strongly Landlord-Friendly
- State Louisiana
- 90 Strongly Landlord-Friendly · R+12
- County
- — inherits STATE
- City
- — inherits STATE
ZIP-level market 70817
- Rents YoY
- 2.0%
- Active inventory
- 360
- Price-to-rent
- 7.0×
Monthly cashflow live
- Estimated rent
- $1,556 high interval (Pro) →
- Mortgage (P&I)
- −$682
- Tax from tax record
- −$141 /mo · $1,694/yr
- Insurance
- −$54
- HOA
- −$21
- Vacancy / Maint / Mgmt
- −$327
- Net cashflow
- $331
Break-even live
UW: 25.0% down · 7.5% · 30yr · 1.5% tax · 5.0% vac · 8.0% maint · 8.0% mgmt
Financing live
Cash to close
- Down payment
- $32,500
- Closing costs
- $3,900
- Reserves months
- —
- Total cash needed
- —
Loan-product check · same deal, 3 products live
Conventional
25% down · 7.5% · 30yr
- Down + closing
- —
- Monthly P&I
- —
- Monthly cashflow
- —
- DSCR
- —
- Eligible?
- —
Personal DTI + credit; lowest rate.
DSCR
20% down · 8.5% · 30yr
- Down + closing
- —
- Monthly P&I
- —
- Monthly cashflow
- —
- DSCR
- —
- Eligible?
- —
No personal income docs; deal must DSCR.
Hard money
10% down · 12.0% · 12mo
- Down + closing
- —
- Monthly P&I
- —
- Monthly cashflow
- —
- DSCR
- —
- Eligible?
- —
Short-term bridge; refi at stabilization.
Rent comps 20 comps
| Address | Beds | Baths | Sqft | Rent | $/sqft | DOM | Units | Dist |
|---|---|---|---|---|---|---|---|---|
| 5157 Cumberland Cove Dr Baton Rouge, LA | 3.0 | 2.0 | 1159 | $1,650 | $1.42 | 14d | 1 | 0.07mi |
| 5213 Berryville Ct Baton Rouge, LA | 3.0 | 2.0 | 1237 | $1,750 | $1.41 | 14d | 1 | 0.16mi |
| 15580 George Oneal Rd Baton Rouge, LA | 1.0–3.0 | 1.0–2.0 | 1063 | $1,245 | $1.17 | 14d | 8 | 0.17mi |
| 4844 Mokki Ln Baton Rouge, LA | 3.0 | 2.0 | 1440 | $1,690 | $1.17 | 43d | 1 | 0.18mi |
| 4804 Mokki Ln Baton Rouge, LA | 3.0 | 2.0 | 1440 | $1,875 | $1.30 | 21d | 1 | 0.21mi |
| 15444 Summerwood Ave Baton Rouge, LA | 2.0 | 2.0 | 1323 | $1,650 | $1.25 | 23d | 1 | 0.33mi |
| 4810 Kennesaw Dr Unit 4810-C Baton Rouge, LA | 3.0 | 2.0 | 1275 | $1,100 | $0.86 | 43d | 1 | 0.40mi |
| 16534 George Oneal Rd Apt C Baton Rouge, LA | 2.0 | 1.5 | 900 | $950 | $1.06 | 23d | 1 | 0.48mi |
| 3482 King Bradford Dr Baton Rouge, LA | 2.0 | 2.0 | 980 | $1,100 | $1.12 | 23d | 1 | 1.01mi |
| 15959 Tiger Bend Rd Baton Rouge, LA | 1.0–2.0 | 1.0–1.5 | 934 | $1,265 | $1.35 | 14d | 3 | 1.04mi |
| 13675 Coursey Blvd Baton Rouge, LA | 1.0–3.0 | 1.0–2.0 | 951 | $1,130 | $1.19 | 43d | 23 | 1.04mi |
| 3412 Yorkfield Dr Baton Rouge, LA | 2.0 | 1.5 | 1128 | $950 | $0.84 | 43d | 1 | 1.11mi |
| 3412 Yorkfield Dr Unit D Baton Rouge, LA | 2.0 | 1.5 | 1010 | $1,000 | $0.99 | 43d | 1 | 1.11mi |
| 3412 Yorkfield Dr Unit D Baton Rouge, LA | 2.0 | 1.5 | 1010 | $900 | $0.89 | 23d | 1 | 1.11mi |
| 17235 Terrance Ave Baton Rouge, LA | 3.0 | 2.0 | 1256 | $1,590 | $1.27 | 14d | 1 | 1.24mi |
| 2931 Niccoline Way Baton Rouge, LA | 3.0 | 2.0 | 1436 | $2,000 | $1.39 | 43d | 1 | 1.36mi |
| 16625 Poe Ave Baton Rouge, LA | 3.0–5.0 | 2.0–3.0 | 1698 | $1,895 | $1.12 | 44d | 1 | 1.36mi |
| 2989 O'Neal Ln Unit 2989 Baton Rouge, LA | 2.0 | 1.5 | 1073 | $900 | $0.84 | 43d | 1 | 1.37mi |
| 16218 Thorncrown Ln Baton Rouge, LA | 2.0 | 2.0 | 1383 | $1,800 | $1.30 | 44d | 1 | 1.38mi |
| 14020 Tiger Bend Rd Apt 4 Baton Rouge, LA | 2.0 | 1.5 | 1176 | $1,100 | $0.94 | 43d | 1 | 1.50mi |
HOA detail
- Monthly dues
- $21 · $252/yr
Listing history 23 events
-
2026-06-18days on market $130,000 Active 34 DOM
-
2026-06-17days on market $130,000 Active 33 DOM
-
2026-06-16days on market $130,000 Active 32 DOM
-
2026-06-15days on market $130,000 Active 31 DOM
-
2026-06-14days on market $130,000 Active 29 DOM
-
2026-06-10days on market $130,000 Active 26 DOM
-
2026-06-09days on market $130,000 Active 25 DOM
-
2026-06-08days on market $130,000 Active 24 DOM
-
2026-06-07days on market $130,000 Active 23 DOM
-
2026-06-05days on market $130,000 Active 20 DOM
-
2026-06-03days on market $130,000 Active 19 DOM
-
2026-06-02days on market $130,000 Active 18 DOM
-
2026-06-01days on market $130,000 Active 17 DOM
-
2026-05-31days on market $130,000 Active 16 DOM
-
2026-05-31days on market $130,000 Active 15 DOM
-
2026-05-15$130,000 Active 564-char remark
Show marketing remark (559 chars)
2-bedroom, 2-full-bath home in Cumberland Cove featuring a fireplace, computer nook, and garden window over the kitchen sink -- perfect for herbs, plants, or added natural light. The backyard includes two storage sheds for extra storage, and the property also offers covered parking for two vehicles. Conveniently located near shopping, dining, major roadways, and everyday amenities. Located in flood zone X. Needs some TLC and offers a great opportunity for a buyer ready to add personal touches or explore investment potential. Schedule your showing today.
-
2026-05-15$130,000 Active 559-char remark
Show marketing remark (559 chars)
2-bedroom, 2-full-bath home in Cumberland Cove featuring a fireplace, computer nook, and garden window over the kitchen sink -- perfect for herbs, plants, or added natural light. The backyard includes two storage sheds for extra storage, and the property also offers covered parking for two vehicles. Conveniently located near shopping, dining, major roadways, and everyday amenities. Located in flood zone X. Needs some TLC and offers a great opportunity for a buyer ready to add personal touches or explore investment potential. Schedule your showing today.
-
2016-10-25soldstatus Sold
Show marketing remark (77 chars)
Newly updated. New floors, countertops, paint, roof, etc. Will not last long!
-
2016-09-06status Pending
Show marketing remark (77 chars)
Newly updated. New floors, countertops, paint, roof, etc. Will not last long!
-
2016-09-04price $104,900
Show marketing remark (77 chars)
Newly updated. New floors, countertops, paint, roof, etc. Will not last long!
-
2016-09-04$99,900 Active
Show marketing remark (77 chars)
Newly updated. New floors, countertops, paint, roof, etc. Will not last long!
-
2016-09-03$104,900
-
1996-05-02soldstatus
ⓘ Source: listings_history table (triggers on properties + properties_extension) + one-shot
backfill from property_details.listing_events for pre-trigger history.
Tax reassessment forecast LA · Resets to sale price
- Current annual tax
- $1,694 · $141/mo
- Projected year-2 tax
- $1,694 · $141/mo
- Expected delta
- $0/yr ($0/mo · 0.0%)
ⓘ Screening estimate from a state-policy table — verify with the county assessor before closing.
Climate risk First Street
- Flood 1/10 Low FEMA zone X · 0% chance over 30 yrs
- Wildfire 1/10 Low
- Heat 8/10 Severe 7 d/yr ≥108°F today · 21 d/yr by 30 yrs out
- Wind 9/10 Extreme 99% chance of damaging wind over 30 yrs
- Air quality 3/10 Moderate 2 unhealthy d/yr today · 3 by 30 yrs out
Nearby sold comps map
Loading sold comps map…
Walkable amenities ~0.75 mi
Loading nearby amenities…
Taxation est. · year 1
- Rental income
- $18,674
- − Mortgage interest
- −$7,282
- − Property taxes
- −$1,694
- − Insurance
- −$650
- − Repairs & maintenance
- −$1,494
- − Management
- −$1,494
- − HOA
- −$252
- − Depreciation
- −$3,782
- Taxable income
- $2,026
- Est. tax owed @ 24.0%
- −$486
- After-tax cash flow
- $3,489/yr
For passive investors: Depreciation is non-cash, so a rental often shows a tax loss while cash-flowing — sheltering income. Rental losses are passive: they offset passive income freely, and up to $25,000/yr can offset ordinary (W-2) income if you actively participate and your MAGI is under $100k (phasing out to $0 by $150k); unused losses carry forward. On sale, claimed depreciation is recaptured at up to 25%, and gains may owe capital-gains tax (a 1031 exchange can defer both). Figures are a year-1 estimate at your 24.0% rate — not tax advice; consult a CPA.
Schools (NCES district)
- District
- East Baton Rouge Parish
- NCES district ID
- 2200540
- Math proficiency
- 22% ▼ -36.00%
- Reading proficiency
- 34% ▼ -31.00%
- Median HH income
- $46,263
- Composite
- 24.14/100
- National rank
- #7745
- State rank
- #47 of 98 in LA
Livability — Shenandoah
- Score
- 76/100
- State rank
- #16
- US rank
- #3778
Category grades
Schools grade is shown separately in the Schools card above.
Census & demographics
- Census place
- Shenandoah, LA
- County
- East Baton Rouge Parish · 399,686 people
- Metro
- Baton Rouge, LA
- Population (ZIP)
- 33,482
- Household income
- $102,639
- Rent vs Own
- Severe rent burden
- 755.0
Population outlook (East Baton Rouge County) Hauer SSP2
- Today (2025)
- 464,810 people
- By 2030
- 472,137 · +1.6%
- By 2040
- 480,243 · +3.3%
- By 2050
- 484,422 · +4.2%
- By 2075
- 492,069 · +5.9%
- By 2100
- 476,347 · +2.5%
Race, ethnicity, and origin ACS 2023
- Neighborhood character
- Majority White (64%)
- Race & ethnicity
- White 64% Black 21% Two or more races 9% Hispanic / Latino 5% Asian 3%
- Common ancestry
- Lithuanian 13% Italian 2% Serbian 2%
- Foreign-born
- 6% · Canada, Vietnam, China
- Languages at home
- 91% English-only · Spanish 3% Arabic 1% Vietnamese 1%
Political lean MEDSL · East Baton Rouge
- 2024 margin
- D (+11.1) · D 54.5% · R 43.4% · Other 2.1%
- 2008→2024 swing
- +8.9pp toward D · 2008: 2.2pp · 2024: 11.1pp
- All cycles
- 2024: D+11.1 2020: D+13.1 2016: D+9.2 2012: D+5.2 2008: D+2.2
Not yet ingested
- Civics
- —
Market trends
- HPI YoY
- ▼ -149.27%
- Current HPI
- 170.6826
- Rent YoY
- ▲ 2.05%
- Metro
- Baton Rouge, LA
- State GDP YoY
- ▲ 3.29%
- F500 in state
- 10
Industry mix (Fortune 500 HQ in LA)
| Industry | F500 HQs | Revenue |
|---|---|---|
| Telecommunications | 2 | $23B |
|
||
| Utilities | 1 | $12B |
|
||
| Wholesale / Distribution | 1 | $5B |
|
||
| Advertising | 1 | $2B |
|
||
Price history
+23.9% since first listed8 events — show timeline
- 2026-05-15 Listed $130,000 AcadianaMLS
- 2026-05-15 Listed $130,000 GBRMLS
- 2016-10-25 Sold (MLS) — GBRMLS
- 2016-09-06 Pending — GBRMLS
- 2016-09-04 Price Changed $104,900 GBRMLS
- 2016-09-04 Listed $99,900 GBRMLS
- 2016-09-03 Listed $104,900 AcadianaMLS
- 1996-05-02 Sold (Public Records) — Public Records
Property tax history
+4.1%/yrLatest (2025): $1,694 · -0.5% YoY. Source: county tax records.
Cash-flow waterfall
monthlySold comps — $/sqft
last 12 mo · ≤1 miLoading sold comps…