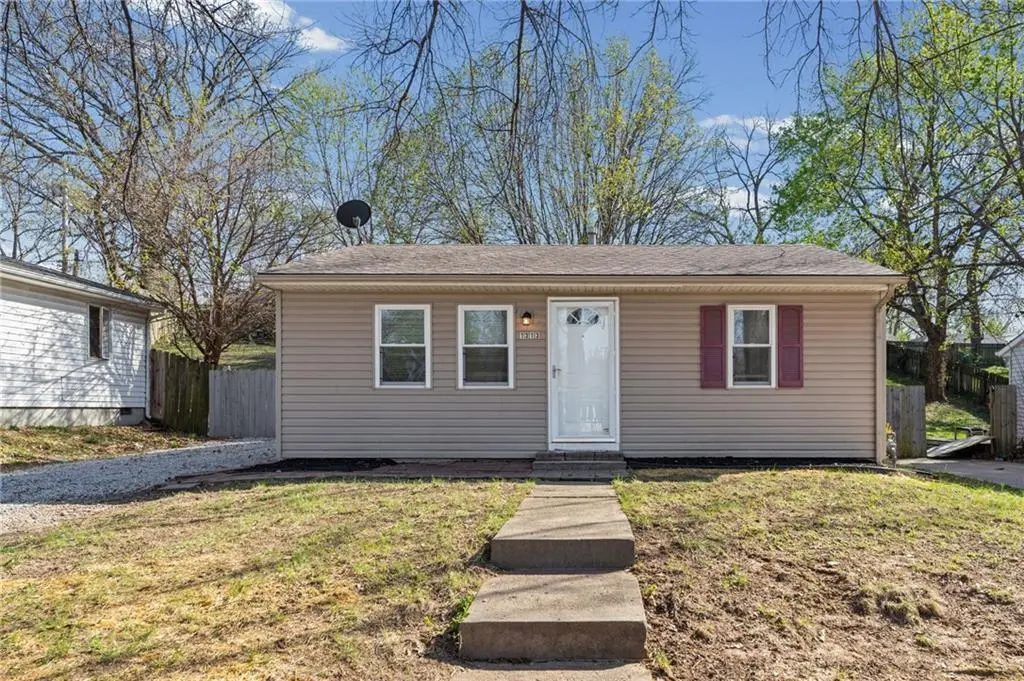
1313 NE 44th St · Kansas City, MO
Flood risk 1/10 · Minimal
- FEMA flood zone
- X (unshaded)
- Chance of flooding over 30 yrs
- 0.0%
- Est. flood insurance / yr
- $507 – $1,088
Fire risk 1/10 · Minimal
- Est. fire insurance / yr
- $1,054 – $1,958
Heat risk 4/10 · Minor
- Hot days now (above 107°F)
- 7 days/yr
- Hot days in 30 yrs
- 17 days/yr
Wind risk 2/10 · Minimal
- Chance of severe wind over 30 yrs
- —
Air-quality risk 3/10 · Minor
- Unhealthy air days now
- 2 days/yr
- Unhealthy air days in 30 yrs
- 3 days/yr
Risk factors via First Street. Map © Google.
Why this score? — see what drove the C- grade
The composite is a weighted blend of 9 inputs, each scored 0–100. Each bar is that input's sub-score; the figure is the points it added to the 100-point composite (weight × sub-score).
- Cash flow +18.4/30.0
- ARV discount +9.9/15.0
- DSCR +5.8/10.0
- 1% rule +4.2/10.0
- Livability +3.9/5.0
- Schools +3.8/10.0
- Rent growth +3.7/5.0
- Condition / age +2.5/5.0
- Appreciation +0.0/10.0
$149,000
🖨 Deal sheet 📄 Offer letter ✓ Due diligence
Listing remarks MLS
HUD property being sold As-Is. Move right in to this adorable 2 bedroom, 1 bath Ranch home with large fenced in back yard and Shed for additional storage! Hardwood floors! Kitchen features a pass thru window for easy entertaining! Perfect starter home! Call the listing office for assistance with the bidding process. Owner Occupied bids only, until day 31. FOR UTILITY TURN ONS, APPROVAL MUST BE GRANTED IN ADVANCE FROM HUD’S FIELD SERVICE MANAGER. IN CASES WHERE PLUMBING DEFICIENCIES EXIST, APPROVAL FOR WATER TURN-ON MAY BE DENIED.
Key facts
- Vinyl windows
- New flooring
- Updated kitchen
Tags
Property features AI
Finance
- Other: Living area reported as 725 (above grade); Property listed as Residential — Single Family Residence
- Financial info: Annual tax amount available
- HOA & community: No association fees
Exterior
- Parking: Off-street parking
- Utilities: Public water; Public sewer
- Home design: Single-family residence; Ranch floor plan
- Construction: Vinyl siding; Composition roof; Estimated age: 51–75 years
- Exterior features: Lot approximately 7,841 square feet; Flood plain status: Unknown
Interior
- Kitchen: Laundry located in the kitchen
- Bedrooms: 2 bedrooms
- Flooring: Wood
- Bathrooms: 1 full bathroom
- Heating & cooling: Forced air heating; No central air
- Interior features: Wood flooring; Crawl space basement
- Laundry & utility: Laundry in kitchen
Neighborhood map
What this means for you Summary
Snapshot
- This is a 2-bed/1.0-bath single-family listed at $149k.
Deal economics
- At list price, monthly cash flow is $139 ($2k/yr) — positive.
- The deal already cash-flows at list — no discount required.
- To meet the 1% rule (rent ≥ 1% of price), the offer needs to be $137k (8.0% below list).
- Recommended offer: $137k (8.0% below list) — sets the bar for 1% rule.
- Cap rate 7.4% vs local median 3.9% in Kansas City — top-decile yield for the area; either an underpriced asset or a hidden risk that comps aren't pricing in. Stress-test before assuming the spread holds.
Location & tenants
- Location reads 78/100 on livability (#28 in MO, #2,671 nationally) — a middle-class / working-renter tenant base. Strengths: amenities A+, commute A+, cost of living A+; Watch: schools C-, crime F.
- North Kansas City 74 (urban): math 38% / reading 49% proficiency, ranked #98 of 324 in MO (top 30%) — families likely to look elsewhere, expect single-tenant / working-renter base with shorter leases.
- Market conditions: Rents rising fast (+4.7%/yr); 88 active listings in the ZIP; 5 comparable units currently listed for rent nearby; rentals at typical pace (median 20d on market — plan ~3-4 weeks tenant-placement turnaround); 341 units permitted in Clay County in 2024 (40 in 5+ unit buildings).
Forward outlook
- Local home prices are declining (-3.0%/yr); year-one equity from $1k of loan paydown is wiped out by about $4k of value loss. Plan a longer hold.
- Clay County population projected at +24% by 2050 — long-run rental-demand tailwind backs the buy-and-hold thesis.
Negotiation context
- Only 5 days on market — expect competitive offers; lowballing is unlikely to land.
- 5 sale attempts since 18y ago with the ask held roughly flat each time — persistent listings suggest the price (not the market) is what's stuck; bring a comps-based counter.
Risks & watch-outs
- Watch-outs: built in 1952 — expect roof / HVAC / electrical / plumbing capex.
Questions for the listing agent
- Built in 1952 — when were the roof, HVAC, electrical panel, plumbing, and water heater last replaced?
- Is there a deadline driving the sale (1031 exchange, divorce, estate, relocation)? That informs how much negotiation room exists.
- Crime grade is F in this area — have there been break-ins, vandalism, or insurance claims at this property in the last 3 years? What carrier currently insures it and at what premium?
- What's the average days-on-market for RENTAL listings here right now (not sales)? A rising rental-DOM trend means longer vacancies and softer asking-rent achievability than the comps imply.
- What's the recent tenant-quality profile in this submarket — average credit score on applications, eviction rate, late-payment / NSF rate, and stable-employment percentage? A property-management company in the area should have these aggregated.
- How much new for-sale + rental construction is in the pipeline within 1–3 miles? Heavy new supply typically softens prices + rents 12–24 months out; constrained supply supports both.
Investment metrics
- 1% rule
- 0.92% ✗
- Cap rate
- 7.41%
- Cash-on-cash
- 4.00%
- DSCR
- 1.18
- GRM
- 9.1
CMA / ARV
- ARV (on-the-fly)
- $157,325
- Comps found
- 12
Show comp detail 12 sales within ~0.75 mi
| Address | Dist | Beds/Ba | Sqft | Sold | Price | $/sf | Match |
|---|---|---|---|---|---|---|---|
| 1313 NE 44th St | 0.00mi | 2/1.0 | 725 (0%) | 0mo | $149,000 | $206 | 100 |
| 1321 NE 44th St | 0.02mi | 2/1.0 | 725 (0%) | 8mo | $145,000 | $200 | 93 |
| 1224 NE 43rd Ter | 0.05mi | 2/1.0 | 688 (-5%) | 0mo | $160,000 | $233 | 89 |
| 4223 N Virginia Ave | 0.12mi | 2/1.0 | 736 (+2%) | 4mo | $160,000 | $217 | 88 |
| 4504 N Campbell St | 0.31mi | 2/1.0 | 688 (-5%) | 6mo | $155,000 | $225 | 72 |
| 1001 NE 45th St | 0.22mi | 3/2.0 (+1) | 752 (+4%) | 4mo | $185,000 | $246 | 71 |
| 4617 N Troost Ave | 0.26mi | 2/1.0 | 816 (+13%) | 7mo | $149,900 | $184 | 60 |
| 1001 NE 44th St | 0.20mi | 3/1.0 (+1) | 832 (+15%) | 2mo | $167,000 | $201 | 60 |
| 1104 NE 43rd Ter | 0.14mi | 3/1.0 (+1) | 832 (+15%) | 9mo | $199,000 | $239 | 56 |
| 4319 N Campbell Ave | 0.23mi | 3/1.0 (+1) | 832 (+15%) | 8mo | $175,000 | $210 | 53 |
| 4617 Kelsey Rd | 0.70mi | 2/1.0 | 768 (+6%) | 6mo | $155,000 | $202 | 52 |
| 4533 N Locust St | 0.62mi | 2/1.0 | 800 (+10%) | 7mo | $194,999 | $244 | 48 |
Match score weights: distance 35% · size 25% · config 20% · recency 20%. Top-matched comps best support the ARV.
Projected returns pro-forma
-3.0% appreciation · 4.74% rent growth · sell at horizon
- IRR
- -8.3%
- Equity multiple
- 0.69×
- Total profit
- $-12,883
- Equity at exit
- $22,216
- IRR
- 3.2%
- Equity multiple
- 1.25×
- Total profit
- $10,428
- Equity at exit
- $12,883
Cash invested: $41,720 (down + closing). Projections, not guarantees.
Landlord ↔ Tenant lean methodology
- Overall (STATE)
- 81 Strongly Landlord-Friendly
- State Missouri
- 81 Strongly Landlord-Friendly · R+10
- County
- — inherits STATE
- City
- — inherits STATE
ZIP-level market 64116
- Rents YoY
- 4.7%
- Active inventory
- 88
- Price-to-rent
- 9.1×
Monthly cashflow live
- Estimated rent
- $1,370 medium interval (Pro) →
- Mortgage (P&I)
- −$781
- Tax from tax record
- −$100 /mo · $1,201/yr
- Insurance
- −$62
- HOA
- −$0
- Vacancy / Maint / Mgmt
- −$288
- Net cashflow
- $139
Break-even live
UW: 25.0% down · 7.5% · 30yr · 1.5% tax · 5.0% vac · 8.0% maint · 8.0% mgmt
Financing live
Cash to close
- Down payment
- $37,250
- Closing costs
- $4,470
- Reserves months
- —
- Total cash needed
- —
Loan-product check · same deal, 3 products live
Conventional
25% down · 7.5% · 30yr
- Down + closing
- —
- Monthly P&I
- —
- Monthly cashflow
- —
- DSCR
- —
- Eligible?
- —
Personal DTI + credit; lowest rate.
DSCR
20% down · 8.5% · 30yr
- Down + closing
- —
- Monthly P&I
- —
- Monthly cashflow
- —
- DSCR
- —
- Eligible?
- —
No personal income docs; deal must DSCR.
Hard money
10% down · 12.0% · 12mo
- Down + closing
- —
- Monthly P&I
- —
- Monthly cashflow
- —
- DSCR
- —
- Eligible?
- —
Short-term bridge; refi at stabilization.
Rent comps 5 comps
| Address | Beds | Baths | Sqft | Rent | $/sqft | DOM | Units | Dist |
|---|---|---|---|---|---|---|---|---|
| 1300 NE Parvin Rd Kansas City, MO | 1.0–2.0 | 1.0–2.0 | 881 | $1,530 | $1.74 | 1d | 15 | 0.23mi |
| 5000 N Oak Trfy Kansas City, MO | 3.0 | 1.0–2.0 | 1225 | $1,163 | $0.95 | 43d | 1 | 1.04mi |
| 4140 N Walrond Ave Unit 1-40010 Kansas City, MO | 2.0 | 1.0 | 732 | $1,000 | $1.37 | 20d | 1 | 1.19mi |
| 4140 N Walrond Ave Unit 1-40108 Kansas City, MO | 1.0 | 1.0 | 643 | $900 | $1.40 | 21d | 1 | 1.19mi |
| 3350 N Holmes St Kansas City, MO | 2.0 | 1.0–2.5 | 975 | $3,329 | $3.41 | 1d | 91 | 1.32mi |
Listing history 11 events
-
2026-04-14status Pending
-
2026-04-09$149,000 Active
-
2026-01-08soldstatus
-
2013-06-12soldstatus 543-char remark
Show marketing remark (543 chars)
HUD property being sold As-Is. Move right in to this adorable 2 bedroom, 1 bath Ranch home with large fenced in back yard and Shed for additional storage! Hardwood floors! Kitchen features a pass thru window for easy entertaining! Perfect starter home! Call the listing office for assistance with the bidding process. Owner Occupied bids only, until day 31. FOR UTILITY TURN ONS, APPROVAL MUST BE GRANTED IN ADVANCE FROM HUD’S FIELD SERVICE MANAGER. IN CASES WHERE PLUMBING DEFICIENCIES EXIST, APPROVAL FOR WATER TURN-ON MAY BE DENIED.
-
2013-03-13$27,000 543-char remark
Show marketing remark (543 chars)
HUD property being sold As-Is. Move right in to this adorable 2 bedroom, 1 bath Ranch home with large fenced in back yard and Shed for additional storage! Hardwood floors! Kitchen features a pass thru window for easy entertaining! Perfect starter home! Call the listing office for assistance with the bidding process. Owner Occupied bids only, until day 31. FOR UTILITY TURN ONS, APPROVAL MUST BE GRANTED IN ADVANCE FROM HUD’S FIELD SERVICE MANAGER. IN CASES WHERE PLUMBING DEFICIENCIES EXIST, APPROVAL FOR WATER TURN-ON MAY BE DENIED.
-
2008-11-15$80,000
-
2008-10-10historical
-
2008-08-11$82,900
-
2008-06-25$87,900
-
2005-05-26soldstatus
-
2004-08-25soldstatus
ⓘ Source: listings_history table (triggers on properties + properties_extension) + one-shot
backfill from property_details.listing_events for pre-trigger history.
Tax reassessment forecast MO · Resets to sale price
- Current annual tax
- $1,201 · $100/mo
- Projected year-2 tax
- $1,445 · $120/mo
- Expected delta
- +$244/yr (+$20/mo · 20.3%)
ⓘ Screening estimate from a state-policy table — verify with the county assessor before closing.
Climate risk First Street
- Flood 1/10 Low FEMA zone X (unshaded) · 0% chance over 30 yrs
- Wildfire 1/10 Low
- Heat 4/10 Moderate 7 d/yr ≥107°F today · 17 d/yr by 30 yrs out
- Wind 2/10 Low
- Air quality 3/10 Moderate 2 unhealthy d/yr today · 3 by 30 yrs out
Nearby sold comps map
Loading sold comps map…
Walkable amenities ~0.75 mi
Loading nearby amenities…
Taxation est. · year 1
- Rental income
- $16,444
- − Mortgage interest
- −$8,346
- − Property taxes
- −$1,201
- − Insurance
- −$745
- − Repairs & maintenance
- −$1,315
- − Management
- −$1,315
- − Depreciation
- −$4,335
- Taxable loss
- −$814
- Est. tax savings @ 24.0%
- +$195
- After-tax cash flow
- $1,863/yr
For passive investors: Depreciation is non-cash, so a rental often shows a tax loss while cash-flowing — sheltering income. Rental losses are passive: they offset passive income freely, and up to $25,000/yr can offset ordinary (W-2) income if you actively participate and your MAGI is under $100k (phasing out to $0 by $150k); unused losses carry forward. On sale, claimed depreciation is recaptured at up to 25%, and gains may owe capital-gains tax (a 1031 exchange can defer both). Figures are a year-1 estimate at your 24.0% rate — not tax advice; consult a CPA.
Schools (NCES district)
- District
- North Kansas City 74
- NCES district ID
- 2922800
- Math proficiency
- 38% ▼ -11.00%
- Reading proficiency
- 49% ▼ -3.00%
- Median HH income
- $55,444
- Composite
- 37.88/100
- National rank
- #4321
- State rank
- #98 of 324 in MO
Livability — Kansas City
- Score
- 78/100
- State rank
- #28
- US rank
- #2671
Category grades
Schools grade is shown separately in the Schools card above.
Census & demographics
- Census place
- Kansas City, MO
- County
- Clay County · 220,651 people
- City population
- 439,467
- Metro
- Kansas City, MO-KS
- Population (ZIP)
- 18,046
- Household income
- $64,123
- Rent vs Own
- Severe rent burden
- 844.0
Population outlook (Clay County) Hauer SSP2
- Today (2025)
- 266,022 people
- By 2030
- 280,057 · +5.3%
- By 2040
- 306,153 · +15.1%
- By 2050
- 328,630 · +23.5%
- By 2075
- 375,182 · +41.0%
- By 2100
- 392,861 · +47.7%
Race, ethnicity, and origin ACS 2023
- Neighborhood character
- Diverse neighborhood (Simpson 0.57)
- Race & ethnicity
- White 63% Two or more races 15% Black 12% Hispanic / Latino 10% Asian 3%
- Hispanic origin (detail)
- Mexican 5% Puerto Rican 2%
- Common ancestry
- Italian 3% Serbian 2% Lithuanian 2%
- Foreign-born
- 8% · Canada, Vietnam, Jamaica
- Languages at home
- 91% English-only · Arabic 2% Spanish 2% Vietnamese 2%
Political lean MEDSL · Clay
- 2024 margin
- Lean R (+5.6) · D 46.4% · R 52.0% · Other 1.6%
- 2008→2024 swing
- -4.9pp toward R · 2008: -0.7pp · 2024: -5.6pp
- All cycles
- 2024: R+5.6 2020: R+4.1 2016: R+11.1 2012: R+8.4 2008: R+0.7
Not yet ingested
- Civics
- —
Market trends
- HPI YoY
- ▼ -180.14%
- Current HPI
- 256.6222
- Rent YoY
- ▲ 4.74%
- Metro
- Kansas City, MO-KS
- State GDP YoY
- ▲ 1.84%
- F500 in state
- 20
Industry mix (Fortune 500 HQ in MO)
| Industry | F500 HQs | Revenue |
|---|---|---|
| Healthcare | 1 | $163B |
|
||
| Insurance | 1 | $21B |
|
||
| Industrial Technology | 1 | $17B |
|
||
| Retail | 1 | $16B |
|
||
| Industrial Distribution | 1 | $10B |
|
||
| Utilities | 1 | $9B |
|
||
Price history
+69.5% since first listed11 events — show timeline
- 2026-04-14 Pending — Heartland MLS as Distributed by MLS Grid
- 2026-04-09 Listed $149,000 Heartland MLS as Distributed by MLS Grid
- 2026-01-08 Sold (Public Records) — Public Records
- 2013-06-12 Sold (MLS) — Heartland MLS as Distributed by MLS Grid
- 2013-03-13 Listed $27,000 Heartland MLS as Distributed by MLS Grid
- 2008-11-15 Listed $80,000 Heartland MLS as Distributed by MLS Grid
- 2008-10-10 Listing Removed — Heartland MLS as Distributed by MLS Grid
- 2008-08-11 Listed $82,900 Heartland MLS as Distributed by MLS Grid
- 2008-06-25 Listed $87,900 Heartland MLS as Distributed by MLS Grid
- 2005-05-26 Sold (Public Records) — Public Records
- 2004-08-25 Sold (Public Records) — Public Records
Property tax history
+2.9%/yrLatest (2025): $1,201 · +12.4% YoY. Source: county tax records.
Cash-flow waterfall
monthlySold comps — $/sqft
last 12 mo · ≤1 miLoading sold comps…