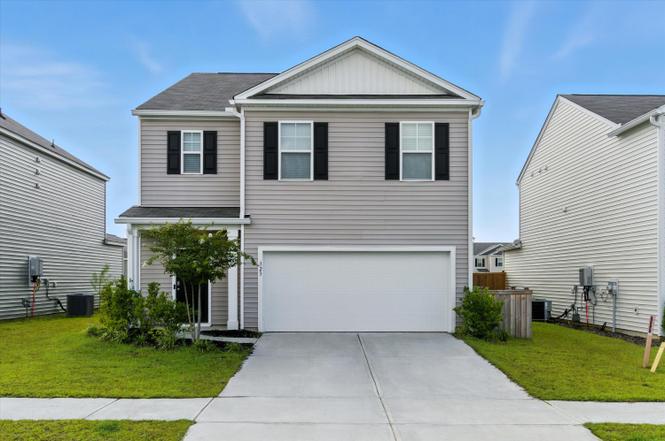
323 Bear Paw Ln · Summerville, SC
Flood risk 1/10 · Minimal
- FEMA flood zone
- X (unshaded)
- Chance of flooding over 30 yrs
- 0.0%
- Est. flood insurance / yr
- $507 – $1,088
Fire risk 5/10 · Moderate
- Est. fire insurance / yr
- $783 – $1,453
Heat risk 8/10 · Major
- Hot days now (above 107°F)
- 7 days/yr
- Hot days in 30 yrs
- 16 days/yr
Wind risk 8/10 · Major
- Chance of severe wind over 30 yrs
- 80.0%
Air-quality risk 2/10 · Minimal
- Unhealthy air days now
- 2 days/yr
- Unhealthy air days in 30 yrs
- 2 days/yr
Risk factors via First Street. Map © Google.
Why this score? — see what drove the D+ grade
The composite is a weighted blend of 9 inputs, each scored 0–100. Each bar is that input's sub-score; the figure is the points it added to the 100-point composite (weight × sub-score).
- ARV discount +15.0/15.0
- Cash flow +12.2/30.0
- DSCR +3.6/10.0
- Schools +3.6/10.0
- Rent growth +3.2/5.0
- Livability +3.2/5.0
- Condition / age +2.5/5.0
- 1% rule +2.4/10.0
- Appreciation +0.0/10.0
$374,999
🖨 Deal sheet 📄 Offer letter ✓ Due diligence
Listing remarks MLS
Pine Hills is the tri-county area's most awaited master planned community. Featuring amenities like a resort style pool, walking and bike paths and a campsite, you never have to leave home to feel like you're on vacation. The Robie floorplan features a large living space with a separate dining area and kitchen island, as well as a guest suite on the first floor. You are greeted by a versatile loft on the second floor, as well as the laundry room, primary bedroom with a walk-in closet, and three additional bedrooms. Photos are a depiction of a similar home.
Key facts
- Ample cabinetry
- Full bath
- Large island
Tags
Neighborhood map
What this means for you Summary
Snapshot
- This is a 5-bed/3.0-bath single-family listed at $375k.
Deal economics
- At list price, monthly cash flow is $-75 ($-897/yr) — negative.
- To cash-flow at today's rent, offer at most $362k (3.5% below list).
- To meet the 1% rule (rent ≥ 1% of price), the offer needs to be $278k (26.0% below list).
- Recommended offer: $278k (26.0% below list) — sets the bar for 1% rule.
- Cap rate 6.1% vs local median 4.0% in Summerville — top-decile yield for the area; either an underpriced asset or a hidden risk that comps aren't pricing in. Stress-test before assuming the spread holds.
Location & tenants
- Location reads 63/100 on livability (#167 in SC) — a middle-class / working-renter tenant base. Strengths: housing A+, cost of living B+; Watch: amenities F, commute F, health & safety F.
- Berkeley 01 (suburban): math 35% / reading 48% proficiency, ranked #30 of 80 in SC (top 38%) — families likely to look elsewhere, expect single-tenant / working-renter base with shorter leases.
- Zoned schools: Whitesville Elementary (math 34% / reading 39%, grade F, #328 of 597 statewide, top 55%, 1,031 students, 62% FRL); Berkeley Middle (math 19% / reading 32%, grade F, #162 of 229 statewide, top 71%, 1,403 students, 57% FRL); Berkeley High (math 36% / reading 83%, grade C+, #110 of 196 statewide, top 58%, 1,776 students, 50% FRL).
- Market conditions: Rents rising (+2.7%/yr); 1283 active listings in the ZIP; 20 comparable units currently listed for rent nearby; rentals at typical pace (median 14d on market — plan ~3-4 weeks tenant-placement turnaround); solid renter incomes; 3,183 units permitted in Berkeley County in 2024 (580 in 5+ unit buildings).
- This rent runs 37% of the median local income ($90k/yr) — at the standard rent-burdened threshold; future hikes will face affordability resistance.
Forward outlook
- Local home prices are declining (-3.0%/yr); year-one equity from $3k of loan paydown is wiped out by about $11k of value loss. Plan a longer hold.
- Berkeley County population projected at +48% by 2050 — long-run rental-demand tailwind backs the buy-and-hold thesis.
Negotiation context
- It's been on market 83 days — a 6% lower offer ($352k) is reasonable based on typical stale-listing flexibility.
- 3 sale attempts since 4y ago with the ask held roughly flat each time — persistent listings suggest the price (not the market) is what's stuck; bring a comps-based counter.
Risks & watch-outs
- Climate carrying-cost: severe wind risk, 80% chance of damaging wind over 30y; moderate wildfire risk; extreme-heat days projected 7→16/yr by 2055 (HVAC capex compounding) — expect insurance premiums to compound above CPI over the hold.
Questions for the listing agent
- What do current leases actually rent for vs. the listed asking? Can we see a recent rent roll and the last 12 months of T-12 income?
- It's been on market 83 days. Have you received any prior offers? Is the seller open to a 26% concession, seller financing, or rate buy-down credit?
- Why hasn't it sold? Are there any deal-killer items the seller is aware of (foundation, flood, title, zoning, code violations)?
- Is there a deadline driving the sale (1031 exchange, divorce, estate, relocation)? That informs how much negotiation room exists.
- Schools are B-rated — typically a magnet for longer-tenancy family renters. What's the average tenant stay here, and is there a school-zone premium baked into asking?
- The area grade is low — what's the realistic commute time and amenity access for the typical tenant pool here? Any planned neighborhood developments (good or bad) we should know about?
- What's the average days-on-market for RENTAL listings here right now (not sales)? A rising rental-DOM trend means longer vacancies and softer asking-rent achievability than the comps imply.
- What's the recent tenant-quality profile in this submarket — average credit score on applications, eviction rate, late-payment / NSF rate, and stable-employment percentage? A property-management company in the area should have these aggregated.
- How much new for-sale + rental construction is in the pipeline within 1–3 miles? Heavy new supply typically softens prices + rents 12–24 months out; constrained supply supports both.
Investment metrics
- 1% rule
- 0.74% ✗
- Cap rate
- 6.05%
- Cash-on-cash
- -0.85%
- DSCR
- 0.96
- GRM
- 11.3
CMA / ARV
- ARV (on-the-fly)
- $452,892
- Comps found
- 12
Show comp detail 12 sales within ~0.75 mi
| Address | Dist | Beds/Ba | Sqft | Sold | Price | $/sf | Match |
|---|---|---|---|---|---|---|---|
| 683 Ladywood Dr | 0.26mi | 4/2.5 (-1) | 2,278 (-5%) | 1mo | $382,000 | $168 | 71 |
| 539 Still Heights Ln | 0.55mi | 5/3.0 | 2,361 (-2%) | 2mo | $447,400 | $189 | 70 |
| 543 Lake Ridge Blvd | 0.49mi | 4/2.0 (-1) | 2,362 (-2%) | 2mo | $444,900 | $188 | 63 |
| 175 Horizon Ridge Dr | 0.30mi | 4/2.5 (-1) | 2,203 (-9%) | 2mo | $436,900 | $198 | 63 |
| 539 Lake Ridge Blvd | 0.47mi | 4/2.5 (-1) | 2,203 (-9%) | 2mo | $438,205 | $199 | 55 |
| 768 Pisces Ln | 0.52mi | 5/3.0 | 2,688 (+12%) | 2mo | $459,990 | $171 | 55 |
| 204 Hawk Tail Ct | 0.61mi | 5/3.5 | 2,632 (+9%) | 0mo | $460,000 | $175 | 54 |
| 577 Lake Ridge Blvd | 0.65mi | 5/3.5 | 2,632 (+9%) | 1mo | $472,140 | $179 | 52 |
| 330 Willow Run Dr | 0.68mi | 5/3.5 | 2,618 (+9%) | 1mo | $466,705 | $178 | 51 |
| 540 Still Heights Ln | 0.57mi | 4/2.0 (-1) | 2,203 (-9%) | 2mo | $431,900 | $196 | 49 |
| 169 Bee Tree Blvd | 0.66mi | 4/2.5 (-1) | 2,203 (-9%) | 2mo | $432,205 | $196 | 46 |
| 224 Parkwood Vista Way | 0.72mi | 4/2.5 (-1) | 2,055 (-15%) | 1mo | $375,000 | $182 | 34 |
Match score weights: distance 35% · size 25% · config 20% · recency 20%. Top-matched comps best support the ARV.
Projected returns pro-forma
-3.0% appreciation · 2.67% rent growth · sell at horizon
- IRR
- -18.1%
- Equity multiple
- 0.37×
- Total profit
- $-66,603
- Equity at exit
- $55,914
- IRR
- -11.0%
- Equity multiple
- 0.35×
- Total profit
- $-68,511
- Equity at exit
- $32,423
Cash invested: $105,000 (down + closing). Projections, not guarantees.
Landlord ↔ Tenant lean methodology
- Overall (STATE)
- 90 Strongly Landlord-Friendly
- State South Carolina
- 90 Strongly Landlord-Friendly · R+6
- County
- — inherits STATE
- City
- — inherits STATE
ZIP-level market 29486
- Home prices YoY
- -15.6%
- Rents YoY
- 2.7%
- Active inventory
- 1283
- Price-to-rent
- 11.3×
Monthly cashflow live
- Estimated rent
- $2,776 high interval (Pro) →
- Mortgage (P&I)
- −$1,967
- Tax from tax record
- −$145 /mo · $1,736/yr
- Insurance
- −$156
- HOA
- −$0
- Vacancy / Maint / Mgmt
- −$583
- Net cashflow
- $-75
Break-even live
UW: 25.0% down · 7.5% · 30yr · 1.5% tax · 5.0% vac · 8.0% maint · 8.0% mgmt
Financing live
Cash to close
- Down payment
- $93,750
- Closing costs
- $11,250
- Reserves months
- —
- Total cash needed
- —
Loan-product check · same deal, 3 products live
Conventional
25% down · 7.5% · 30yr
- Down + closing
- —
- Monthly P&I
- —
- Monthly cashflow
- —
- DSCR
- —
- Eligible?
- —
Personal DTI + credit; lowest rate.
DSCR
20% down · 8.5% · 30yr
- Down + closing
- —
- Monthly P&I
- —
- Monthly cashflow
- —
- DSCR
- —
- Eligible?
- —
No personal income docs; deal must DSCR.
Hard money
10% down · 12.0% · 12mo
- Down + closing
- —
- Monthly P&I
- —
- Monthly cashflow
- —
- DSCR
- —
- Eligible?
- —
Short-term bridge; refi at stabilization.
Rent comps 20 comps
| Address | Beds | Baths | Sqft | Rent | $/sqft | DOM | Units | Dist |
|---|---|---|---|---|---|---|---|---|
| 128 Holly Leaf Ln Summerville, SC | 5.0 | 3.0 | 2409 | $2,650 | $1.10 | 3d | 1 | 0.09mi |
| 742 Ladywood Dr Summerville, SC | 4.0 | 2.5 | 1976 | $2,795 | $1.41 | 2d | 1 | 0.20mi |
| 163 Horizon Ridge Dr Moncks Corner, SC | 4.0 | 2.5 | 2203 | $2,600 | $1.18 | 3d | 1 | 0.26mi |
| 729 Long Bluff Rd Summerville, SC | 5.0 | 3.0 | 2361 | $2,800 | $1.19 | 23d | 1 | 0.39mi |
| 121 Blossom Wood Ln Summerville, SC | 4.0 | 2.5 | 1976 | $2,300 | $1.16 | 23d | 1 | 0.46mi |
| 108 Haventree Ct Summerville, SC | 4.0 | 2.5 | 1792 | $2,400 | $1.34 | 23d | 1 | 0.50mi |
| 114 Haventree Ct Summerville, SC | 5.0 | 2.5 | 2240 | $2,600 | $1.16 | 14d | 1 | 0.51mi |
| 175 Lyra Ln Summerville, SC | 3.0–4.0 | 2.0–3.0 | 2082 | $2,450 | $1.18 | 3d | 3 | 0.55mi |
| 229 Grand View Xing Summerville, SC | 4.0 | 2.0 | 1768 | $2,400 | $1.36 | 14d | 1 | 0.72mi |
| 604 Polaris Way Summerville, SC | 5.0 | 3.0 | 2688 | $2,875 | $1.07 | 14d | 1 | 0.75mi |
| 114 Lyra Ln Summerville, SC | 5.0 | 3.0 | 2704 | $2,675 | $0.99 | 2d | 1 | 0.81mi |
| 788 Redbud Ln Summerville, SC | 4.0 | 2.5 | 2070 | $2,500 | $1.21 | 14d | 1 | 0.87mi |
| 461 Navona Dr Summerville, SC | 5.0 | 3.0 | 2081 | $2,710 | $1.30 | 23d | 1 | 0.92mi |
| 591 Spanish Wells Rd Summerville, SC | 6.0 | 3.0 | 2534 | $2,950 | $1.16 | 23d | 1 | 0.97mi |
| 376 Tiliwa St Summerville, SC | 5.0 | 2.5 | 2400 | $2,500 | $1.04 | 23d | 1 | 0.98mi |
| 402 Carrara Dr Summerville, SC | 4.0 | 3.0 | 2269 | $2,600 | $1.15 | 11d | 1 | 1.09mi |
| 421 Sanctuary Park Dr Summerville, SC | 4.0 | 2.5 | 2896 | $2,641 | $0.91 | 3d | 1 | 1.25mi |
| 363 Sanctuary Park Dr Summerville, SC | 4.0 | 2.5 | 2528 | $2,600 | $1.03 | 23d | 1 | 1.36mi |
| 725 Meadowbrook Ln Summerville, SC | 5.0 | 3.0 | 2670 | $2,580 | $0.97 | 10d | 1 | 1.41mi |
| 318 Beachgrass Ln Summerville, SC | 4.0 | 2.5 | 2645 | $2,681 | $1.01 | 3d | 1 | 1.46mi |
Listing history 9 events
-
2025-10-31status Pending
-
2025-09-30price $374,999
-
2025-08-08$375,000 Active
-
2025-07-05price $378,000
-
2025-05-09$383,900 Active
-
2023-02-27soldstatus $384,900 Closed 562-char remark
Show marketing remark (562 chars)
Pine Hills is the tri-county area's most awaited master planned community. Featuring amenities like a resort style pool, walking and bike paths and a campsite, you never have to leave home to feel like you're on vacation. The Robie floorplan features a large living space with a separate dining area and kitchen island, as well as a guest suite on the first floor. You are greeted by a versatile loft on the second floor, as well as the laundry room, primary bedroom with a walk-in closet, and three additional bedrooms. Photos are a depiction of a similar home.
-
2022-11-21historical Active Under Contract 562-char remark
Show marketing remark (562 chars)
Pine Hills is the tri-county area's most awaited master planned community. Featuring amenities like a resort style pool, walking and bike paths and a campsite, you never have to leave home to feel like you're on vacation. The Robie floorplan features a large living space with a separate dining area and kitchen island, as well as a guest suite on the first floor. You are greeted by a versatile loft on the second floor, as well as the laundry room, primary bedroom with a walk-in closet, and three additional bedrooms. Photos are a depiction of a similar home.
-
2022-10-21price $389,900 562-char remark
Show marketing remark (562 chars)
Pine Hills is the tri-county area's most awaited master planned community. Featuring amenities like a resort style pool, walking and bike paths and a campsite, you never have to leave home to feel like you're on vacation. The Robie floorplan features a large living space with a separate dining area and kitchen island, as well as a guest suite on the first floor. You are greeted by a versatile loft on the second floor, as well as the laundry room, primary bedroom with a walk-in closet, and three additional bedrooms. Photos are a depiction of a similar home.
-
2022-10-20$399,900 Active 562-char remark
Show marketing remark (562 chars)
Pine Hills is the tri-county area's most awaited master planned community. Featuring amenities like a resort style pool, walking and bike paths and a campsite, you never have to leave home to feel like you're on vacation. The Robie floorplan features a large living space with a separate dining area and kitchen island, as well as a guest suite on the first floor. You are greeted by a versatile loft on the second floor, as well as the laundry room, primary bedroom with a walk-in closet, and three additional bedrooms. Photos are a depiction of a similar home.
ⓘ Source: listings_history table (triggers on properties + properties_extension) + one-shot
backfill from property_details.listing_events for pre-trigger history.
Tax reassessment forecast SC · Resets to sale price
- Current annual tax
- $1,736 · $145/mo
- Projected year-2 tax
- $2,137 · $178/mo
- Expected delta
- +$401/yr (+$33/mo · 23.1%)
ⓘ Screening estimate from a state-policy table — verify with the county assessor before closing.
Climate risk First Street
- Flood 1/10 Low FEMA zone X (unshaded) · 0% chance over 30 yrs
- Wildfire 5/10 Major
- Heat 8/10 Severe 7 d/yr ≥107°F today · 16 d/yr by 30 yrs out
- Wind 8/10 Severe 80% chance of damaging wind over 30 yrs
- Air quality 2/10 Low 2 unhealthy d/yr today · 2 by 30 yrs out
Nearby sold comps map
Loading sold comps map…
Walkable amenities ~0.75 mi
Loading nearby amenities…
Taxation est. · year 1
- Rental income
- $33,307
- − Mortgage interest
- −$21,006
- − Property taxes
- −$1,736
- − Insurance
- −$1,875
- − Repairs & maintenance
- −$2,665
- − Management
- −$2,665
- − Depreciation
- −$10,909
- Taxable loss
- −$7,548
- Est. tax savings @ 24.0%
- +$1,812
- After-tax cash flow
- $914/yr
For passive investors: Depreciation is non-cash, so a rental often shows a tax loss while cash-flowing — sheltering income. Rental losses are passive: they offset passive income freely, and up to $25,000/yr can offset ordinary (W-2) income if you actively participate and your MAGI is under $100k (phasing out to $0 by $150k); unused losses carry forward. On sale, claimed depreciation is recaptured at up to 25%, and gains may owe capital-gains tax (a 1031 exchange can defer both). Figures are a year-1 estimate at your 24.0% rate — not tax advice; consult a CPA.
Schools (NCES district)
- District
- Berkeley 01
- NCES district ID
- 4501170
- Math proficiency
- 35% ▼ -8.00%
- Reading proficiency
- 48% ▼ -2.00%
- Median HH income
- $52,724
- Composite
- 35.95/100
- National rank
- #4799
- State rank
- #30 of 80 in SC
Livability — Summerville
- Score
- 63/100
- State rank
- #167
- US rank
- #15058
Category grades
Schools grade is shown separately in the Schools card above.
Census & demographics
- County
- Berkeley County · 198,768 people
- City population
- 171,668
- Metro
- Charleston-North Charleston, SC
- Population (ZIP)
- 53,975
- Household income
- $89,578
- Rent vs Own
- Severe rent burden
- 1017.0
Population outlook (Berkeley County) Hauer SSP2
- Today (2025)
- 254,184 people
- By 2030
- 279,677 · +10.0%
- By 2040
- 329,379 · +29.6%
- By 2050
- 375,557 · +47.8%
- By 2075
- 476,740 · +87.6%
- By 2100
- 535,945 · +110.8%
Race, ethnicity, and origin ACS 2023
- Neighborhood character
- Diverse neighborhood (Simpson 0.56)
- Race & ethnicity
- White 62% Black 19% Two or more races 10% Hispanic / Latino 10% Asian 2%
- Hispanic origin (detail)
- Mexican 4% Puerto Rican 2%
- Common ancestry
- Lithuanian 4% Italian 2% Romanian 2%
- Foreign-born
- 5% · Canada, Jamaica
- Languages at home
- 91% English-only · Spanish 6% German/W. Germanic 1%
Political lean MEDSL · Berkeley
- 2024 margin
- R (+16.3) · D 41.1% · R 57.4% · Other 1.4%
- 2008→2024 swing
- -3.2pp toward R · 2008: -13.1pp · 2024: -16.3pp
- All cycles
- 2024: R+16.3 2020: R+11.7 2016: R+17.4 2012: R+18.9 2008: R+13.1
Not yet ingested
- Civics
- —
Market trends
- HPI YoY
- ▼ -52.74%
- Current HPI
- 285.0567
- Rent YoY
- ▲ 2.67%
- Metro
- Charleston-North Charleston, SC
- State GDP YoY
- ▲ 4.51%
- F500 in state
- 2
Industry mix (Fortune 500 HQ in SC)
| Industry | F500 HQs | Revenue |
|---|---|---|
| Packaging | 1 | $7B |
|
||
Price history
-6.2% since first listed9 events — show timeline
- 2025-10-31 Pending — Charleston Trident MLS
- 2025-09-30 Price Changed $374,999 Charleston Trident MLS
- 2025-08-08 Listed $375,000 Charleston Trident MLS
- 2025-07-05 Price Changed $378,000 Charleston Trident MLS
- 2025-05-09 Listed $383,900 Charleston Trident MLS
- 2023-02-27 Sold (MLS) $384,900 Charleston Trident MLS
- 2022-11-21 Contingent — Charleston Trident MLS
- 2022-10-21 Price Changed $389,900 Charleston Trident MLS
- 2022-10-20 Listed $399,900 Charleston Trident MLS
Property tax history
+21.4%/yrLatest (2025): $1,736 · +3.8% YoY. Source: county tax records.
Cash-flow waterfall
monthlySold comps — $/sqft
last 12 mo · ≤1 miLoading sold comps…