 🏗️ New Construction
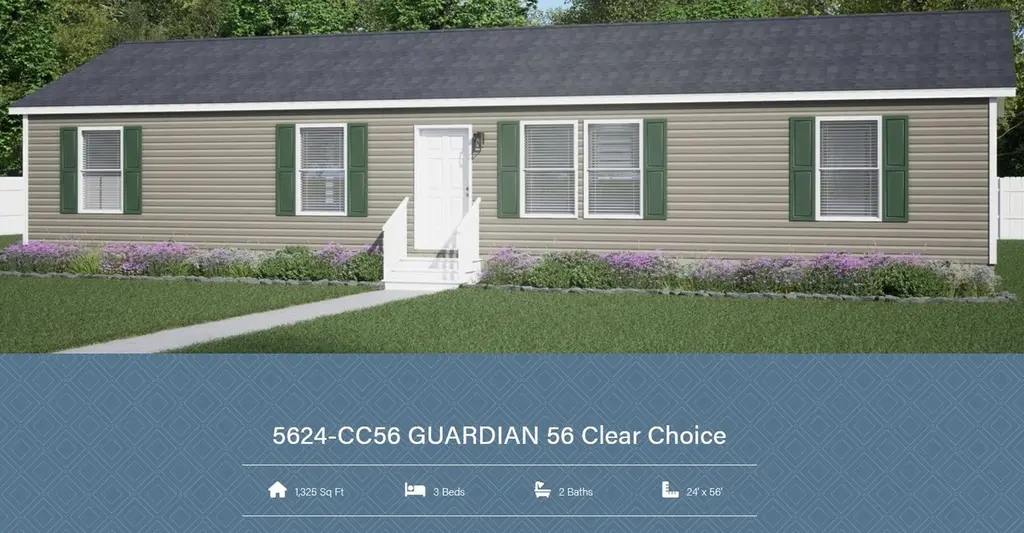
Clayton Guardian 56 (24x56) Plan · Ghent, KY
Flood risk 5/10 · Moderate
- FEMA flood zone
- X (unshaded)
- Chance of flooding over 30 yrs
- 0.65%
- Est. flood insurance / yr
- $507 – $1,088
Fire risk 3/10 · Minor
- Est. fire insurance / yr
- $839 – $1,559
Heat risk 4/10 · Minor
- Hot days now (above 104°F)
- 7 days/yr
- Hot days in 30 yrs
- 19 days/yr
Wind risk 2/10 · Minimal
- Chance of severe wind over 30 yrs
- 1.0%
Air-quality risk 3/10 · Minor
- Unhealthy air days now
- 2 days/yr
- Unhealthy air days in 30 yrs
- 4 days/yr
Risk factors via First Street. Map © Google.
Why this score? — see what drove the C grade
The composite is a weighted blend of 9 inputs, each scored 0–100. Each bar is that input's sub-score; the figure is the points it added to the 100-point composite (weight × sub-score).
- Cash flow +18.2/30.0
- 1% rule +10.0/10.0
- ARV discount +7.5/15.0
- DSCR +5.7/10.0
- Appreciation +5.3/10.0
- Condition / age +4.0/5.0
- Livability +3.0/5.0
- Rent growth +2.5/5.0
- Schools +1.5/10.0
$94,193
🖨 Deal sheet 📄 Offer letter ✓ Due diligence
Listing remarks
Designed for buyers looking for more room to spread out and enjoy a larger residential-style layout, the Clayton Clear Choice Guardian 56 offers approximately 1,325 square feet of living space with an open and inviting everyday flow. The oversized living room and kitchen area create a spacious central gathering space with room for entertaining, relaxing, or simply enjoying additional flexibility throughout the home. The split-bedroom layout with an option for a 4th bedroom provides privacy for the primary suite, while features like stainless steel appliances, recessed LED lighting, durable cabinetry, and energy-efficient design including 2x6 exterior wall construction help support modern co
Key facts
- Split-bedroom layout
- Kitchen area
- Durable cabinetry
Tags
Property features AI
Finance
- Other: Plan inventory type: Plan
- Financial info: List price available but excluded per instructions
- HOA & community: Association fee: $450 (period not specified)
Exterior
- Parking: No parking information provided
- Security: No security information provided
- Utilities: Electric service; Central heating and cooling (see Interior)
- Home design: Clayton Guardian 56 (24x56) plan; New construction plan; Located in Ghent, KY
- Construction: No year built provided; No construction material or foundation details provided
- Exterior features: Asphalt roof
Interior
- Kitchen: No specific appliance details provided
- Bedrooms: 3 bedrooms
- Flooring: No flooring information provided
- Bathrooms: 2 full bathrooms
- Heating & cooling: Electric heating with heat pump; Central air conditioning
- Interior features: Open plan based on new-construction plan
- Laundry & utility: No specific laundry details provided
Neighborhood map
What this means for you Summary
Snapshot
- This is a 3-bed/2.0-bath manufactured listed at $94k. Condition is rated good.
Deal economics
- At list price, monthly cash flow is $84 ($1k/yr) — positive.
- The deal already cash-flows at list — no discount required.
- Meets the 1% rule at list price ($2k rent vs $94k).
- Recommended offer: $93k (1.5% below list) — sets the bar for market timing.
Location & tenants
- Location reads 60/100 on livability (#384 in KY) — a middle-class / working-renter tenant base. Strengths: cost of living A+, housing A+; Watch: schools F, amenities F, commute F.
- Carroll County (town): math 12% / reading 23% proficiency, ranked #163 of 165 in KY (top 99%) — low school quality limits family demand, transient renter base, plan for 1-2y turnover.
- Market conditions: 24 active listings in the ZIP; 1 comparable units currently listed for rent nearby; 3 units permitted in Carroll County in 2024 (0 in 5+ unit buildings).
Forward outlook
- In year one you build about $1k of equity ($651 loan paydown + $546 appreciation (0.6% local appreciation)).
- Carroll County population projected at -15% by 2050 — secular population decline; favor cash flow + early exit over multi-decade hold.
- At projected returns (0.6% appreciation + 3.0% rent growth), your $26k cash investment doubles in ~8 years — after that, you're playing with house money.
Negotiation context
- It's been on market 27 days — a 2% lower offer ($93k) is reasonable based on typical stale-listing flexibility.
Risks & watch-outs
- Watch-outs: HOA is 30% of rent.
- Climate carrying-cost: moderate flood risk — expect insurance premiums to compound above CPI over the hold.
Questions for the listing agent
- What does the HOA fee cover, when was the last increase, and are there any pending special assessments or reserve-fund shortfalls?
- Is there a deadline driving the sale (1031 exchange, divorce, estate, relocation)? That informs how much negotiation room exists.
- Schools are F-rated, which usually means shorter tenancies and higher turnover. Who's the typical renter profile here, and what's been the actual vacancy rate?
- What's the average days-on-market for RENTAL listings here right now (not sales)? A rising rental-DOM trend means longer vacancies and softer asking-rent achievability than the comps imply.
- What's the recent tenant-quality profile in this submarket — average credit score on applications, eviction rate, late-payment / NSF rate, and stable-employment percentage? A property-management company in the area should have these aggregated.
- How much new for-sale + rental construction is in the pipeline within 1–3 miles? Heavy new supply typically softens prices + rents 12–24 months out; constrained supply supports both.
Investment metrics
- 1% rule
- 1.59% ✓
- Cap rate
- 7.36%
- Cash-on-cash
- 3.82%
- DSCR
- 1.17
- GRM
- 5.2
CMA / ARV
No comps found within radius.
Projected returns pro-forma
0.58% appreciation · 3.0% rent growth · sell at horizon
- IRR
- 4.2%
- Equity multiple
- 1.21×
- Total profit
- $5,492
- Equity at exit
- $30,111
- IRR
- 9.2%
- Equity multiple
- 2.07×
- Total profit
- $28,254
- Equity at exit
- $38,478
Cash invested: $26,374 (down + closing). Projections, not guarantees.
Landlord ↔ Tenant lean methodology
- Overall (STATE)
- 83 Strongly Landlord-Friendly
- State Kentucky
- 83 Strongly Landlord-Friendly · R+16
- County
- — inherits STATE
- City
- — inherits STATE
ZIP-level market 41045
- Home prices YoY
- 0.3%
- Active inventory
- 24
- Price-to-rent
- 5.2×
Monthly cashflow live
- Estimated rent
- $1,500 medium interval (Pro) →
- Mortgage (P&I)
- −$494
- Tax est. 1.5%
- −$118 /mo · $1,413/yr
- Insurance
- −$39
- HOA
- −$450
- Vacancy / Maint / Mgmt
- −$315
- Net cashflow
- $84
Break-even live
UW: 25.0% down · 7.5% · 30yr · 1.5% tax · 5.0% vac · 8.0% maint · 8.0% mgmt
Financing live
Cash to close
- Down payment
- $23,548
- Closing costs
- $2,826
- Reserves months
- —
- Total cash needed
- —
Loan-product check · same deal, 3 products live
Conventional
25% down · 7.5% · 30yr
- Down + closing
- —
- Monthly P&I
- —
- Monthly cashflow
- —
- DSCR
- —
- Eligible?
- —
Personal DTI + credit; lowest rate.
DSCR
20% down · 8.5% · 30yr
- Down + closing
- —
- Monthly P&I
- —
- Monthly cashflow
- —
- DSCR
- —
- Eligible?
- —
No personal income docs; deal must DSCR.
Hard money
10% down · 12.0% · 12mo
- Down + closing
- —
- Monthly P&I
- —
- Monthly cashflow
- —
- DSCR
- —
- Eligible?
- —
Short-term bridge; refi at stabilization.
Rent comps 1 comps
| Address | Beds | Baths | Sqft | Rent | $/sqft | DOM | Units | Dist |
|---|---|---|---|---|---|---|---|---|
| 516 Pearl St Apt 2 Vevay, IN | 3.0 | 2.0 | 1500 | $1,500 | $1.00 | 43d | 1 | 1.42mi |
HOA detail
- Monthly dues
- $450 · $5,400/yr
Listing history 15 events
-
2026-06-18days on market $94,193 Active 27 DOM
-
2026-06-17days on market $94,193 Active 26 DOM
-
2026-06-16days on market $94,193 Active 25 DOM
-
2026-06-15days on market $94,193 Active 24 DOM
-
2026-06-13pricedays on market $94,193 Active 22 DOM
-
2026-06-12days on market $97,288 Active 21 DOM
-
2026-06-09days on market $97,288 Active 18 DOM
-
2026-06-08days on market $97,288 Active 17 DOM
-
2026-06-07days on market $97,288 Active 16 DOM
-
2026-06-07days on market $97,288 Active 15 DOM
-
2026-06-04days on market $97,288 Active 12 DOM
-
2026-06-02days on market $97,288 Active 11 DOM
-
2026-06-01days on market $97,288 Active 10 DOM
-
2026-05-31days on market $97,288 Active 9 DOM
-
2026-05-31days on market $97,288 Active 8 DOM
ⓘ Source: listings_history table (triggers on properties + properties_extension) + one-shot
backfill from property_details.listing_events for pre-trigger history.
Climate risk First Street
- Flood 5/10 Major FEMA zone X (unshaded) · 65% chance over 30 yrs
- Wildfire 3/10 Moderate
- Heat 4/10 Moderate 7 d/yr ≥104°F today · 19 d/yr by 30 yrs out
- Wind 2/10 Low 100% chance of damaging wind over 30 yrs
- Air quality 3/10 Moderate 2 unhealthy d/yr today · 4 by 30 yrs out
Nearby sold comps map
Loading sold comps map…
Walkable amenities ~0.75 mi
Loading nearby amenities…
Taxation est. · year 1
- Rental income
- $18,000
- − Mortgage interest
- −$5,276
- − Property taxes
- −$1,413
- − Insurance
- −$471
- − Repairs & maintenance
- −$1,440
- − Management
- −$1,440
- − HOA
- −$5,400
- − Depreciation
- −$2,740
- Taxable loss
- −$180
- Est. tax savings @ 24.0%
- +$43
- After-tax cash flow
- $1,052/yr
For passive investors: Depreciation is non-cash, so a rental often shows a tax loss while cash-flowing — sheltering income. Rental losses are passive: they offset passive income freely, and up to $25,000/yr can offset ordinary (W-2) income if you actively participate and your MAGI is under $100k (phasing out to $0 by $150k); unused losses carry forward. On sale, claimed depreciation is recaptured at up to 25%, and gains may owe capital-gains tax (a 1031 exchange can defer both). Figures are a year-1 estimate at your 24.0% rate — not tax advice; consult a CPA.
Condition & rehab AI · 9 photos
This Clayton Guardian 56 mobile home is in good condition with no major repairs needed. It offers a spacious and modern layout with energy-efficient features, making it an attractive option for buyers and renters alike.
Value-add opportunities
- Resale Painting the exterior siding and shutters — Fresh paint can enhance the curb appeal and make the home look more inviting to potential buyers.
- Rental Landscaping improvements — Well-maintained landscaping can attract more renters and increase rental value.
Renovation cost estimate screening
Value-add ROI direction
- Resale Painting the exterior siding and shutters — Fresh paint can enhance the curb appeal and make the home look more inviting to potential buyers. ↑
- Rental Landscaping improvements — Well-maintained landscaping can attract more renters and increase rental value. ↑
ⓘ Cost ranges are severity-bucket heuristics (US national rule-of-thumb). Get contractor quotes + a written scope before underwriting a rehab budget.
Schools (NCES district)
- District
- Carroll County
- NCES district ID
- 2100990
- Math proficiency
- 12% ▼ -14.00%
- Reading proficiency
- 23% ▼ -15.00%
- Median HH income
- $41,646
- Composite
- 15.0/100
- National rank
- #9361
- State rank
- #163 of 165 in KY
Livability — Ghent
- Score
- 60/100
- State rank
- #384
- US rank
- #18633
Category grades
Schools grade is shown separately in the Schools card above.
Census & demographics
- Census place
- Ghent, KY
- Population (ZIP)
- 1,222
Population outlook (Carroll County) Hauer SSP2
- Today (2025)
- 10,359 people
- By 2030
- 10,058 · -2.9%
- By 2040
- 9,465 · -8.6%
- By 2050
- 8,788 · -15.2%
- By 2075
- 7,079 · -31.7%
- By 2100
- 5,066 · -51.1%
Race, ethnicity, and origin ACS 2023
- Neighborhood character
- Predominantly White (86%)
- Race & ethnicity
- White 86% Two or more races 11% Hispanic / Latino 6% Black 1%
- Hispanic origin (detail)
- Mexican 3%
- Common ancestry
- Serbian 7% Romanian 5% English 1%
- Foreign-born
- 2% · Canada
- Languages at home
- 94% English-only · Spanish 6%
Political lean MEDSL · Carroll
- 2024 margin
- Solid R (+51.0) · D 23.9% · R 74.9% · Other 1.2%
- 2008→2024 swing
- -42.7pp toward R · 2008: -8.2pp · 2024: -51.0pp
- All cycles
- 2024: R+51.0 2020: R+44.4 2016: R+38.5 2012: R+10.1 2008: R+8.2
Not yet ingested
- Civics
- —
Market trends
- HPI YoY
- ▲ 0.58%
- Current HPI
- 215.636
- Rent YoY
- —
- Metro
- —
- State GDP YoY
- ▲ 1.81%
- F500 in state
- 4
Industry mix (Fortune 500 HQ in KY)
| Industry | F500 HQs | Revenue |
|---|---|---|
| Healthcare | 1 | $118B |
|
||
| Food / Beverage | 1 | $7B |
|
||
Cash-flow waterfall
monthlySold comps — $/sqft
last 12 mo · ≤1 miLoading sold comps…