 🏗️ New Construction
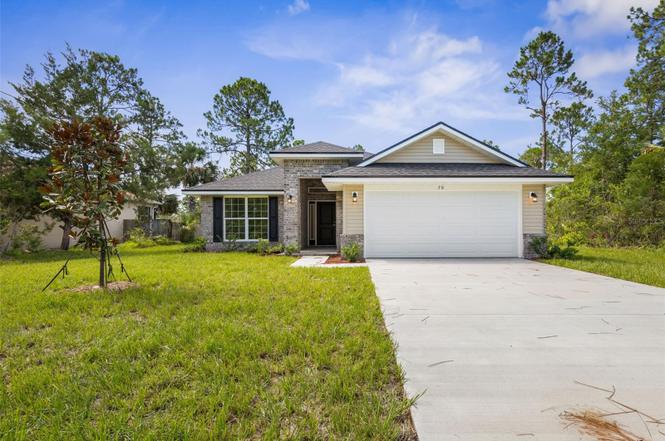
23 Brownstone Ln · Palm Coast, FL
Flood risk 1/10 · Minimal
- FEMA flood zone
- X (unshaded)
- Chance of flooding over 30 yrs
- 0.0%
- Est. flood insurance / yr
- $507 – $1,088
Fire risk 5/10 · Moderate
- Est. fire insurance / yr
- $947 – $1,759
Heat risk 9/10 · Severe
- Hot days now (above 106°F)
- 6 days/yr
- Hot days in 30 yrs
- 17 days/yr
Wind risk 10/10 · Severe
- Chance of severe wind over 30 yrs
- 99.0%
Air-quality risk 2/10 · Minimal
- Unhealthy air days now
- 2 days/yr
- Unhealthy air days in 30 yrs
- 2 days/yr
Risk factors via First Street. Map © Google.
Why this score? — see what drove the F grade
The composite is a weighted blend of 9 inputs, each scored 0–100. Each bar is that input's sub-score; the figure is the points it added to the 100-point composite (weight × sub-score).
- Cash flow +9.0/30.0
- ARV discount +7.5/15.0
- Schools +4.6/10.0
- Livability +3.5/5.0
- Rent growth +2.7/5.0
- DSCR +2.5/10.0
- Condition / age +2.5/5.0
- 1% rule +1.5/10.0
- Appreciation +0.0/10.0
$351,900
🖨 Deal sheet (PDF) 📄 Offer letter ✓ Due diligence
Listing remarks
Under Construction. Welcome to your brand new dream home in beautiful Palm Coast, FL. With NO HOA or CDD, this thoughtfully designed REAL BRICK 1820 floor plan offers the perfect blend of comfort, functionality, and modern style. Boasting 4 spacious bedrooms, 2 full bathrooms, and 1,882 square feet of living space, this home is ideal for anyone looking to enjoy Florida living at its finest. Step inside to discover an inviting layout with a seamless flow between the living, dining, and kitchen areas—perfect for entertaining or everyday living. The modern kitchen features sleek countertops, a breakfast nook, and plenty of cabinet space, opening to a large family room that leads out to t
Key facts
- Breakfast nook
- Real brick
- Dual vanities
Tags
Neighborhood map
What this means for you Summary
Snapshot
- This is a 4-bed/2.0-bath land listed at $352k.
Deal economics
- At list price, monthly cash flow is $-279 ($-3k/yr) — negative.
- To cash-flow at today's rent, offer at most $303k (14.0% below list).
- To meet the 1% rule (rent ≥ 1% of price), the offer needs to be $227k (35.5% below list).
- Recommended offer: $227k (35.5% below list) — sets the bar for 1% rule.
- Cap rate 5.3% vs local median 3.8% in Palm Coast — top-decile yield for the area; either an underpriced asset or a hidden risk that comps aren't pricing in. Stress-test before assuming the spread holds.
Location & tenants
- Location reads 69/100 on livability (#478 in FL) — a middle-class / working-renter tenant base. Strengths: housing A+, health & safety A+, cost of living B+; Watch: amenities F, commute F.
- Flagler (rural): math 53% / reading 56% proficiency, ranked #20 of 73 in FL (top 27%) — acceptable for families but not a draw, mixed tenant base, ~2y average lease.
- Zoned schools: Belle Terre Elementary School (math 64% / reading 64%, grade B, #552 of 2,144 statewide, top 26%, 1,190 students, 58% FRL); Indian Trails Middle School (math 64% / reading 59%, grade B+, #124 of 571 statewide, top 22%, 1,518 students, 50% FRL); Matanzas High School (math 36% / reading 53%, grade F, #237 of 667 statewide, top 36%, 1,978 students, 48% FRL) — zoned schools at 52% FRL track the district average.
- Market conditions: Rents flat; 1616 active listings in the ZIP; 22 comparable units currently listed for rent nearby; rentals at typical pace (median 21d on market — plan ~3-4 weeks tenant-placement turnaround); solid renter incomes; 2,588 units permitted in Flagler County in 2024 (0 in 5+ unit buildings).
- This rent runs 32% of the median local income ($84k/yr) — at the standard rent-burdened threshold; future hikes will face affordability resistance.
Forward outlook
- Local home prices are declining (-3.0%/yr); year-one equity from $2k of loan paydown is wiped out by about $11k of value loss. Plan a longer hold.
- Flagler County population projected at +28% by 2050 — long-run rental-demand tailwind backs the buy-and-hold thesis.
Negotiation context
- It's been on market 69 days — a 6% lower offer ($331k) is reasonable based on typical stale-listing flexibility.
- Current owner paid $64k; list at $352k implies a 450% gain — meaningful room to come down on a strong offer.
Risks & watch-outs
- Climate carrying-cost: severe wind risk, 99% chance of damaging wind over 30y; moderate wildfire risk; extreme-heat days projected 6→17/yr by 2055 (HVAC capex compounding) — expect insurance premiums to compound above CPI over the hold.
Questions for the listing agent
- What do current leases actually rent for vs. the listed asking? Can we see a recent rent roll and the last 12 months of T-12 income?
- It's been on market 69 days. Have you received any prior offers? Is the seller open to a 35% concession, seller financing, or rate buy-down credit?
- Why hasn't it sold? Are there any deal-killer items the seller is aware of (foundation, flood, title, zoning, code violations)?
- Is there a deadline driving the sale (1031 exchange, divorce, estate, relocation)? That informs how much negotiation room exists.
- The area grade is low — what's the realistic commute time and amenity access for the typical tenant pool here? Any planned neighborhood developments (good or bad) we should know about?
- What's the average days-on-market for RENTAL listings here right now (not sales)? A rising rental-DOM trend means longer vacancies and softer asking-rent achievability than the comps imply.
- What's the recent tenant-quality profile in this submarket — average credit score on applications, eviction rate, late-payment / NSF rate, and stable-employment percentage? A property-management company in the area should have these aggregated.
- How much new for-sale + rental construction is in the pipeline within 1–3 miles? Heavy new supply typically softens prices + rents 12–24 months out; constrained supply supports both.
Investment metrics
- 1% rule
- 0.65% ✗
- Cap rate
- 5.34%
- Cash-on-cash
- -3.40%
- DSCR
- 0.85
- GRM
- 12.9
CMA / ARV
No comps found within radius.
Projected returns pro-forma
-3.0% appreciation · 0.85% rent growth · sell at horizon
- IRR
- -24.1%
- Equity multiple
- 0.19×
- Total profit
- $-79,815
- Equity at exit
- $52,469
- IRR
- -25.5%
- Equity multiple
- -0.14×
- Total profit
- $-112,074
- Equity at exit
- $30,426
Cash invested: $98,532 (down + closing). Projections, not guarantees.
Landlord ↔ Tenant lean methodology
- Overall (STATE)
- 87 Strongly Landlord-Friendly
- State Florida
- 87 Strongly Landlord-Friendly · R+3
- County
- — inherits STATE
- City
- — inherits STATE
ZIP-level market 32137
- Home prices YoY
- -34.5%
- Rents YoY
- 0.8%
- Active inventory
- 1616
- Price-to-rent
- 12.9×
Monthly cashflow live
- Estimated rent
- $2,270 high interval (Pro) →
- Mortgage (P&I)
- −$1,845
- Tax from tax record
- −$81 /mo · $972/yr
- Insurance
- −$147
- HOA
- −$0
- Vacancy / Maint / Mgmt
- −$477
- Net cashflow
- $-279
Break-even live
Sensitivity live
| Price | -10% $-80 | -5% $-180 | +0% $-279 | +5% $-379 | +10% $-479 |
|---|---|---|---|---|---|
| Rent | -10% $-459 | -5% $-369 | +0% $-279 | +5% $-190 | +10% $-100 |
| Rate | -1.0pp $-102 | -0.5pp $-190 | base $-279 | +0.5pp $-371 | +1.0pp $-463 |
UW: 25.0% down · 7.5% · 30yr · 1.5% tax · 5.0% vac · 8.0% maint · 8.0% mgmt
Financing live
Cash to close
- Down payment
- $87,975
- Closing costs
- $10,557
- Reserves months
- —
- Total cash needed
- —
Loan-product check · same deal, 3 products live
Conventional
25% down · 7.5% · 30yr
- Down + closing
- —
- Monthly P&I
- —
- Monthly cashflow
- —
- DSCR
- —
- Eligible?
- —
Personal DTI + credit; lowest rate.
DSCR
20% down · 8.5% · 30yr
- Down + closing
- —
- Monthly P&I
- —
- Monthly cashflow
- —
- DSCR
- —
- Eligible?
- —
No personal income docs; deal must DSCR.
Hard money
10% down · 12.0% · 12mo
- Down + closing
- —
- Monthly P&I
- —
- Monthly cashflow
- —
- DSCR
- —
- Eligible?
- —
Short-term bridge; refi at stabilization.
Rent comps 22 comps
| Address | Beds | Baths | Sqft | Rent | $/sqft | DOM | Units | Dist |
|---|---|---|---|---|---|---|---|---|
| 53 Brownstone Ln Palm Coast, FL | 4.0 | 2.0 | 1582 | $1,950 | $1.23 | 4d | 1 | 0.11mi |
| 26 Brooklyn Ln Palm Coast, FL | 4.0 | 2.0 | 1862 | $2,250 | $1.21 | 21d | 1 | 0.20mi |
| 121 Pine Lakes Pkwy N Palm Coast, FL | 1.0–3.0 | 1.0–2.0 | 1090 | $1,966 | $1.80 | 4d | 10 | 0.21mi |
| 73 Bruce Ln Palm Coast, FL | 3.0 | 3.0 | 2245 | $2,189 | $0.98 | 4d | 1 | 0.31mi |
| 102 Brittany Ln Palm Coast, FL | 4.0 | 2.0 | 1902 | $2,450 | $1.29 | 25d | 1 | 0.46mi |
| 55 Brittany Ln Palm Coast, FL | 3.0 | 2.0 | 1281 | $1,850 | $1.44 | 21d | 1 | 0.67mi |
| 44 Barrington Dr Palm Coast, FL | 4.0 | 2.0 | 1862 | $2,250 | $1.21 | 16d | 1 | 0.71mi |
| 20 Bressler Ln Palm Coast, FL | 4.0 | 3.0 | 2141 | $2,060 | $0.96 | 25d | 1 | 0.74mi |
| 273 Beachway Dr Palm Coast, FL | 3.0 | 2.0 | 1784 | $2,450 | $1.37 | 25d | 1 | 0.83mi |
| 24 Barring Pl Palm Coast, FL | 3.0 | 2.0 | 1668 | $1,875 | $1.12 | 25d | 1 | 0.86mi |
| 45 Wellham Ln Unit B Palm Coast, FL | 3.0 | 2.0 | 1505 | $1,850 | $1.23 | 4d | 1 | 0.90mi |
| 35 Wellham Ln Palm Coast, FL | 3.0 | 2.0 | 1298 | $1,750 | $1.35 | 25d | 1 | 0.95mi |
| 129 Wellwood Ln Unit B Palm Coast, FL | 3.0 | 2.0 | 1287 | $1,650 | $1.28 | 25d | 1 | 1.02mi |
| 12 Bunker View Pl Palm Coast, FL | 3.0 | 2.5 | 1600 | $1,725 | $1.08 | 4d | 1 | 1.16mi |
| 69 Beckner Ln Unit NA Palm Coast, FL | 3.0 | 2.0 | 1412 | $1,998 | $1.42 | 4d | 1 | 1.22mi |
| 63 Beaverdam Ln Palm Coast, FL | 3.0 | 2.0 | 1591 | $1,895 | $1.19 | 4d | 1 | 1.25mi |
| 78 Belvedere Ln Palm Coast, FL | 3.0 | 2.0 | 1557 | $1,750 | $1.12 | 16d | 1 | 1.30mi |
| 57 Wellstream Ln Palm Coast, FL | 3.0 | 2.0 | 2040 | $1,900 | $0.93 | 25d | 1 | 1.38mi |
| 59 Wellstream Ln Palm Coast, FL | 3.0 | 2.0 | 1367 | $1,795 | $1.31 | 25d | 1 | 1.38mi |
| 134 Beechwood Ln Palm Coast, FL | 3.0 | 2.0 | 1368 | $1,870 | $1.37 | 23d | 1 | 1.43mi |
| 34 Bunker Ln Palm Coast, FL | 4.0 | 2.0 | 1733 | $2,200 | $1.27 | 25d | 1 | 1.48mi |
| 11 Birchtree Way Palm Coast, FL | 3.0 | 2.0 | 1360 | $1,800 | $1.32 | 4d | 1 | 1.48mi |
Listing history 5 events
-
2026-04-01status Pending
-
2026-02-18price $351,900
-
2026-01-22$342,900 Active
-
2024-12-09soldstatus $64,000
-
1986-01-01soldstatus $5,100
ⓘ Source: listings_history table (triggers on properties + properties_extension) + one-shot
backfill from property_details.listing_events for pre-trigger history.
Tax reassessment forecast FL · Resets to sale price
- Current annual tax
- $972 · $81/mo
- Projected year-2 tax
- $2,921 · $243/mo
- Expected delta
- +$1,948/yr (+$162/mo · 200.4%)
ⓘ Screening estimate from a state-policy table — verify with the county assessor before closing.
Climate risk First Street
- Flood 1/10 Low FEMA zone X (unshaded) · 0% chance over 30 yrs
- Wildfire 5/10 Major
- Heat 9/10 Extreme 6 d/yr ≥106°F today · 17 d/yr by 30 yrs out
- Wind 10/10 Extreme 99% chance of damaging wind over 30 yrs
- Air quality 2/10 Low 2 unhealthy d/yr today · 2 by 30 yrs out
Nearby sold comps map
Loading sold comps map…
Walkable amenities ~0.75 mi
Loading nearby amenities…
Taxation est. · year 1
- Rental income
- $27,245
- − Mortgage interest
- −$19,712
- − Property taxes
- −$972
- − Insurance
- −$1,760
- − Repairs & maintenance
- −$2,180
- − Management
- −$2,180
- − Depreciation
- −$10,237
- Taxable loss
- −$9,795
- Est. tax savings @ 24.0%
- +$2,351
- After-tax cash flow
- $-1,002/yr
For passive investors: Depreciation is non-cash, so a rental often shows a tax loss while cash-flowing — sheltering income. Rental losses are passive: they offset passive income freely, and up to $25,000/yr can offset ordinary (W-2) income if you actively participate and your MAGI is under $100k (phasing out to $0 by $150k); unused losses carry forward. On sale, claimed depreciation is recaptured at up to 25%, and gains may owe capital-gains tax (a 1031 exchange can defer both). Figures are a year-1 estimate at your 24.0% rate — not tax advice; consult a CPA.
Schools (NCES district)
- District
- Flagler
- NCES district ID
- 1200540
- Math proficiency
- 53% ▼ -9.00%
- Reading proficiency
- 56% ▼ -4.00%
- Median HH income
- $48,354
- Composite
- 46.35/100
- National rank
- #2464
- State rank
- #20 of 73 in FL
Livability — Palm Coast
- Score
- 69/100
- State rank
- #478
- US rank
- #8721
Category grades
Schools grade is shown separately in the Schools card above.
Census & demographics
- Census place
- Palm Coast, FL
- County
- Flagler County · 113,412 people
- City population
- 105,049
- Metro
- Deltona-Daytona Beach-Ormond Beach, FL
- Population (ZIP)
- 48,391
- Household income
- $83,923
- Rent vs Own
- Severe rent burden
- 816.0
Population outlook (Flagler County) Hauer SSP2
- Today (2025)
- 123,474 people
- By 2030
- 131,864 · +6.8%
- By 2040
- 146,176 · +18.4%
- By 2050
- 157,398 · +27.5%
- By 2075
- 177,990 · +44.2%
- By 2100
- 183,381 · +48.5%
Race, ethnicity, and origin ACS 2023
- Neighborhood character
- Predominantly White (77%)
- Race & ethnicity
- White 77% Hispanic / Latino 10% Two or more races 8% Black 6% Asian 3%
- Hispanic origin (detail)
- Puerto Rican 4% Cuban 1%
- Common ancestry
- Romanian 4% Russian 2% Lithuanian 2%
- Foreign-born
- 13% · Canada, Jamaica
- Languages at home
- 85% English-only · Spanish 7% Other Indo-European 3% Russian/Polish/Slavic 2%
Political lean MEDSL · Flagler
- 2024 margin
- Strong R (+28.2) · D 35.6% · R 63.8%
- 2008→2024 swing
- -29.8pp toward R · 2008: 1.6pp · 2024: -28.2pp
- All cycles
- 2024: R+28.2 2020: R+20.8 2016: R+20.6 2012: R+7.4 2008: D+1.6
Not yet ingested
- Civics
- —
Market trends
- HPI YoY
- ▼ -153.27%
- Current HPI
- 290.4607
- Rent YoY
- ▲ 0.85%
- Metro
- Deltona-Daytona Beach-Ormond Beach, FL
- State GDP YoY
- ▲ 3.28%
- F500 in state
- 36
Industry mix (Fortune 500 HQ in FL)
| Industry | F500 HQs | Revenue |
|---|---|---|
| Industrial Technology | 2 | $29B |
|
||
| Insurance | 2 | $17B |
|
||
| Retail | 1 | $60B |
|
||
| Technology Distribution | 1 | $58B |
|
||
| Homebuilding | 1 | $35B |
|
||
| Technology Manufacturing | 1 | $35B |
|
||
Price history
+6800.0% since first listed5 events — show timeline
- 2026-04-01 Pending — Stellar MLS as Distributed by MLS Grid
- 2026-02-18 Price Changed $351,900 Stellar MLS as Distributed by MLS Grid
- 2026-01-22 Listed $342,900 Stellar MLS as Distributed by MLS Grid
- 2024-12-09 Sold (Public Records) $64,000 Public Records
- 1986-01-01 Sold (Public Records) $5,100 Public Records
Property tax history
+18.1%/yrLatest (2025): $972 · +86.9% YoY. Source: county tax records.
Cash-flow waterfall
monthlySold comps — $/sqft
last 12 mo · ≤1 miLoading sold comps…