22928 Laurel Ln · Crestline, CA
Flood risk 1/10 · Minimal
- FEMA flood zone
- X (unshaded)
- Chance of flooding over 30 yrs
- 0.0%
- Est. flood insurance / yr
- $473 – $860
Fire risk 8/10 · Major
- Est. fire insurance / yr
- $659 – $1,223
Heat risk 3/10 · Minor
- Hot days now (above threshold)
- —
- Hot days in 30 yrs
- —
Wind risk 1/10 · Minimal
- Chance of severe wind over 30 yrs
- —
Air-quality risk 10/10 · Severe
- Unhealthy air days now
- 26 days/yr
- Unhealthy air days in 30 yrs
- 33 days/yr
Risk factors via First Street. Map © Google.
Why this score? — see what drove the D grade
The composite is a weighted blend of 9 inputs, each scored 0–100. Each bar is that input's sub-score; the figure is the points it added to the 100-point composite (weight × sub-score).
- ARV discount +15.0/15.0
- Cash flow +9.1/30.0
- Rent growth +3.7/5.0
- 1% rule +3.5/10.0
- Livability +2.8/5.0
- DSCR +2.5/10.0
- Condition / age +2.5/5.0
- Schools +2.1/10.0
- Appreciation +0.0/10.0
$225,000
🖨 Deal sheet 📄 Offer letter ✓ Due diligence
Listing remarks
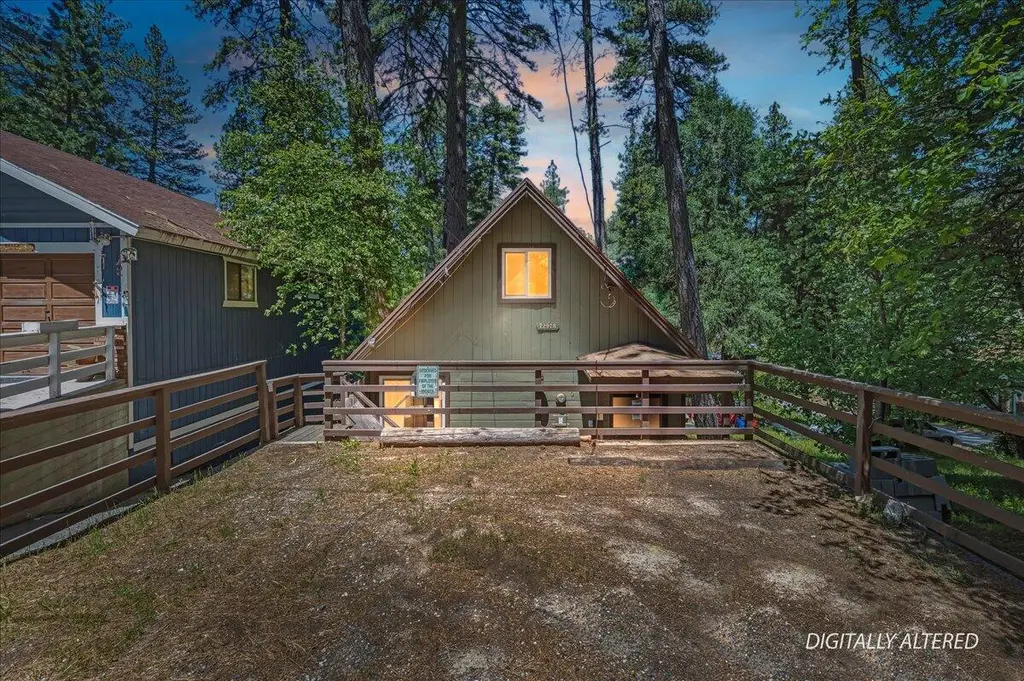
Nestled in the heart of the forest, this charming 3 bedroom, 1.1-bath cabin offers the perfect blend of comfort and rustic appeal. Featuring beautiful hardwood floors and classic knotty pine cabinetry, the home captures that warm, cozy cabin feel throughout. Surrounded by nature, this inviting retreat is ideal for relaxing getaways or full-time mountain living, all while being conveniently located in the desirable community of Crestline.
Key facts
- 2,500 sq ft lot
- Garage
- Built 1959
Property features AI
Finance
- Other: Listing will be conveyed at close of escrow; Acceptable financing includes cash to new loan and FHA; Property sold as-is (disclosures: Property As Is, Property Report)
- HOA & community: No monthly association fee; Not in a gated community
Exterior
- Parking: Detached carport with 2 spaces; Total of 2 parking spaces
- Security: No security features listed
- Utilities: Sewer connected and paid; No PUD
- Home design: Attached single-family residence; Two-story home
- Construction: Year built per assessor
- Exterior features: Fee simple land; Lot info per assessor
Interior
- Flooring: Hardwood floors
- Bathrooms: 1 full bathroom; 1 quarter bathroom
- Heating & cooling: Wall furnace heating; No central cooling
- Interior features: Unfurnished; Wood-burning fireplace in the living room
Neighborhood map
What this means for you Summary
Snapshot
- This is a 2-bed/1.0-bath single-family listed at $225k.
Deal economics
- At list price, monthly cash flow is $-175 ($-2k/yr) — negative.
- To cash-flow at today's rent, offer at most $194k (13.7% below list).
- To meet the 1% rule (rent ≥ 1% of price), the offer needs to be $191k (14.9% below list).
- Recommended offer: $191k (14.9% below list) — sets the bar for 1% rule.
- Cap rate 5.4% vs local median 3.9% in Crestline — top-decile yield for the area; either an underpriced asset or a hidden risk that comps aren't pricing in. Stress-test before assuming the spread holds.
Location & tenants
- Location reads 56/100 on livability (#805 in CA) — a working-class tenant base; expect higher turnover. Strengths: housing A+; Watch: commute D, schools D-, crime F.
- Rim Of The World Unified (town): math 13% / reading 34% proficiency, ranked #415 of 517 in CA (top 80%) — low school quality limits family demand, transient renter base, plan for 1-2y turnover.
- Market conditions: Rents rising fast (+4.7%/yr); 252 active listings in the ZIP; 7 comparable units currently listed for rent nearby; rentals leasing fast (median 4d on market — plan ~1-2 weeks tenant-placement turnaround); 5,458 units permitted in San Bernardino County in 2024 (1,500 in 5+ unit buildings).
- This rent runs 33% of the median local income ($71k/yr) — at the standard rent-burdened threshold; future hikes will face affordability resistance.
Forward outlook
- Local home prices are declining (-3.0%/yr); year-one equity from $2k of loan paydown is wiped out by about $7k of value loss. Plan a longer hold.
- San Bernardino County population projected at +15% by 2050 — modest demand growth; plan on rents tracking national, not racing it.
Negotiation context
- Only 12 days on market — expect competitive offers; lowballing is unlikely to land.
- 11 sale attempts since 20y ago with the ask held roughly flat each time — persistent listings suggest the price (not the market) is what's stuck; bring a comps-based counter.
Risks & watch-outs
- Watch-outs: built in 1959 — expect roof / HVAC / electrical / plumbing capex.
- Climate carrying-cost: severe wildfire risk — expect insurance premiums to compound above CPI over the hold.
Questions for the listing agent
- What do current leases actually rent for vs. the listed asking? Can we see a recent rent roll and the last 12 months of T-12 income?
- Built in 1959 — when were the roof, HVAC, electrical panel, plumbing, and water heater last replaced?
- Is there a deadline driving the sale (1031 exchange, divorce, estate, relocation)? That informs how much negotiation room exists.
- Schools are D-rated, which usually means shorter tenancies and higher turnover. Who's the typical renter profile here, and what's been the actual vacancy rate?
- Crime grade is F in this area — have there been break-ins, vandalism, or insurance claims at this property in the last 3 years? What carrier currently insures it and at what premium?
- The area grade is low — what's the realistic commute time and amenity access for the typical tenant pool here? Any planned neighborhood developments (good or bad) we should know about?
- What's the average days-on-market for RENTAL listings here right now (not sales)? A rising rental-DOM trend means longer vacancies and softer asking-rent achievability than the comps imply.
- What's the recent tenant-quality profile in this submarket — average credit score on applications, eviction rate, late-payment / NSF rate, and stable-employment percentage? A property-management company in the area should have these aggregated.
- How much new for-sale + rental construction is in the pipeline within 1–3 miles? Heavy new supply typically softens prices + rents 12–24 months out; constrained supply supports both.
Investment metrics
- 1% rule
- 0.85% ✗
- Cap rate
- 5.36%
- Cash-on-cash
- -3.33%
- DSCR
- 0.85
- GRM
- 9.8
CMA / ARV
- ARV (median comp)
- $296,378
- List price
- $225,000
- Delta
- -24.08%
- Verdict
- UNDERPRICED
- Comps
- 20 within 1.0 mi
Show comp detail 12 sales within ~0.75 mi
| Address | Dist | Beds/Ba | Sqft | Sold | Price | $/sf | Match |
|---|---|---|---|---|---|---|---|
| 22926 Alder Ln | 0.02mi | 2/1.0 | 864 (+3%) | 12mo | $270,000 | $313 | 84 |
| 22908 Redwood Way | 0.08mi | 2/1.0 | 864 (+3%) | 11mo | $263,000 | $304 | 82 |
| 418 Forest Ln | 0.24mi | 2/1.0 | 832 (-1%) | 9mo | $250,000 | $300 | 80 |
| 22847 Juniper Ln | 0.15mi | 2/2.0 | 781 (-7%) | 8mo | $330,000 | $423 | 71 |
| 23034 Cedar Way | 0.28mi | 3/1.0 (+1) | 866 (+3%) | 8mo | $235,000 | $271 | 70 |
| 22988 Pine Ln | 0.24mi | 2/1.5 | 900 (+7%) | 9mo | $273,500 | $304 | 68 |
| 23312 Seeley Way | 0.58mi | 2/1.0 | 832 (-1%) | 8mo | $250,000 | $300 | 65 |
| 442 Valley Rd | 0.42mi | 2/1.0 | 888 (+6%) | 10mo | $260,000 | $293 | 63 |
| 744 Woodland | 0.68mi | 1/1.0 (-1) | 816 (-3%) | 0mo | $155,000 | $190 | 58 |
| 687 Spring Dr | 0.68mi | 2/2.0 | 800 (-5%) | 2mo | $332,500 | $416 | 55 |
| 23413 Knapps Cutoff | 0.66mi | 1/1.0 (-1) | 775 (-8%) | 1mo | $250,000 | $323 | 50 |
| 22490 Rockwell Rd | 0.65mi | 2/1.0 | 930 (+11%) | 10mo | $240,000 | $258 | 43 |
Match score weights: distance 35% · size 25% · config 20% · recency 20%. Top-matched comps best support the ARV.
Projected returns pro-forma
-3.0% appreciation · 4.65% rent growth · sell at horizon
- IRR
- -19.8%
- Equity multiple
- 0.30×
- Total profit
- $-44,250
- Equity at exit
- $33,548
- IRR
- -9.2%
- Equity multiple
- 0.39×
- Total profit
- $-38,712
- Equity at exit
- $19,454
Cash invested: $63,000 (down + closing). Projections, not guarantees.
Landlord ↔ Tenant lean methodology
- Overall (STATE)
- 18 Strongly Tenant-Friendly
- State California
- 18 Strongly Tenant-Friendly · D+13
- County
- — inherits STATE
- City
- — inherits STATE
ZIP-level market 92325
- Rents YoY
- 4.7%
- Active inventory
- 252
- Price-to-rent
- 9.8×
Monthly cashflow live
- Estimated rent
- $1,914 high interval (Pro) →
- Mortgage (P&I)
- −$1,180
- Tax from tax record
- −$413 /mo · $4,956/yr
- Insurance
- −$94
- HOA
- −$0
- Vacancy / Maint / Mgmt
- −$402
- Net cashflow
- $-175
Break-even live
UW: 25.0% down · 7.5% · 30yr · 1.5% tax · 5.0% vac · 8.0% maint · 8.0% mgmt
Financing live
Cash to close
- Down payment
- $56,250
- Closing costs
- $6,750
- Reserves months
- —
- Total cash needed
- —
Loan-product check · same deal, 3 products live
Conventional
25% down · 7.5% · 30yr
- Down + closing
- —
- Monthly P&I
- —
- Monthly cashflow
- —
- DSCR
- —
- Eligible?
- —
Personal DTI + credit; lowest rate.
DSCR
20% down · 8.5% · 30yr
- Down + closing
- —
- Monthly P&I
- —
- Monthly cashflow
- —
- DSCR
- —
- Eligible?
- —
No personal income docs; deal must DSCR.
Hard money
10% down · 12.0% · 12mo
- Down + closing
- —
- Monthly P&I
- —
- Monthly cashflow
- —
- DSCR
- —
- Eligible?
- —
Short-term bridge; refi at stabilization.
Rent comps 7 comps
| Address | Beds | Baths | Sqft | Rent | $/sqft | DOM | Units | Dist |
|---|---|---|---|---|---|---|---|---|
| 686 Ca-138 Crestline, CA | 2.0 | 1.0 | 720 | $1,800 | $2.50 | 4d | 1 | 0.66mi |
| 767 Woodland Rd Unit 1 Crestline, CA | 2.0 | 1.0 | 1100 | $1,700 | $1.55 | 2d | 1 | 0.70mi |
| 794 Woodland Rd Unit A Crestline, CA | 2.0 | 1.0 | 686 | $1,400 | $2.04 | 16d | 1 | 0.77mi |
| 23654 Lake Dr Crestline, CA | 2.0 | 1.0 | 720 | $1,995 | $2.77 | 1d | 1 | 0.93mi |
| 979 Venus Way Crestline, CA | 2.0 | 2.0 | 800 | $2,500 | $3.12 | 21d | 1 | 1.18mi |
| 198 Mile High Rd Crestline, CA | 3.0 | 2.5 | 850 | $2,300 | $2.71 | 1d | 1 | 1.33mi |
| 23920 Scenic Dr Crestline, CA | 2.0 | 1.0 | 770 | $1,795 | $2.33 | 24d | 1 | 1.35mi |
Listing history 38 events
-
2026-05-18status Pending 441-char remark
-
2026-05-06$225,000 Active 441-char remark
-
2026-04-15historical
-
2026-03-13price $177,000
-
2026-02-11$202,500 Active
-
2025-03-14status Pending Sale
-
2025-01-04historical Active Under Contract
-
2024-12-12historical
-
2024-12-09$255,000 Active
-
2024-11-30historical
-
2024-09-18price $260,000
-
2024-07-19status Active
-
2024-07-19price $275,000
-
2024-06-20status Active
-
2024-06-04historical
-
2022-08-25historical
-
2021-09-27soldstatus $260,000 Closed Sale
-
2021-09-27soldstatus $260,000
-
2021-08-24status Pending Sale
-
2021-08-23price $260,000
-
2021-08-19status Active
-
2021-07-31status Pending Sale
-
2021-07-30price $245,000
-
2021-07-27$225,000 Active
-
2010-08-28historical
-
2010-06-02price $89,000
-
2010-03-30price $94,900
-
2010-01-09price $99,900
-
2009-08-31$89,000
-
2009-08-26$134,000 Active
-
2007-10-31soldstatus $105,000
-
2007-06-12$109,500
-
2006-04-20historical
-
2006-04-14$189,999
-
2000-10-13soldstatus $69,000
-
1996-09-26soldstatus $43,500
-
1994-05-04soldstatus $48,000
-
1989-10-24soldstatus $63,000
ⓘ Source: listings_history table (triggers on properties + properties_extension) + one-shot
backfill from property_details.listing_events for pre-trigger history.
Tax reassessment forecast CA · Resets to sale price
- Current annual tax
- $4,956 · $413/mo
- Projected year-2 tax
- $4,956 · $413/mo
- Expected delta
- $0/yr ($0/mo · 0.0%)
ⓘ Screening estimate from a state-policy table — verify with the county assessor before closing.
Climate risk First Street
- Flood 1/10 Low FEMA zone X (unshaded) · 0% chance over 30 yrs
- Wildfire 8/10 Severe
- Heat 3/10 Moderate
- Wind 1/10 Low
- Air quality 10/10 Extreme 26 unhealthy d/yr today · 33 by 30 yrs out
Nearby sold comps map
Loading sold comps map…
Walkable amenities ~0.75 mi
Loading nearby amenities…
Taxation est. · year 1
- Rental income
- $22,966
- − Mortgage interest
- −$12,603
- − Property taxes
- −$4,956
- − Insurance
- −$1,125
- − Repairs & maintenance
- −$1,837
- − Management
- −$1,837
- − Depreciation
- −$6,545
- Taxable loss
- −$5,939
- Est. tax savings @ 24.0%
- +$1,425
- After-tax cash flow
- $-672/yr
For passive investors: Depreciation is non-cash, so a rental often shows a tax loss while cash-flowing — sheltering income. Rental losses are passive: they offset passive income freely, and up to $25,000/yr can offset ordinary (W-2) income if you actively participate and your MAGI is under $100k (phasing out to $0 by $150k); unused losses carry forward. On sale, claimed depreciation is recaptured at up to 25%, and gains may owe capital-gains tax (a 1031 exchange can defer both). Figures are a year-1 estimate at your 24.0% rate — not tax advice; consult a CPA.
Schools (NCES district)
- District
- Rim Of The World Unified
- NCES district ID
- 0632610
- Math proficiency
- 13% ▼ -10.00%
- Reading proficiency
- 34% ▼ -7.00%
- Median HH income
- $55,860
- Composite
- 21.29/100
- National rank
- #8389
- State rank
- #415 of 517 in CA
Livability — Crestline
- Score
- 56/100
- State rank
- #805
- US rank
- #22821
Category grades
Schools grade is shown separately in the Schools card above.
Census & demographics
- Census place
- Crestline, CA
- County
- San Bernardino County · 2,030,291 people
- City population
- 9,065
- Metro
- Riverside-San Bernardino-Ontario, CA
- Population (ZIP)
- 9,065
- Household income
- $70,563
- Rent vs Own
- Severe rent burden
- 179.0
Population outlook (San Bernardino County) Hauer SSP2
- Today (2025)
- 2,300,329 people
- By 2030
- 2,378,907 · +3.4%
- By 2040
- 2,523,137 · +9.7%
- By 2050
- 2,642,388 · +14.9%
- By 2075
- 2,880,769 · +25.2%
- By 2100
- 2,909,436 · +26.5%
Race, ethnicity, and origin ACS 2023
- Neighborhood character
- Predominantly White (68%)
- Race & ethnicity
- White 68% Hispanic / Latino 25% Two or more races 20% Black 2%
- Hispanic origin (detail)
- Mexican 21%
- Common ancestry
- Romanian 5% Slovak 5% Lithuanian 4%
- Foreign-born
- 9% · Canada
- Languages at home
- 85% English-only · Spanish 12% Russian/Polish/Slavic 3% German/W. Germanic 1%
Political lean MEDSL · San Bernardino
- 2024 margin
- Toss-up / Even · D 47.5% · R 49.7% · Other 2.8%
- 2008→2024 swing
- -8.5pp toward R · 2008: 6.3pp · 2024: -2.1pp
- All cycles
- 2024: R+2.1 2020: D+10.7 2016: D+9.8 2012: D+5.4 2008: D+6.3
Not yet ingested
- Civics
- —
Market trends
- HPI YoY
- ▼ -255.88%
- Current HPI
- 352.6512
- Rent YoY
- ▲ 4.65%
- Metro
- Riverside-San Bernardino-Ontario, CA
- State GDP YoY
- ▲ 3.21%
- F500 in state
- 116
Industry mix (Fortune 500 HQ in CA)
| Industry | F500 HQs | Revenue |
|---|---|---|
| Technology | 27 | $1,492B |
|
||
| Financial Services | 3 | $174B |
|
||
| Retail | 3 | $44B |
|
||
| Insurance | 3 | $26B |
|
||
| Media / Entertainment | 2 | $115B |
|
||
| Pharmaceuticals / Biotech | 2 | $62B |
|
||
Price history
+257.1% since first listed38 events — show timeline
- 2026-05-18 Pending — GPSMLS
- 2026-05-06 Listed $225,000 GPSMLS
- 2026-04-15 Listing Removed — CRMLS
- 2026-03-13 Price Changed $177,000 CRMLS
- 2026-02-11 Listed $202,500 CRMLS
- 2025-03-14 Pending — CRMLS
- 2025-01-04 Contingent — CRMLS
- 2024-12-12 Listing Removed — CRMLS
- 2024-12-09 Listed $255,000 CRMLS
- 2024-11-30 Listing Removed — CRMLS
- 2024-09-18 Price Changed $260,000 CRMLS
- 2024-07-19 Relisted — CRMLS
- 2024-07-19 Price Changed $275,000 CRMLS
- 2024-06-20 Relisted — CRMLS
- 2024-06-04 Coming Soon — CRMLS
- 2022-08-25 Listing Removed — CRMLS
- 2021-09-27 Sold (Public Records) $260,000 Public Records
- 2021-09-27 Sold (MLS) $260,000 CRMLS
- 2021-08-24 Pending — CRMLS
- 2021-08-23 Price Changed $260,000 CRMLS
- 2021-08-19 Relisted — CRMLS
- 2021-07-31 Pending — CRMLS
- 2021-07-30 Price Changed $245,000 CRMLS
- 2021-07-27 Listed $225,000 CRMLS
- 2010-08-28 Listing Removed — CRMLS
- 2010-06-02 Price Changed $89,000 CRMLS
- 2010-03-30 Price Changed $94,900 CRMLS
- 2010-01-09 Price Changed $99,900 CRMLS
- 2009-08-31 Listed $89,000 CRMLS
- 2009-08-26 Listed $134,000 CRMLS
- 2007-10-31 Sold (MLS) $105,000 CRMLS
- 2007-06-12 Listed $109,500 CRMLS
- 2006-04-20 Listing Removed — CRMLS
- 2006-04-14 Listed $189,999 CRMLS
- 2000-10-13 Sold (Public Records) $69,000 Public Records
- 1996-09-26 Sold (Public Records) $43,500 Public Records
- 1994-05-04 Sold (Public Records) $48,000 Public Records
- 1989-10-24 Sold (Public Records) $63,000 Public Records
Property tax history
+5.1%/yrLatest (2025): $4,956 · +42.0% YoY. Source: county tax records.
Cash-flow waterfall
monthlySold comps — $/sqft
last 12 mo · ≤1 miLoading sold comps…