 🌊 Lakefront
5532 NE Gulfstream Way · Sewall's Point, FL
Flood risk 10/10 · Severe
- FEMA flood zone
- X (shaded)
- Chance of flooding over 30 yrs
- 0.99%
- Est. flood insurance / yr
- $507 – $1,088
Fire risk 2/10 · Minimal
- Est. fire insurance / yr
- $947 – $1,759
Heat risk 10/10 · Severe
- Hot days now (above 106°F)
- 7 days/yr
- Hot days in 30 yrs
- 26 days/yr
Wind risk 10/10 · Severe
- Chance of severe wind over 30 yrs
- 99.0%
Air-quality risk 2/10 · Minimal
- Unhealthy air days now
- 2 days/yr
- Unhealthy air days in 30 yrs
- 2 days/yr
Risk factors via First Street. Map © Google.
Why this score? — see what drove the D grade
The composite is a weighted blend of 9 inputs, each scored 0–100. Each bar is that input's sub-score; the figure is the points it added to the 100-point composite (weight × sub-score).
- ARV discount +15.0/15.0
- Appreciation +10.0/10.0
- Schools +4.5/10.0
- Rent growth +2.5/5.0
- Livability +2.5/5.0
- Condition / age +2.5/5.0
- Cash flow +2.4/30.0
- 1% rule +1.3/10.0
- DSCR +0.0/10.0
$439,000
🖨 Deal sheet 📄 Offer letter ✓ Due diligence
Listing remarks MLS
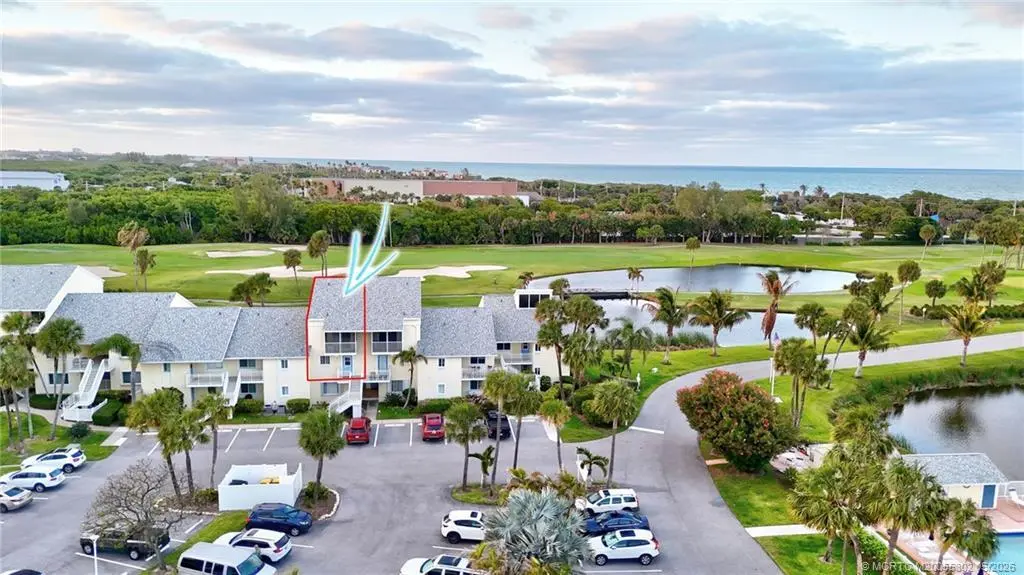
Beautifully renovated top-floor 2-story townhome in the desirable Lakeside community, offering serene lake and golf course views. This spacious 2BR/2.5BA residence is being sold furnished and features white shaker cabinetry, granite countertops, stainless steel appliances, and durable luxury vinyl plank flooring throughout. The flexible layout offers multiple indoor and outdoor living spaces, including an open patio, screened patio, and two enclosed balconies that provide additional usable square footage and abundant natural light—ideal for relaxing or entertaining. Residents enjoy a heated community pool, grilling areas, and a pet-friendly environment for owners. Conveniently located near beach access, dining, and local amenities. Optional Ocean Club membership available, providing private beach access, additional pools, hot tubs, fitness centers, tiki bars, café, bowling alley, and clubhouse dining.
Key facts
- Lake views
- Granite countertops
- Golf course views
Tags
Neighborhood map
What this means for you Summary
Snapshot
- This is a 2-bed/2.5-bath condo listed at $439k.
Deal economics
- At list price, monthly cash flow is $-2k ($-19k/yr) — negative.
- To cash-flow at today's rent, offer at most $154k (64.9% below list).
- To meet the 1% rule (rent ≥ 1% of price), the offer needs to be $276k (37.1% below list).
- Recommended offer: $154k (64.9% below list) — sets the bar for cash-flow.
- Cap rate 2.1% vs local median 0.7% in Sewall's Point — top-decile yield for the area; either an underpriced asset or a hidden risk that comps aren't pricing in. Stress-test before assuming the spread holds.
Location & tenants
- Location reads: area grade D — affects rentability + tenant quality, not the cash-flow math above.
- Martin (suburban): math 52% / reading 53% proficiency, ranked #24 of 73 in FL (top 33%) — acceptable for families but not a draw, mixed tenant base, ~2y average lease.
- Market conditions: 251 active listings in the ZIP; 40 comparable units currently listed for rent nearby; rentals at typical pace (median 24d on market — plan ~3-4 weeks tenant-placement turnaround); solid renter incomes; 737 units permitted in Martin County in 2024 (167 in 5+ unit buildings).
- This rent runs 40% of the median local income ($84k/yr) — at the standard rent-burdened threshold; future hikes will face affordability resistance.
Forward outlook
- In year one you build about $47k of equity ($3k loan paydown + $44k appreciation (10.0% local appreciation)).
- Martin County population projected at +19% by 2050 — long-run rental-demand tailwind backs the buy-and-hold thesis.
- By year 2, paydown + projected appreciation supports a ~$75k cash-out refi (75% LTV) — recoverable capital for the next deal without selling this one.
Negotiation context
- It's been on market 61 days — a 6% lower offer ($413k) is reasonable based on typical stale-listing flexibility.
- 3 sale attempts since 2y ago; this cycle's ask has dropped $26k (6%) from the opening price — seller is motivated, your offer sets the floor, not the list.
Risks & watch-outs
- Watch-outs: flood insurance adds $66/mo; HOA is 29% of rent.
- Climate carrying-cost: severe flood risk; severe wind risk, 99% chance of damaging wind over 30y; extreme-heat days projected 7→26/yr by 2055 (HVAC capex compounding) — expect insurance premiums to compound above CPI over the hold.
Questions for the listing agent
- What do current leases actually rent for vs. the listed asking? Can we see a recent rent roll and the last 12 months of T-12 income?
- It's been on market 61 days. Have you received any prior offers? Is the seller open to a 65% concession, seller financing, or rate buy-down credit?
- What's the actual annual flood-insurance premium (NFIP or private), and is the property in a SFHA with mandatory coverage?
- What does the HOA fee cover, when was the last increase, and are there any pending special assessments or reserve-fund shortfalls?
- Any open or pending special assessments — roof, HVAC, plumbing, elevator, façade? What's the per-unit balance and payoff schedule, and is the seller paying it off at close or rolling it to the buyer?
- Why hasn't it sold? Are there any deal-killer items the seller is aware of (foundation, flood, title, zoning, code violations)?
- Is there a deadline driving the sale (1031 exchange, divorce, estate, relocation)? That informs how much negotiation room exists.
- The area grade is low — what's the realistic commute time and amenity access for the typical tenant pool here? Any planned neighborhood developments (good or bad) we should know about?
- This sits on a lake — are riparian / water-frontage rights deeded with the parcel? Any dock permits, shoreline easements, or HOA water-use restrictions?
- What's the documented flood / surge / shoreline-erosion history here (FEMA AND non-FEMA — e.g., storm surge, creek backup, septic-field saturation)?
- Any water-quality or seasonal algae-bloom issues that affect tenant satisfaction or short-term-rental demand?
- What's the average days-on-market for RENTAL listings here right now (not sales)? A rising rental-DOM trend means longer vacancies and softer asking-rent achievability than the comps imply.
- What's the recent tenant-quality profile in this submarket — average credit score on applications, eviction rate, late-payment / NSF rate, and stable-employment percentage? A property-management company in the area should have these aggregated.
- How much new apartment / multifamily construction is in the pipeline within 1–3 miles? Heavy new supply (>2% of stock underway) typically softens rents 12–24 months out; light construction supports rent growth.
Investment metrics
- 1% rule
- 0.63% ✗
- Cap rate
- 2.07%
- Cash-on-cash
- -15.08%
- DSCR
- 0.33
- GRM
- 13.2
CMA / ARV
- ARV (median comp)
- $712,726
- List price
- $439,000
- Delta
- -38.41%
- Verdict
- UNDERPRICED
- Comps
- 20 within 1.0 mi
Projected returns pro-forma
10.0% appreciation · 3.0% rent growth · sell at horizon
- IRR
- 13.4%
- Equity multiple
- 2.11×
- Total profit
- $136,957
- Equity at exit
- $395,486
- IRR
- 13.6%
- Equity multiple
- 4.95×
- Total profit
- $485,046
- Equity at exit
- $852,880
Cash invested: $122,920 (down + closing). Projections, not guarantees.
Landlord ↔ Tenant lean methodology
- Overall (STATE)
- 87 Strongly Landlord-Friendly
- State Florida
- 87 Strongly Landlord-Friendly · R+3
- County
- — inherits STATE
- City
- — inherits STATE
ZIP-level market 34996
- Home prices YoY
- 2.1%
- Active inventory
- 251
- Price-to-rent
- 13.2×
Monthly cashflow live
- Estimated rent
- $2,763 medium interval (Pro) →
- Mortgage (P&I)
- −$2,302
- Tax from tax record
- −$443 /mo · $5,316/yr
- Insurance
- −$183
- Flood insurance flood zone
- −$66 /mo · $798/yr
- HOA
- −$800
- Vacancy / Maint / Mgmt
- −$580
- Net cashflow
- $-1,612
Break-even live
UW: 25.0% down · 7.5% · 30yr · 1.5% tax · 5.0% vac · 8.0% maint · 8.0% mgmt
Financing live
Cash to close
- Down payment
- $109,750
- Closing costs
- $13,170
- Reserves months
- —
- Total cash needed
- —
Loan-product check · same deal, 3 products live
Conventional
25% down · 7.5% · 30yr
- Down + closing
- —
- Monthly P&I
- —
- Monthly cashflow
- —
- DSCR
- —
- Eligible?
- —
Personal DTI + credit; lowest rate.
DSCR
20% down · 8.5% · 30yr
- Down + closing
- —
- Monthly P&I
- —
- Monthly cashflow
- —
- DSCR
- —
- Eligible?
- —
No personal income docs; deal must DSCR.
Hard money
10% down · 12.0% · 12mo
- Down + closing
- —
- Monthly P&I
- —
- Monthly cashflow
- —
- DSCR
- —
- Eligible?
- —
Short-term bridge; refi at stabilization.
Rent comps 40 comps
| Address | Beds | Baths | Sqft | Rent | $/sqft | DOM | Units | Dist |
|---|---|---|---|---|---|---|---|---|
| 5564 NE Gulfstream Way Stuart, FL | 2.0 | 2.0 | 1100 | $5,000 | $4.55 | 23d | 1 | 0.04mi |
| 669 NE Plantation Rd Stuart, FL | 2.0 | 2.0 | 1400 | $8,250 | $5.89 | 23d | 2 | 0.19mi |
| 484 NE Plantation Rd #4108 Stuart, FL | 2.0 | 2.0 | 1000 | $5,500 | $5.50 | 23d | 1 | 0.20mi |
| 484 NE Plantation Rd #4103 Stuart, FL | 2.0 | 2.0 | 971 | $6,000 | $6.18 | 23d | 1 | 0.20mi |
| 391 NE Plantation Rd #228 Stuart, FL | 2.0 | 2.0 | 1274 | $2,200 | $1.73 | 23d | 1 | 0.21mi |
| 391 NE Plantation Rd #226 Stuart, FL | 2.0 | 2.0 | 1300 | $4,500 | $3.46 | 23d | 1 | 0.21mi |
| 391 NE Plantation Rd #215 Stuart, FL | 2.0 | 2.0 | 1253 | $4,000 | $3.19 | 23d | 1 | 0.21mi |
| 579 NE Plantation Rd Unit 301-N Stuart, FL | 3.0 | 2.0 | 1565 | $8,500 | $5.43 | 23d | 1 | 0.22mi |
| 411 NE Plantation Rd #526 Stuart, FL | 2.0 | 2.0 | 1274 | $6,000 | $4.71 | 23d | 1 | 0.26mi |
| 411 NE Plantation Rd #511 Stuart, FL | 2.0 | 2.0 | 1253 | $7,500 | $5.99 | 23d | 1 | 0.26mi |
| 310 Golfview Cir Unit 310 Stuart, FL | 3.0 | 3.0 | 1150 | $2,000 | $1.74 | 14d | 1 | 0.26mi |
| 311 NE Golfview Cir Stuart, FL | 2.0 | 2.0 | 961 | $3,500 | $3.64 | 23d | 1 | 0.26mi |
| 324 Golfview Cir #324 Stuart, FL | 3.0 | 3.0 | 1150 | $7,000 | $6.09 | 23d | 1 | 0.27mi |
| 271 NE Edgewater Dr #271 Stuart, FL | 3.0 | 3.0 | 1437 | $8,000 | $5.57 | 23d | 1 | 0.35mi |
| 233 NE Edgewater Dr Stuart, FL | 2.0–3.0 | 2.0–3.0 | 1534 | $2,200 | $1.43 | 23d | 3 | 0.36mi |
| 221 NE Plantation Rd Stuart, FL | 2.0 | 2.0 | 1296 | $4,350 | $3.36 | 23d | 3 | 0.36mi |
| 350 NE Edgewater Dr #202 Stuart, FL | 2.0 | 2.0 | 970 | $2,500 | $2.58 | 23d | 1 | 0.36mi |
| 185 NE Edgewater Dr #5105 Stuart, FL | 2.0 | 2.0 | 1366 | $6,500 | $4.76 | 23d | 1 | 0.37mi |
| 264 NE Edgewater Dr #102 Stuart, FL | 1.0 | 1.0 | 911 | $2,100 | $2.31 | 23d | 1 | 0.39mi |
| 40 NE Plantation Rd #304 Stuart, FL | 2.0 | 2.0 | 1039 | $2,700 | $2.60 | 23d | 1 | 0.40mi |
| 40 NE Plantation Rd #203 Stuart, FL | 2.0 | 2.0 | 1039 | $5,900 | $5.68 | 14d | 1 | 0.40mi |
| 40 NE Plantation Rd #110 Stuart, FL | 2.0 | 2.0 | 1039 | $6,500 | $6.26 | 23d | 1 | 0.40mi |
| 40 NE Plantation Rd #209 Stuart, FL | 2.0 | 2.0 | 1039 | $6,000 | $5.77 | 23d | 1 | 0.40mi |
| 40 NE Plantation Rd #309 Stuart, FL | 2.0 | 2.0 | 1039 | $1,800 | $1.73 | 23d | 1 | 0.40mi |
| 40 NE Plantation Rd #410 Stuart, FL | 2.0 | 2.0 | 1039 | $5,200 | $5.00 | 23d | 1 | 0.40mi |
| 40 NE Plantation Rd #208 Stuart, FL | 2.0 | 2.0 | 1039 | $5,100 | $4.91 | 23d | 1 | 0.40mi |
| 144 NE Edgewater Dr #3102 Stuart, FL | 3.0 | 2.0 | 1735 | $2,400 | $1.38 | 23d | 1 | 0.43mi |
| 245 NE MacArthur Blvd Stuart, FL | 2.0 | 2.5 | 1310 | $7,750 | $5.92 | 23d | 2 | 0.45mi |
| 20 NE Plantation Rd #306 Stuart, FL | 2.0 | 2.0 | 1306 | $3,500 | $2.68 | 23d | 1 | 0.45mi |
| 20 NE Plantation Rd #205 Stuart, FL | 2.0 | 2.0 | 1306 | $2,900 | $2.22 | 23d | 1 | 0.45mi |
| 5799 NE Island Cove Way Unit 1546190P Stuart, FL | 2.0 | 2.0 | 1270 | $2,029 | $1.60 | 14d | 1 | 0.47mi |
| 5750 NE Island Cove Way #3302 Stuart, FL | 2.0 | 2.0 | 1204 | $2,450 | $2.03 | 14d | 1 | 0.47mi |
| 5800 NE Island Cove Way #2207 Stuart, FL | 2.0 | 2.0 | 1204 | $3,500 | $2.91 | 23d | 1 | 0.47mi |
| 1289 NE Ocean Blvd Stuart, FL | 2.0 | 2.0 | 1234 | $5,700 | $4.62 | 21d | 5 | 0.61mi |
| 1357 NE Ocean Blvd Stuart, FL | 2.0 | 2.0 | 1204 | $5,250 | $4.36 | 21d | 2 | 0.70mi |
| 1357 NE Ocean Blvd #312 Stuart, FL | 2.0 | 2.0 | 1242 | $5,500 | $4.43 | 23d | 1 | 0.70mi |
| 1501 NE Ocean Blvd #2 Stuart, FL | 2.0 | 1.5 | 925 | $4,300 | $4.65 | 23d | 1 | 0.80mi |
| 1550 NE Ocean Blvd Stuart, FL | 2.0 | 2.0 | 1101 | $2,125 | $1.93 | 23d | 2 | 1.02mi |
| 2051 NE Ocean Blvd Unit C13 Stuart, FL | 2.0 | 2.0 | 1545 | $4,000 | $2.59 | 14d | 1 | 1.33mi |
| 2051 NE Ocean Blvd Stuart, FL | 2.0 | 2.0 | 1545 | $3,250 | $2.10 | 23d | 2 | 1.34mi |
HOA detail condo
- Monthly dues
- $800 · $9,600/yr
- Likely covers
- poolgym
- Assessments
- None detected in remarks — confirm with the listing agent.
Listing history 28 events
-
2026-06-18days on market $439,000 Active 61 DOM
-
2026-06-17days on market $439,000 Active 60 DOM
-
2026-06-16days on market $439,000 Active 59 DOM
-
2026-06-15days on market $439,000 Active 58 DOM
-
2026-06-14days on market $439,000 Active 56 DOM
-
2026-06-13days on market $439,000 Active 55 DOM
-
2026-06-10days on market $439,000 Active 53 DOM
-
2026-06-09days on market $439,000 Active 52 DOM
-
2026-06-08days on market $439,000 Active 51 DOM
-
2026-06-07days on market $439,000 Active 50 DOM
-
2026-06-03days on market $439,000 Active 46 DOM
-
2026-06-02days on market $439,000 Active 45 DOM
-
2026-06-01days on market $439,000 Active 44 DOM
-
2026-05-31days on market $439,000 Active 43 DOM
-
2026-05-31days on market $439,000 Active 42 DOM
-
2026-04-18$465,000 Active 927-char remark
Show marketing remark (927 chars)
Beautifully renovated top-floor 2-story townhome in the desirable Lakeside community, offering serene lake and golf course views. This spacious 2BR/2.5BA residence is being sold furnished and features white shaker cabinetry, granite countertops, stainless steel appliances, and durable luxury vinyl plank flooring throughout. The flexible layout offers multiple indoor and outdoor living spaces, including an open patio, screened patio, and two enclosed balconies that provide additional usable square footage and abundant natural light—ideal for relaxing or entertaining. Residents enjoy a heated community pool, grilling areas, and a pet-friendly environment for owners. Conveniently located near beach access, dining, and local amenities. Optional Ocean Club membership available, providing private beach access, additional pools, hot tubs, fitness centers, tiki bars, café, bowling alley, and clubhouse dining.
-
2026-04-01historical $7,000
-
2026-01-29price $7,000
-
2026-01-23price $4,750
-
2025-12-03price $2,500
-
2025-10-24price $4,750
-
2025-07-08price $6,500
-
2025-03-21$7,000
-
2025-01-24soldstatus $415,000
-
2025-01-08soldstatus $415,000 Closed 391-char remark
Show marketing remark (391 chars)
top floor two-story townhome in Lakeside. The unit features an open patio, screened patio and two enclosed balconies that offer extra square footage. The unit nice view of the lake and golf cart bridge. The unit is being offered partially furnished. Lakeside has a large heated pool and access to the private beach, two tiki bars, and two restaurants. Pet friendly community for owners only.
-
2024-11-27status Pending 391-char remark
Show marketing remark (391 chars)
top floor two-story townhome in Lakeside. The unit features an open patio, screened patio and two enclosed balconies that offer extra square footage. The unit nice view of the lake and golf cart bridge. The unit is being offered partially furnished. Lakeside has a large heated pool and access to the private beach, two tiki bars, and two restaurants. Pet friendly community for owners only.
-
2024-11-21$450,000 Active 391-char remark
Show marketing remark (391 chars)
top floor two-story townhome in Lakeside. The unit features an open patio, screened patio and two enclosed balconies that offer extra square footage. The unit nice view of the lake and golf cart bridge. The unit is being offered partially furnished. Lakeside has a large heated pool and access to the private beach, two tiki bars, and two restaurants. Pet friendly community for owners only.
-
1995-05-04soldstatus $169,000
ⓘ Source: listings_history table (triggers on properties + properties_extension) + one-shot
backfill from property_details.listing_events for pre-trigger history.
Tax reassessment forecast FL · Resets to sale price
- Current annual tax
- $5,316 · $443/mo
- Projected year-2 tax
- $5,316 · $443/mo
- Expected delta
- $0/yr ($0/mo · 0.0%)
ⓘ Screening estimate from a state-policy table — verify with the county assessor before closing.
Climate risk First Street
- Flood 10/10 Extreme FEMA zone X (shaded) · 99% chance over 30 yrs
- Wildfire 2/10 Low
- Heat 10/10 Extreme 7 d/yr ≥106°F today · 26 d/yr by 30 yrs out
- Wind 10/10 Extreme 99% chance of damaging wind over 30 yrs
- Air quality 2/10 Low 2 unhealthy d/yr today · 2 by 30 yrs out
Nearby sold comps map
Loading sold comps map…
Walkable amenities ~0.75 mi
Loading nearby amenities…
Taxation est. · year 1
- Rental income
- $33,158
- − Mortgage interest
- −$24,591
- − Property taxes
- −$5,316
- − Insurance
- −$2,992
- − Repairs & maintenance
- −$2,653
- − Management
- −$2,653
- − HOA
- −$9,600
- − Depreciation
- −$12,771
- Taxable loss
- −$27,417
- Est. tax savings @ 24.0%
- +$6,580
- After-tax cash flow
- $-12,759/yr
For passive investors: Depreciation is non-cash, so a rental often shows a tax loss while cash-flowing — sheltering income. Rental losses are passive: they offset passive income freely, and up to $25,000/yr can offset ordinary (W-2) income if you actively participate and your MAGI is under $100k (phasing out to $0 by $150k); unused losses carry forward. On sale, claimed depreciation is recaptured at up to 25%, and gains may owe capital-gains tax (a 1031 exchange can defer both). Figures are a year-1 estimate at your 24.0% rate — not tax advice; consult a CPA.
Schools (NCES district)
- District
- Martin
- NCES district ID
- 1201290
- Math proficiency
- 52% ▼ -14.00%
- Reading proficiency
- 53% ▼ -4.00%
- Median HH income
- $52,482
- Composite
- 45.1/100
- National rank
- #2690
- State rank
- #24 of 73 in FL
Livability — Sewall's Point
No livability data for this city. (Only ~50 U.S. cities are tracked.)
Census & demographics
- County
- Martin County · 165,223 people
- City population
- 10,875
- Metro
- Port St. Lucie, FL
- Population (ZIP)
- 10,653
- Household income
- $83,929
- Rent vs Own
- Severe rent burden
- 247.0
Population outlook (Martin County) Hauer SSP2
- Today (2025)
- 172,383 people
- By 2030
- 180,192 · +4.5%
- By 2040
- 194,114 · +12.6%
- By 2050
- 204,992 · +18.9%
- By 2075
- 229,641 · +33.2%
- By 2100
- 232,146 · +34.7%
Race, ethnicity, and origin ACS 2023
- Neighborhood character
- Predominantly White (90%)
- Race & ethnicity
- White 90% Hispanic / Latino 7% Two or more races 5%
- Hispanic origin (detail)
- Puerto Rican 2%
- Common ancestry
- Italian 3% Romanian 3% Slovak 3%
- Foreign-born
- 6% · Canada
- Languages at home
- 94% English-only · Spanish 3% Other Indo-European 1% French/Haitian/Cajun 1%
Political lean MEDSL · Martin
- 2024 margin
- Solid R (+31.1) · D 34.1% · R 65.2%
- 2008→2024 swing
- -17.5pp toward R · 2008: -13.6pp · 2024: -31.1pp
- All cycles
- 2024: R+31.1 2020: R+24.6 2016: R+26.9 2012: R+22.9 2008: R+13.6
Not yet ingested
- Civics
- —
Market trends
- HPI YoY
- ▲ 13.71%
- Current HPI
- 658.96
- Rent YoY
- —
- Metro
- Port St. Lucie, FL
- State GDP YoY
- ▲ 3.28%
- F500 in state
- 36
Industry mix (Fortune 500 HQ in FL)
| Industry | F500 HQs | Revenue |
|---|---|---|
| Industrial Technology | 2 | $29B |
|
||
| Insurance | 2 | $17B |
|
||
| Retail | 1 | $60B |
|
||
| Technology Distribution | 1 | $58B |
|
||
| Homebuilding | 1 | $35B |
|
||
| Technology Manufacturing | 1 | $35B |
|
||
Price history
+175.1% since first listed13 events — show timeline
- 2026-04-18 Listed $465,000 MCRTC
- 2026-04-01 Rental Removed $7,000 MCRTC
- 2026-01-29 Price Changed $7,000 MCRTC
- 2026-01-23 Price Changed $4,750 MCRTC
- 2025-12-03 Price Changed $2,500 MCRTC
- 2025-10-24 Price Changed $4,750 MCRTC
- 2025-07-08 Price Changed $6,500 MCRTC
- 2025-03-21 Listed for Rent $7,000 MCRTC
- 2025-01-24 Sold (Public Records) $415,000 Public Records
- 2025-01-08 Sold (MLS) $415,000 MCRTC
- 2024-11-27 Pending — MCRTC
- 2024-11-21 Listed $450,000 MCRTC
- 1995-05-04 Sold (Public Records) $169,000 Public Records
Property tax history
+4.0%/yrLatest (2025): $5,316 · +1.4% YoY. Source: county tax records.
Cash-flow waterfall
monthlySold comps — $/sqft
last 12 mo · ≤1 miLoading sold comps…