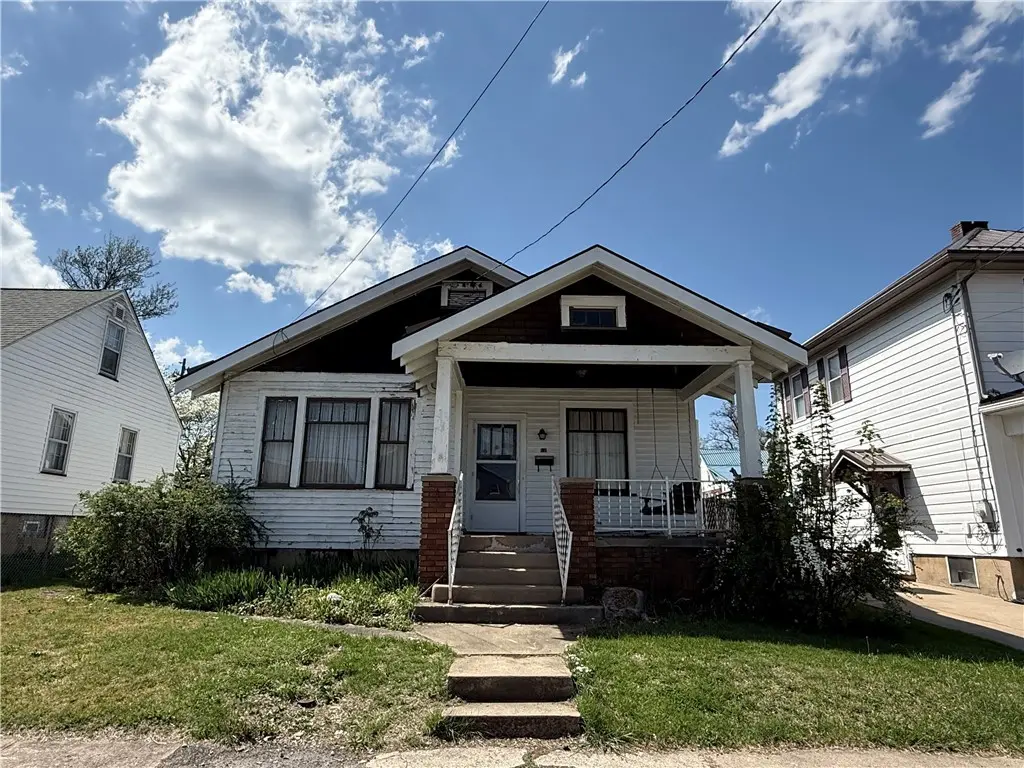
12 Connor St · South Union, PA
Flood risk 1/10 · Minimal
- FEMA flood zone
- X (unshaded)
- Chance of flooding over 30 yrs
- 0.0%
- Est. flood insurance / yr
- $473 – $860
Fire risk 1/10 · Minimal
- Est. fire insurance / yr
- $511 – $949
Heat risk 4/10 · Minor
- Hot days now (above 96°F)
- 7 days/yr
- Hot days in 30 yrs
- 19 days/yr
Wind risk 2/10 · Minimal
- Chance of severe wind over 30 yrs
- —
Air-quality risk 2/10 · Minimal
- Unhealthy air days now
- 1 days/yr
- Unhealthy air days in 30 yrs
- 2 days/yr
Risk factors via First Street. Map © Google.
Why this score? — see what drove the B- grade
The composite is a weighted blend of 9 inputs, each scored 0–100. Each bar is that input's sub-score; the figure is the points it added to the 100-point composite (weight × sub-score).
- Cash flow +30.0/30.0
- 1% rule +10.0/10.0
- DSCR +10.0/10.0
- ARV discount +7.5/15.0
- Schools +3.3/10.0
- Rent growth +2.5/5.0
- Livability +2.5/5.0
- Condition / age +2.5/5.0
- Appreciation +0.9/10.0
$89,000
🖨 Deal sheet 📄 Offer letter ✓ Due diligence
Listing remarks MLS
Unlock the potential at 12 Connor Street! This AS IS fixer upper is a solid opportunity for investors or contractors looking for their next project. With the right updates, this property offers excellent potential for resale or long term rental income. Situated in an established neighborhood, the location is a major advantage and is just minutes from major highways, providing easy access for commuters, and close to schools, parks, shopping, and dining. Bring your vision and transform this property into a profitable investment. Opportunities like this at an accessible price point don’t last long. Schedule your showing and explore the possibilities today!
Key facts
- Close to parks
- Close to schools
- Close to dining
Tags
Neighborhood map
What this means for you Summary
Snapshot
- This is a 3-bed/1.0-bath single-family listed at $89k.
Deal economics
- At list price, monthly cash flow is $712 ($9k/yr) — positive.
- The deal already cash-flows at list — no discount required.
- Meets the 1% rule at list price ($2k rent vs $89k).
- Recommended offer: $84k (6.0% below list) — sets the bar for market timing.
Location & tenants
- Location reads: area grade B — affects rentability + tenant quality, not the cash-flow math above.
- Laurel Highlands SD (suburban): math 29% / reading 49% proficiency, ranked #372 of 539 in PA (top 69%) — families likely to look elsewhere, expect single-tenant / working-renter base with shorter leases.
- Market conditions: 145 active listings in the ZIP; 2 comparable units currently listed for rent nearby; 201 units permitted in Fayette County in 2024 (10 in 5+ unit buildings).
Forward outlook
- Local home prices are declining (-3.0%/yr); year-one equity from $615 of loan paydown is wiped out by about $3k of value loss. Plan a longer hold.
- Fayette County population projected at -19% by 2050 — secular population decline; favor cash flow + early exit over multi-decade hold.
- At projected returns (-3.0% appreciation + 3.0% rent growth), your $25k cash investment doubles in ~4 years — after that, you're playing with house money.
Negotiation context
- It's been on market 61 days — a 6% lower offer ($84k) is reasonable based on typical stale-listing flexibility.
Risks & watch-outs
- Watch-outs: built in 1920 — expect roof / HVAC / electrical / plumbing capex.
Questions for the listing agent
- It's been on market 61 days. Have you received any prior offers? Is the seller open to a 6% concession, seller financing, or rate buy-down credit?
- Built in 1920 — when were the roof, HVAC, electrical panel, plumbing, and water heater last replaced?
- Why hasn't it sold? Are there any deal-killer items the seller is aware of (foundation, flood, title, zoning, code violations)?
- Is there a deadline driving the sale (1031 exchange, divorce, estate, relocation)? That informs how much negotiation room exists.
- What's the average days-on-market for RENTAL listings here right now (not sales)? A rising rental-DOM trend means longer vacancies and softer asking-rent achievability than the comps imply.
- What's the recent tenant-quality profile in this submarket — average credit score on applications, eviction rate, late-payment / NSF rate, and stable-employment percentage? A property-management company in the area should have these aggregated.
- How much new for-sale + rental construction is in the pipeline within 1–3 miles? Heavy new supply typically softens prices + rents 12–24 months out; constrained supply supports both.
Investment metrics
- 1% rule
- 1.93% ✓
- Cap rate
- 15.90%
- Cash-on-cash
- 34.30%
- DSCR
- 2.53
- GRM
- 4.3
CMA / ARV
- ARV (median comp)
- $186,072
- List price
- $89,000
- Delta
- -52.17%
- Verdict
- UNDERPRICED
- Comps
- 20 within 1.0 mi
Show comp detail 10 sales within ~0.75 mi
| Address | Dist | Beds/Ba | Sqft | Sold | Price | $/sf | Match |
|---|---|---|---|---|---|---|---|
| 74 Mullan St | 0.17mi | 3/1.0 | 1,248 (-2%) | 6mo | $116,000 | $93 | 84 |
| 50 Vernon St | 0.32mi | 2/1.0 (-1) | 1,300 (+2%) | 3mo | $155,000 | $119 | 75 |
| 94 Dixon Blvd | 0.18mi | 3/2.5 | 1,346 (+6%) | 11mo | $183,000 | $136 | 68 |
| 183 Carnation St | 0.22mi | 3/2.0 | 1,257 (-2%) | 22mo | $165,000 | $131 | 65 |
| 26 Wilmac St | 0.15mi | 2/1.5 (-1) | 1,126 (-12%) | 4mo | $125,000 | $111 | 64 |
| 165 Dixon Blvd | 0.04mi | 3/2.0 | 1,100 (-14%) | 14mo | $169,000 | $154 | 59 |
| 62 Mullen St | 0.13mi | 3/1.0 | 1,462 (+15%) | 17mo | $113,500 | $78 | 56 |
| 35 Jeffries | 0.43mi | 4/1.5 (+1) | 1,245 (-2%) | 16mo | $205,000 | $165 | 56 |
| 30 Wiggins Ln | 0.55mi | 3/2.0 | 1,384 (+8%) | 7mo | $290,000 | $210 | 50 |
| 17 Margaret St | 0.43mi | 2/2.0 (-1) | 1,120 (-12%) | 19mo | $239,000 | $213 | 35 |
Match score weights: distance 35% · size 25% · config 20% · recency 20%. Top-matched comps best support the ARV.
Projected returns pro-forma
-3.0% appreciation · 3.0% rent growth · sell at horizon
- IRR
- 29.7%
- Equity multiple
- 2.24×
- Total profit
- $30,985
- Equity at exit
- $13,270
- IRR
- 37.1%
- Equity multiple
- 4.43×
- Total profit
- $85,572
- Equity at exit
- $7,695
Cash invested: $24,920 (down + closing). Projections, not guarantees.
Landlord ↔ Tenant lean methodology
- Overall (STATE)
- 62 Landlord-Friendly
- State Pennsylvania
- 62 Landlord-Friendly · EVEN
- County
- — inherits STATE
- City
- — inherits STATE
ZIP-level market 15401
- Home prices YoY
- -3.8%
- Active inventory
- 145
- Price-to-rent
- 4.3×
Monthly cashflow live
- Estimated rent
- $1,718 medium interval (Pro) →
- Mortgage (P&I)
- −$467
- Tax from tax record
- −$141 /mo · $1,690/yr
- Insurance
- −$37
- HOA
- −$0
- Vacancy / Maint / Mgmt
- −$361
- Net cashflow
- $712
Break-even live
UW: 25.0% down · 7.5% · 30yr · 1.5% tax · 5.0% vac · 8.0% maint · 8.0% mgmt
Financing live
Cash to close
- Down payment
- $22,250
- Closing costs
- $2,670
- Reserves months
- —
- Total cash needed
- —
Loan-product check · same deal, 3 products live
Conventional
25% down · 7.5% · 30yr
- Down + closing
- —
- Monthly P&I
- —
- Monthly cashflow
- —
- DSCR
- —
- Eligible?
- —
Personal DTI + credit; lowest rate.
DSCR
20% down · 8.5% · 30yr
- Down + closing
- —
- Monthly P&I
- —
- Monthly cashflow
- —
- DSCR
- —
- Eligible?
- —
No personal income docs; deal must DSCR.
Hard money
10% down · 12.0% · 12mo
- Down + closing
- —
- Monthly P&I
- —
- Monthly cashflow
- —
- DSCR
- —
- Eligible?
- —
Short-term bridge; refi at stabilization.
Rent comps 2 comps
| Address | Beds | Baths | Sqft | Rent | $/sqft | DOM | Units | Dist |
|---|---|---|---|---|---|---|---|---|
| 189 Wiggins Ln Uniontown, PA | 3.0 | 2.0 | 1663 | $2,300 | $1.38 | 43d | 1 | 0.79mi |
| 22 Locust St Uniontown, PA | 2.0 | 1.0 | 1080 | $720 | $0.67 | 43d | 1 | 1.48mi |
Listing history 15 events
-
2026-06-18days on market $89,000 Active 61 DOM
-
2026-06-17days on market $89,000 Active 60 DOM
-
2026-06-16days on market $89,000 Active 59 DOM
-
2026-06-15days on market $89,000 Active 58 DOM
-
2026-06-13days on market $89,000 Active 56 DOM
-
2026-06-12days on market $89,000 Active 55 DOM
-
2026-06-09pricedays on market $89,000 Active 52 DOM
-
2026-06-08days on market $99,000 Active 51 DOM
-
2026-06-08days on market $99,000 Active 50 DOM
-
2026-06-07days on market $99,000 Active 49 DOM
-
2026-06-04days on market $99,000 Active 46 DOM
-
2026-06-02days on market $99,000 Active 45 DOM
-
2026-06-01days on market $99,000 Active 44 DOM
-
2026-05-31days on market $99,000 Active 43 DOM
-
2026-04-18$99,000 Active 669-char remark
Show marketing remark (669 chars)
Unlock the potential at 12 Connor Street! This AS IS fixer upper is a solid opportunity for investors or contractors looking for their next project. With the right updates, this property offers excellent potential for resale or long term rental income. Situated in an established neighborhood, the location is a major advantage and is just minutes from major highways, providing easy access for commuters, and close to schools, parks, shopping, and dining. Bring your vision and transform this property into a profitable investment. Opportunities like this at an accessible price point don’t last long. Schedule your showing and explore the possibilities today!
ⓘ Source: listings_history table (triggers on properties + properties_extension) + one-shot
backfill from property_details.listing_events for pre-trigger history.
Tax reassessment forecast PA · Partial reset (capped growth)
- Current annual tax
- $1,690 · $141/mo
- Projected year-2 tax
- $1,690 · $141/mo
- Expected delta
- $0/yr ($0/mo · 0.0%)
ⓘ Screening estimate from a state-policy table — verify with the county assessor before closing.
Climate risk First Street
- Flood 1/10 Low FEMA zone X (unshaded) · 0% chance over 30 yrs
- Wildfire 1/10 Low
- Heat 4/10 Moderate 7 d/yr ≥96°F today · 19 d/yr by 30 yrs out
- Wind 2/10 Low
- Air quality 2/10 Low 1 unhealthy d/yr today · 2 by 30 yrs out
Nearby sold comps map
Loading sold comps map…
Walkable amenities ~0.75 mi
Loading nearby amenities…
Taxation est. · year 1
- Rental income
- $20,610
- − Mortgage interest
- −$4,985
- − Property taxes
- −$1,690
- − Insurance
- −$445
- − Repairs & maintenance
- −$1,649
- − Management
- −$1,649
- − Depreciation
- −$2,589
- Taxable income
- $7,604
- Est. tax owed @ 24.0%
- −$1,825
- After-tax cash flow
- $6,722/yr
For passive investors: Depreciation is non-cash, so a rental often shows a tax loss while cash-flowing — sheltering income. Rental losses are passive: they offset passive income freely, and up to $25,000/yr can offset ordinary (W-2) income if you actively participate and your MAGI is under $100k (phasing out to $0 by $150k); unused losses carry forward. On sale, claimed depreciation is recaptured at up to 25%, and gains may owe capital-gains tax (a 1031 exchange can defer both). Figures are a year-1 estimate at your 24.0% rate — not tax advice; consult a CPA.
Schools (NCES district)
- District
- Laurel Highlands SD
- NCES district ID
- 4213320
- Math proficiency
- 29% ▼ -8.00%
- Reading proficiency
- 49% ▼ -3.00%
- Median HH income
- $41,099
- Composite
- 32.74/100
- National rank
- #5637
- State rank
- #372 of 539 in PA
Livability — South Union
No livability data for this city. (Only ~50 U.S. cities are tracked.)
Census & demographics
- Census place
- South Uniontown, PA
- Population (ZIP)
- 30,230
Population outlook (Fayette County) Hauer SSP2
- Today (2025)
- 127,561 people
- By 2030
- 123,206 · -3.4%
- By 2040
- 113,232 · -11.2%
- By 2050
- 103,468 · -18.9%
- By 2075
- 83,185 · -34.8%
- By 2100
- 62,384 · -51.1%
Race, ethnicity, and origin ACS 2023
- Neighborhood character
- Predominantly White (86%)
- Race & ethnicity
- White 86% Black 7% Two or more races 5% Hispanic / Latino 1%
- Common ancestry
- Romanian 8% Scotch-Irish 2% Iranian 1%
- Foreign-born
- 2% · Canada
- Languages at home
- 97% English-only · Spanish 1% Arabic 1%
Political lean MEDSL · Fayette
- 2024 margin
- Solid R (+37.9) · D 30.8% · R 68.7%
- 2008→2024 swing
- -37.5pp toward R · 2008: -0.4pp · 2024: -37.9pp
- All cycles
- 2024: R+37.9 2020: R+33.5 2016: R+31.0 2012: R+8.3 2008: R+0.4
Not yet ingested
- Civics
- —
Market trends
- HPI YoY
- ▼ -8.29%
- Current HPI
- 210.1257
- Rent YoY
- —
- Metro
- —
- State GDP YoY
- ▲ 1.68%
- F500 in state
- 34
Industry mix (Fortune 500 HQ in PA)
| Industry | F500 HQs | Revenue |
|---|---|---|
| Healthcare | 2 | $309B |
|
||
| Insurance | 2 | $27B |
|
||
| Telecommunications / Media | 1 | $124B |
|
||
| Industrial Distribution | 1 | $22B |
|
||
| Financial Services | 1 | $20B |
|
||
| Chemicals / Materials | 1 | $18B |
|
||
Price history
1 event — show timeline
- 2026-04-18 Listed $99,000 West Penn MLS
Property tax history
+3.5%/yrLatest (2026): $1,690 · +0.0% YoY. Source: county tax records.
Cash-flow waterfall
monthlySold comps — $/sqft
last 12 mo · ≤1 miLoading sold comps…