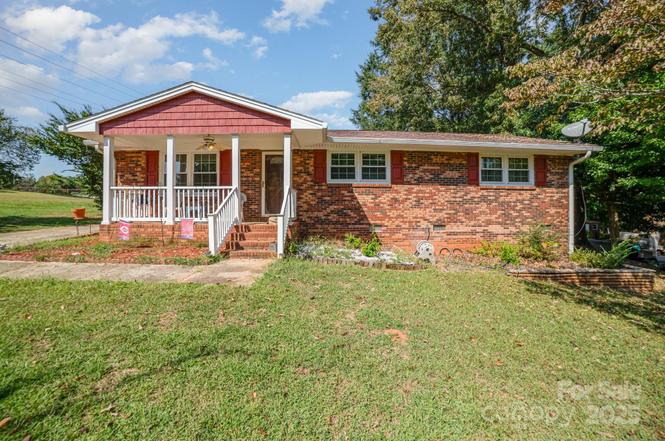
801 Windwood Dr · Gastonia, NC
Flood risk 1/10 · Minimal
- FEMA flood zone
- X (unshaded)
- Chance of flooding over 30 yrs
- 0.0%
- Est. flood insurance / yr
- $507 – $1,088
Fire risk 4/10 · Minor
- Est. fire insurance / yr
- $906 – $1,684
Heat risk 6/10 · Moderate
- Hot days now (above 104°F)
- 7 days/yr
- Hot days in 30 yrs
- 17 days/yr
Wind risk 5/10 · Moderate
- Chance of severe wind over 30 yrs
- 21.0%
Air-quality risk 3/10 · Minor
- Unhealthy air days now
- 3 days/yr
- Unhealthy air days in 30 yrs
- 3 days/yr
Risk factors via First Street. Map © Google.
Why this score? — see what drove the D- grade
The composite is a weighted blend of 9 inputs, each scored 0–100. Each bar is that input's sub-score; the figure is the points it added to the 100-point composite (weight × sub-score).
- Cash flow +12.7/30.0
- ARV discount +6.8/15.0
- DSCR +3.8/10.0
- Schools +3.6/10.0
- Rent growth +3.0/5.0
- Livability +3.0/5.0
- 1% rule +2.8/10.0
- Condition / age +2.5/5.0
- Appreciation +0.0/10.0
$235,000
🖨 Deal sheet (PDF) 📄 Offer letter ✓ Due diligence
Listing remarks
* * * * * Offering $5000 towards buyer expenses * * * * * * . Discover the perfect opportunity to make this property your own! This all-brick home offers 3 bedrooms and 1.5 baths, with a spacious backyard featuring both a workshop and a storage building. The crawlspace has been encapsulated for added protection, while the interior provides a blank canvas ready for your personal touch and updates. With no HOA, you’ll enjoy flexibility and freedom. Nestled on a quiet dead-end road, this home is ideal for first-time buyers or anyone looking for a great investment. Don’t miss out—schedule your showing today!
Key facts
- Spacious backyard
- Storage building
- Quiet dead-end road
Tags
Property features AI
Finance
- HOA & community: No HOA
Exterior
- Parking: Driveway
- Utilities: City water; Public sewer
- Home design: Single-family residence; One story; Site-built construction; Brick exterior; R1 zoning
- Construction: Brick full exterior; Site-built construction; Crawl space foundation; Built as one level
- Exterior features: Concrete and gravel road access; Publicly maintained road
Interior
- Kitchen: Electric oven; Electric range; Oven; Refrigerator
- Bedrooms: Three bedrooms on the main level
- Bathrooms: One full bathroom; One half bathroom
- Heating & cooling: Central heating; Central air conditioning
- Interior features: Five total rooms; Crawl space foundation
- Laundry & utility: Laundry located in the kitchen
Neighborhood map
What this means for you Summary
Snapshot
- This is a 3-bed/1.0-bath single-family listed at $235k.
Deal economics
- At list price, monthly cash flow is $-24 ($-284/yr) — negative.
- To cash-flow at today's rent, offer at most $231k (1.8% below list).
- To meet the 1% rule (rent ≥ 1% of price), the offer needs to be $183k (22.2% below list).
- Recommended offer: $183k (22.2% below list) — sets the bar for 1% rule.
- Cap rate 6.2% vs local median 3.7% in Gastonia — top-decile yield for the area; either an underpriced asset or a hidden risk that comps aren't pricing in. Stress-test before assuming the spread holds.
Location & tenants
- Location reads 59/100 on livability (#528 in NC) — a working-class tenant base; expect higher turnover. Strengths: cost of living A+, housing A+; Watch: employment D, crime F, amenities F.
- Gaston County Schools (suburban): math 44% / reading 42% proficiency, ranked #93 of 178 in NC (top 52%) — families likely to look elsewhere, expect single-tenant / working-renter base with shorter leases.
- Zoned schools: H H Beam Elementary (math 13% / reading 13%, grade F, #1,356 of 1,410 statewide, top 96%, 510 students, 99% FRL); Southwest Middle (math 35% / reading 30%, grade F, #312 of 475 statewide, top 66%, 804 students, 100% FRL); Forestview High (math 72% / reading 59%, grade B, #159 of 535 statewide, top 30%, 1,081 students, 47% FRL) — zoned schools average 82% FRL vs 37% district-wide (45 pts higher); higher-poverty schools than district average — tighter screening recommended.
- Market conditions: Rents rising (+1.9%/yr); 361 active listings in the ZIP; 11 comparable units currently listed for rent nearby; rentals at typical pace (median 24d on market — plan ~3-4 weeks tenant-placement turnaround); solid renter incomes; 2,069 units permitted in Gaston County in 2024 (142 in 5+ unit buildings).
Forward outlook
- Local home prices are declining (-3.0%/yr); year-one equity from $2k of loan paydown is wiped out by about $7k of value loss. Plan a longer hold.
- Gaston County population projected at +12% by 2050 — modest demand growth; plan on rents tracking national, not racing it.
Negotiation context
- It's been on market 266 days — a 12% lower offer ($207k) is reasonable based on typical stale-listing flexibility.
- 2 sale attempts with the ask held roughly flat each time — persistent listings suggest the price (not the market) is what's stuck; bring a comps-based counter.
Risks & watch-outs
- Climate carrying-cost: moderate wind risk, 21% chance of damaging wind over 30y; extreme-heat days projected 7→17/yr by 2055 (HVAC capex compounding) — expect insurance premiums to compound above CPI over the hold.
Questions for the listing agent
- What do current leases actually rent for vs. the listed asking? Can we see a recent rent roll and the last 12 months of T-12 income?
- It's been on market 266 days. Have you received any prior offers? Is the seller open to a 22% concession, seller financing, or rate buy-down credit?
- Why hasn't it sold? Are there any deal-killer items the seller is aware of (foundation, flood, title, zoning, code violations)?
- Is there a deadline driving the sale (1031 exchange, divorce, estate, relocation)? That informs how much negotiation room exists.
- Schools are D-rated, which usually means shorter tenancies and higher turnover. Who's the typical renter profile here, and what's been the actual vacancy rate?
- Crime grade is F in this area — have there been break-ins, vandalism, or insurance claims at this property in the last 3 years? What carrier currently insures it and at what premium?
- The area grade is low — what's the realistic commute time and amenity access for the typical tenant pool here? Any planned neighborhood developments (good or bad) we should know about?
- What's the average days-on-market for RENTAL listings here right now (not sales)? A rising rental-DOM trend means longer vacancies and softer asking-rent achievability than the comps imply.
- What's the recent tenant-quality profile in this submarket — average credit score on applications, eviction rate, late-payment / NSF rate, and stable-employment percentage? A property-management company in the area should have these aggregated.
- How much new for-sale + rental construction is in the pipeline within 1–3 miles? Heavy new supply typically softens prices + rents 12–24 months out; constrained supply supports both.
Investment metrics
- 1% rule
- 0.78% ✗
- Cap rate
- 6.17%
- Cash-on-cash
- -0.43%
- DSCR
- 0.98
- GRM
- 10.7
CMA / ARV
- ARV (on-the-fly)
- $231,250
- Comps found
- 12
Show comp detail 12 sales within ~0.75 mi
| Address | Dist | Beds/Ba | Sqft | Sold | Price | $/sf | Match |
|---|---|---|---|---|---|---|---|
| 4107 Windwood Dr | 0.28mi | 3/1.0 | 1,296 (+4%) | 12mo | $225,000 | $174 | 71 |
| 4040 Angus Dr | 0.53mi | 3/1.0 | 1,250 (0%) | 5mo | $245,500 | $196 | 71 |
| 3923 Windwood Dr | 0.21mi | 3/1.5 | 1,343 (+7%) | 6mo | $249,000 | $185 | 70 |
| 4409 Little Mountain Rd | 0.42mi | 3/1.5 | 1,301 (+4%) | 3mo | $250,000 | $192 | 69 |
| 705 Windwood Dr | 0.07mi | 3/1.5 | 1,364 (+9%) | 20mo | $235,000 | $172 | 63 |
| 206 Oshea Ave | 0.56mi | 3/2.0 | 1,265 (+1%) | 14mo | $252,000 | $199 | 57 |
| 4724 Jamee Dr | 0.55mi | 3/1.5 | 1,288 (+3%) | 15mo | $220,000 | $171 | 55 |
| 3511 York Hwy | 0.57mi | 2/1.0 (-1) | 1,230 (-2%) | 20mo | $150,000 | $122 | 50 |
| 216 Queens Ct | 0.75mi | 3/2.0 | 1,311 (+5%) | 6mo | $250,000 | $191 | 48 |
| 4210 Grissom St | 0.69mi | 3/1.5 | 1,200 (-4%) | 14mo | $214,900 | $179 | 47 |
| 140 Nila Dawn Ave #2 | 0.72mi | 3/1.0 | 1,070 (-14%) | 1mo | $190,000 | $178 | 42 |
| 4133 Grissom St | 0.72mi | 3/1.0 | 1,070 (-14%) | 21mo | $212,500 | $199 | 24 |
Match score weights: distance 35% · size 25% · config 20% · recency 20%. Top-matched comps best support the ARV.
Projected returns pro-forma
-3.0% appreciation · 1.94% rent growth · sell at horizon
- IRR
- -18.1%
- Equity multiple
- 0.37×
- Total profit
- $-41,587
- Equity at exit
- $35,039
- IRR
- -12.4%
- Equity multiple
- 0.30×
- Total profit
- $-46,184
- Equity at exit
- $20,319
Cash invested: $65,800 (down + closing). Projections, not guarantees.
Landlord ↔ Tenant lean methodology
- Overall (STATE)
- 85 Strongly Landlord-Friendly
- State North Carolina
- 85 Strongly Landlord-Friendly · R+3
- County
- — inherits STATE
- City
- — inherits STATE
ZIP-level market 28056
- Rents YoY
- 1.9%
- Active inventory
- 361
- Price-to-rent
- 10.7×
Monthly cashflow live
- Estimated rent
- $1,827 high interval (Pro) →
- Mortgage (P&I)
- −$1,232
- Tax from tax record
- −$137 /mo · $1,643/yr
- Insurance
- −$98
- HOA
- −$0
- Vacancy / Maint / Mgmt
- −$384
- Net cashflow
- $-24
Break-even live
Sensitivity live
| Price | -10% $109 | -5% $43 | +0% $-24 | +5% $-90 | +10% $-157 |
|---|---|---|---|---|---|
| Rent | -10% $-168 | -5% $-96 | +0% $-24 | +5% $48 | +10% $121 |
| Rate | -1.0pp $95 | -0.5pp $36 | base $-24 | +0.5pp $-85 | +1.0pp $-147 |
UW: 25.0% down · 7.5% · 30yr · 1.5% tax · 5.0% vac · 8.0% maint · 8.0% mgmt
Financing live
Cash to close
- Down payment
- $58,750
- Closing costs
- $7,050
- Reserves months
- —
- Total cash needed
- —
Loan-product check · same deal, 3 products live
Conventional
25% down · 7.5% · 30yr
- Down + closing
- —
- Monthly P&I
- —
- Monthly cashflow
- —
- DSCR
- —
- Eligible?
- —
Personal DTI + credit; lowest rate.
DSCR
20% down · 8.5% · 30yr
- Down + closing
- —
- Monthly P&I
- —
- Monthly cashflow
- —
- DSCR
- —
- Eligible?
- —
No personal income docs; deal must DSCR.
Hard money
10% down · 12.0% · 12mo
- Down + closing
- —
- Monthly P&I
- —
- Monthly cashflow
- —
- DSCR
- —
- Eligible?
- —
Short-term bridge; refi at stabilization.
Rent comps 11 comps
| Address | Beds | Baths | Sqft | Rent | $/sqft | DOM | Units | Dist |
|---|---|---|---|---|---|---|---|---|
| 4026 Angus Dr Gastonia, NC | 3.0 | 1.5 | 1310 | $1,623 | $1.24 | 23d | 1 | 0.46mi |
| 3342 York Hwy Gastonia, NC | 2.0 | 1.0 | 1000 | $1,349 | $1.35 | 23d | 1 | 0.76mi |
| 732 Inwood Hill Dr Gastonia, NC | 3.0 | 2.5 | 1330 | $2,195 | $1.65 | 22d | 1 | 1.10mi |
| 538 Queens Rd Gastonia, NC | 3.0 | 2.0 | 1038 | $1,600 | $1.54 | 25d | 1 | 1.11mi |
| 2735 Winn Mill Dr Gastonia, NC | 3.0 | 2.5 | 1580 | $1,895 | $1.20 | 25d | 1 | 1.40mi |
| 3377 Hunting Wood Ct Gastonia, NC | 3.0 | 2.0 | 1211 | $1,780 | $1.47 | 16d | 1 | 1.41mi |
| 2642 Forbes Rd Gastonia, NC | 3.0 | 2.0 | 1575 | $1,850 | $1.17 | 12d | 1 | 1.42mi |
| 2529 Ruby Dixon Crossing Dr Gastonia, NC | 3.0 | 2.5 | 1661 | $2,000 | $1.20 | 23d | 1 | 1.43mi |
| 2529 Ruby Dixon Crossing Dr Unit 2529 Gastonia, NC | 3.0 | 2.5 | 1661 | $2,000 | $1.20 | 25d | 1 | 1.43mi |
| 2443 Myers St Gastonia, NC | 3.0 | 1.0 | 1100 | $1,187 | $1.08 | 14d | 1 | 1.48mi |
| 325 Robinson Rd Gastonia, NC | 2.0 | 1.0 | 900 | $1,195 | $1.33 | 25d | 1 | 1.48mi |
Listing history 17 events
-
2026-06-21days on market $235,000 Active 266 DOM
-
2026-06-18days on market $235,000 Active 263 DOM
-
2026-06-17days on market $235,000 Active 262 DOM
-
2026-06-16days on market $235,000 Active 261 DOM
-
2026-06-15days on market $235,000 Active 260 DOM
-
2026-06-13days on market $235,000 Active 258 DOM
-
2026-06-09days on market $235,000 Active 254 DOM
-
2026-06-08days on market $235,000 Active 253 DOM
-
2026-06-07days on market $235,000 Active 252 DOM
-
2026-06-04days on market $235,000 Active 249 DOM
-
2026-06-03days on market $235,000 Active 248 DOM
-
2026-06-02days on market $235,000 Active 247 DOM
-
2026-06-01days on market $235,000 Active 246 DOM
-
2026-05-31days on market $235,000 Active 245 DOM
-
2026-02-12price $235,000
-
2025-12-18status Active
-
2025-09-26$240,000 Active
ⓘ Source: listings_history table (triggers on properties + properties_extension) + one-shot
backfill from property_details.listing_events for pre-trigger history.
Tax reassessment forecast NC · Resets to sale price
- Current annual tax
- $1,643 · $137/mo
- Projected year-2 tax
- $1,927 · $161/mo
- Expected delta
- +$284/yr (+$24/mo · 17.3%)
ⓘ Screening estimate from a state-policy table — verify with the county assessor before closing.
Climate risk First Street
- Flood 1/10 Low FEMA zone X (unshaded) · 0% chance over 30 yrs
- Wildfire 4/10 Moderate
- Heat 6/10 Major 7 d/yr ≥104°F today · 17 d/yr by 30 yrs out
- Wind 5/10 Major 21% chance of damaging wind over 30 yrs
- Air quality 3/10 Moderate 3 unhealthy d/yr today · 3 by 30 yrs out
Nearby sold comps map
Loading sold comps map…
Walkable amenities ~0.75 mi
Loading nearby amenities…
Taxation est. · year 1
- Rental income
- $21,927
- − Mortgage interest
- −$13,164
- − Property taxes
- −$1,643
- − Insurance
- −$1,175
- − Repairs & maintenance
- −$1,754
- − Management
- −$1,754
- − Depreciation
- −$6,836
- Taxable loss
- −$4,400
- Est. tax savings @ 24.0%
- +$1,056
- After-tax cash flow
- $771/yr
For passive investors: Depreciation is non-cash, so a rental often shows a tax loss while cash-flowing — sheltering income. Rental losses are passive: they offset passive income freely, and up to $25,000/yr can offset ordinary (W-2) income if you actively participate and your MAGI is under $100k (phasing out to $0 by $150k); unused losses carry forward. On sale, claimed depreciation is recaptured at up to 25%, and gains may owe capital-gains tax (a 1031 exchange can defer both). Figures are a year-1 estimate at your 24.0% rate — not tax advice; consult a CPA.
Schools (NCES district)
- District
- Gaston County Schools
- NCES district ID
- 3701620
- Math proficiency
- 44% ▲ 4.00%
- Reading proficiency
- 42% ▲ 1.00%
- Median HH income
- $43,644
- Composite
- 36.39/100
- National rank
- #4680
- State rank
- #93 of 178 in NC
Livability — Gastonia
- Score
- 59/100
- State rank
- #528
- US rank
- #19444
Category grades
Schools grade is shown separately in the Schools card above.
Census & demographics
- County
- Gaston County · 201,497 people
- City population
- 114,179
- Metro
- Charlotte-Concord-Gastonia, NC-SC
- Population (ZIP)
- 36,200
- Household income
- $90,427
- Rent vs Own
- Severe rent burden
- 623.0
Population outlook (Gaston County) Hauer SSP2
- Today (2025)
- 230,027 people
- By 2030
- 237,300 · +3.2%
- By 2040
- 249,659 · +8.5%
- By 2050
- 257,806 · +12.1%
- By 2075
- 272,163 · +18.3%
- By 2100
- 268,652 · +16.8%
Race, ethnicity, and origin ACS 2023
- Neighborhood character
- Predominantly White (69%)
- Race & ethnicity
- White 69% Black 14% Hispanic / Latino 10% Two or more races 5% Asian 3%
- Hispanic origin (detail)
- Mexican 4% Puerto Rican 1%
- Common ancestry
- Serbian 4% Slovak 2% Italian 1%
- Foreign-born
- 7% · Canada, Jamaica
- Languages at home
- 89% English-only · Spanish 9% Other Asian/Pacific 1% Other Indo-European 1%
Political lean MEDSL · Gaston
- 2024 margin
- Strong R (+25.0) · D 37.0% · R 62.1%
- 2008→2024 swing
- 0.0pp no change · 2008: -25.0pp · 2024: -25.0pp
- All cycles
- 2024: R+25.0 2020: R+27.8 2016: R+32.1 2012: R+25.6 2008: R+25.0
Not yet ingested
- Civics
- —
Market trends
- HPI YoY
- ▼ -244.54%
- Current HPI
- 231.6479
- Rent YoY
- ▲ 1.94%
- Metro
- Charlotte-Concord-Gastonia, NC-SC
- State GDP YoY
- ▲ 3.28%
- F500 in state
- 26
Industry mix (Fortune 500 HQ in NC)
| Industry | F500 HQs | Revenue |
|---|---|---|
| Financial Services | 2 | $213B |
|
||
| Retail | 2 | $95B |
|
||
| Industrial Conglomerate | 1 | $38B |
|
||
| Metals / Steel | 1 | $35B |
|
||
| Utilities | 1 | $30B |
|
||
| Industrial Machinery | 1 | $19B |
|
||
Price history
-2.1% since first listed3 events — show timeline
- 2026-02-12 Price Changed $235,000 CANOPYMLS as Distributed by MLS Grid
- 2025-12-18 Relisted — CANOPYMLS as Distributed by MLS Grid
- 2025-09-26 Listed $240,000 CANOPYMLS as Distributed by MLS Grid
Property tax history
+4.4%/yrLatest (2025): $1,643 · +0.0% YoY. Source: county tax records.
Cash-flow waterfall
monthlySold comps — $/sqft
last 12 mo · ≤1 miLoading sold comps…