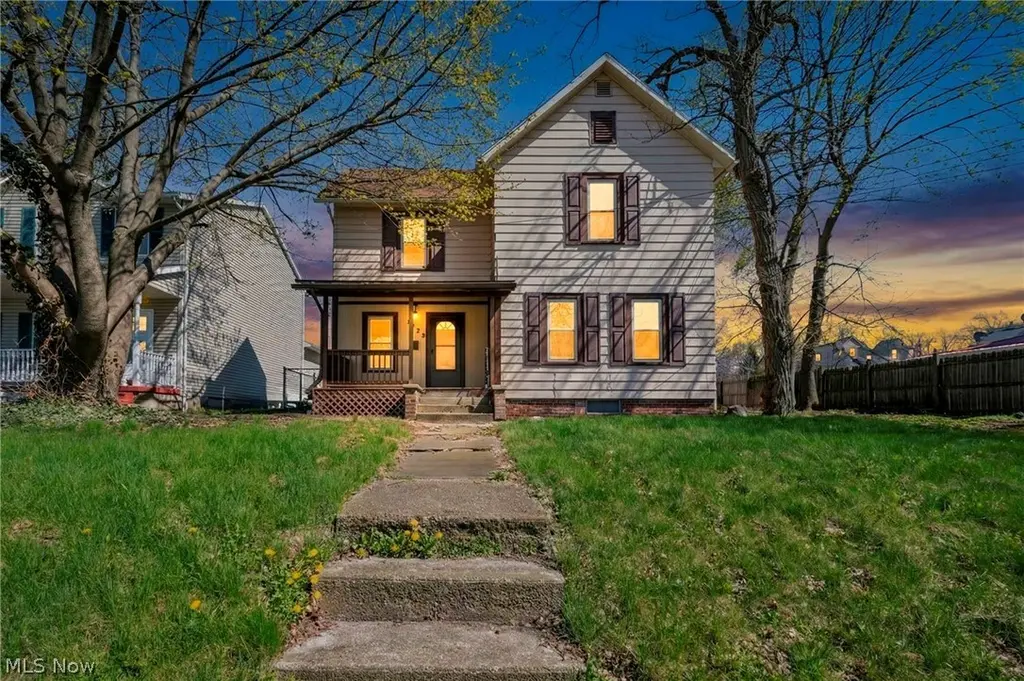
1729 Newberry St · Cuyahoga Falls, OH
Flood risk 1/10 · Minimal
- FEMA flood zone
- X (unshaded)
- Chance of flooding over 30 yrs
- 0.0%
- Est. flood insurance / yr
- $473 – $860
Fire risk 1/10 · Minimal
- Est. fire insurance / yr
- $713 – $1,323
Heat risk 3/10 · Minor
- Hot days now (above 97°F)
- 7 days/yr
- Hot days in 30 yrs
- 17 days/yr
Wind risk 1/10 · Minimal
- Chance of severe wind over 30 yrs
- —
Air-quality risk 3/10 · Minor
- Unhealthy air days now
- 2 days/yr
- Unhealthy air days in 30 yrs
- 4 days/yr
Risk factors via First Street. Map © Google.
Why this score? — see what drove the C grade
The composite is a weighted blend of 9 inputs, each scored 0–100. Each bar is that input's sub-score; the figure is the points it added to the 100-point composite (weight × sub-score).
- Cash flow +17.6/30.0
- ARV discount +12.8/15.0
- DSCR +5.5/10.0
- 1% rule +5.0/10.0
- Schools +4.5/10.0
- Rent growth +4.2/5.0
- Livability +4.2/5.0
- Condition / age +2.5/5.0
- Appreciation +0.0/10.0
$189,900
🖨 Deal sheet 📄 Offer letter ✓ Due diligence
Listing remarks
Welcome Home! This inviting 4 Bedroom, 2 Bathroom property located near Howe Rd. and in the heart of Cuyahoga Falls, can be yours! Nestled in a quaint and welcoming neighborhood, this home offers the perfect opportunity for first-time home buyers looking for comfort, and convenience. Inside, you will find a modern and functional layout with spacious living areas, generous sized rooms, and two full bathrooms for your everyday comfort. There is a first floor bedroom and bathroom for your convinience. The home provides plenty of room to grow , whether you are starting a family, working from home, or simply looking for extra space! This property is close to local parks, shopping, dining, and ma
Key facts
- 0.25 acre lot
- Parking
- Built 1913
Property features AI
Exterior
- Parking: Additional parking; Driveway
- Utilities: Public water; Public sewer
- Home design: 2-story home; Above-grade finished living area approximately 1,464; Block foundation
- Construction: Aluminum siding; Asphalt/fiberglass roof
- Exterior features: Front porch; Patio; Back yard
Interior
- Kitchen: Range; Refrigerator
- Bedrooms: 1 main-level bedroom
- Bathrooms: 2 full bathrooms; 1 full bathroom on the main level
- Heating & cooling: Forced air heating; Gas heating
- Interior features: 7 total rooms; Unfinished concrete basement
- Laundry & utility: Laundry located on lower level
Neighborhood map
What this means for you Summary
Snapshot
- This is a 4-bed/2.0-bath single-family listed at $190k.
Deal economics
- At list price, monthly cash flow is $151 ($2k/yr) — positive.
- The deal already cash-flows at list — no discount required.
- To meet the 1% rule (rent ≥ 1% of price), the offer needs to be $189k (0.4% below list).
- Recommended offer: $189k (0.4% below list) — sets the bar for 1% rule.
- Cap rate 7.2% vs local median 4.6% in Cuyahoga Falls — top-decile yield for the area; either an underpriced asset or a hidden risk that comps aren't pricing in. Stress-test before assuming the spread holds.
Location & tenants
- Location reads 83/100 on livability (#60 in OH, #870 nationally) — a professional / high-income tenant draw. Strengths: cost of living A+, housing A+, health & safety A+; Watch: commute F.
- Cuyahoga Falls City (suburban): math 47% / reading 58% proficiency, ranked #408 of 656 in OH (top 62%) — acceptable for families but not a draw, mixed tenant base, ~2y average lease.
- Market conditions: Rents rising fast (+7.0%/yr); 90 active listings in the ZIP; 9 comparable units currently listed for rent nearby; rentals at typical pace (median 23d on market — plan ~3-4 weeks tenant-placement turnaround); 44% of comp listings sitting > 30 days — soft ceiling on asking rent; 1,114 units permitted in Summit County in 2024 (397 in 5+ unit buildings).
- This rent runs 36% of the median local income ($63k/yr) — at the standard rent-burdened threshold; future hikes will face affordability resistance.
Forward outlook
- Local home prices are declining (-3.0%/yr); year-one equity from $1k of loan paydown is wiped out by about $6k of value loss. Plan a longer hold.
- Summit County population projected to shrink 6% by 2050 — rents likely to lag national; underwrite the cash flow, not the appreciation.
Negotiation context
- Only 9 days on market — expect competitive offers; lowballing is unlikely to land.
Risks & watch-outs
- Watch-outs: built in 1913 — expect roof / HVAC / electrical / plumbing capex.
Questions for the listing agent
- Built in 1913 — when were the roof, HVAC, electrical panel, plumbing, and water heater last replaced?
- Is there a deadline driving the sale (1031 exchange, divorce, estate, relocation)? That informs how much negotiation room exists.
- Schools are A-rated — typically a magnet for longer-tenancy family renters. What's the average tenant stay here, and is there a school-zone premium baked into asking?
- What's the average days-on-market for RENTAL listings here right now (not sales)? A rising rental-DOM trend means longer vacancies and softer asking-rent achievability than the comps imply.
- What's the recent tenant-quality profile in this submarket — average credit score on applications, eviction rate, late-payment / NSF rate, and stable-employment percentage? A property-management company in the area should have these aggregated.
- How much new for-sale + rental construction is in the pipeline within 1–3 miles? Heavy new supply typically softens prices + rents 12–24 months out; constrained supply supports both.
Investment metrics
- 1% rule
- 1.00% ✗
- Cap rate
- 7.25%
- Cash-on-cash
- 3.41%
- DSCR
- 1.15
- GRM
- 8.4
CMA / ARV
- ARV (on-the-fly)
- $215,208
- Comps found
- 12
Show comp detail 12 sales within ~0.75 mi
| Address | Dist | Beds/Ba | Sqft | Sold | Price | $/sf | Match |
|---|---|---|---|---|---|---|---|
| 1729 Newberry St | 0.00mi | 4/2.0 | 1,464 (0%) | 1mo | $179,000 | $122 | 99 |
| 416 Prospect Ave | 0.11mi | 3/2.0 (-1) | 1,320 (-10%) | 3mo | $205,000 | $155 | 71 |
| 562 Tallmadge Rd | 0.23mi | 3/1.5 (-1) | 1,560 (+7%) | 3mo | $229,900 | $147 | 69 |
| 880 Markham Ave | 0.53mi | 3/1.5 (-1) | 1,550 (+6%) | 1mo | $295,000 | $190 | 58 |
| 1523 8th St | 0.71mi | 4/1.0 | 1,498 (+2%) | 8mo | $215,000 | $144 | 53 |
| 619 Tallmadge Rd | 0.32mi | 3/1.0 (-1) | 1,284 (-12%) | 4mo | $224,900 | $175 | 52 |
| 1109 Cooper Dr | 0.66mi | 3/2.0 (-1) | 1,547 (+6%) | 6mo | $225,000 | $145 | 49 |
| 839 Sackett Ave | 0.75mi | 3/1.0 (-1) | 1,440 (-2%) | 7mo | $199,900 | $139 | 48 |
| 1612 Hanover St | 0.73mi | 4/2.0 | 1,596 (+9%) | 5mo | $215,000 | $135 | 47 |
| 1011 Cooper Dr | 0.63mi | 3/1.0 (-1) | 1,330 (-9%) | 2mo | $187,100 | $141 | 45 |
| 1512 Bancroft St | 0.69mi | 3/2.5 (-1) | 1,356 (-7%) | 8mo | $270,125 | $199 | 42 |
| 1471 Bancroft St | 0.74mi | 3/2.0 (-1) | 1,322 (-10%) | 4mo | $224,000 | $169 | 40 |
Match score weights: distance 35% · size 25% · config 20% · recency 20%. Top-matched comps best support the ARV.
Projected returns pro-forma
-3.0% appreciation · 6.95% rent growth · sell at horizon
- IRR
- -6.5%
- Equity multiple
- 0.75×
- Total profit
- $-13,294
- Equity at exit
- $28,315
- IRR
- 7.5%
- Equity multiple
- 1.67×
- Total profit
- $35,793
- Equity at exit
- $16,419
Cash invested: $53,172 (down + closing). Projections, not guarantees.
Landlord ↔ Tenant lean methodology
- Overall (STATE)
- 73 Landlord-Friendly
- State Ohio
- 73 Landlord-Friendly · R+6
- County
- — inherits STATE
- City
- — inherits STATE
ZIP-level market 44221
- Rents YoY
- 7.0%
- Active inventory
- 90
- Price-to-rent
- 8.4×
Monthly cashflow live
- Estimated rent
- $1,892 high interval (Pro) →
- Mortgage (P&I)
- −$996
- Tax from tax record
- −$268 /mo · $3,221/yr
- Insurance
- −$79
- HOA
- −$0
- Vacancy / Maint / Mgmt
- −$397
- Net cashflow
- $151
Break-even live
UW: 25.0% down · 7.5% · 30yr · 1.5% tax · 5.0% vac · 8.0% maint · 8.0% mgmt
Financing live
Cash to close
- Down payment
- $47,475
- Closing costs
- $5,697
- Reserves months
- —
- Total cash needed
- —
Loan-product check · same deal, 3 products live
Conventional
25% down · 7.5% · 30yr
- Down + closing
- —
- Monthly P&I
- —
- Monthly cashflow
- —
- DSCR
- —
- Eligible?
- —
Personal DTI + credit; lowest rate.
DSCR
20% down · 8.5% · 30yr
- Down + closing
- —
- Monthly P&I
- —
- Monthly cashflow
- —
- DSCR
- —
- Eligible?
- —
No personal income docs; deal must DSCR.
Hard money
10% down · 12.0% · 12mo
- Down + closing
- —
- Monthly P&I
- —
- Monthly cashflow
- —
- DSCR
- —
- Eligible?
- —
Short-term bridge; refi at stabilization.
Rent comps 9 comps
| Address | Beds | Baths | Sqft | Rent | $/sqft | DOM | Units | Dist |
|---|---|---|---|---|---|---|---|---|
| 467 Lynn Dr Cuyahoga Falls, OH | 3.0 | 1.0 | 1414 | $1,600 | $1.13 | 13d | 1 | 0.26mi |
| 1975 Tudor St Cuyahoga Falls, OH | 3.0 | 1.0 | 1120 | $1,475 | $1.32 | 43d | 1 | 0.55mi |
| 1791 Windsor St Cuyahoga Falls, OH | 3.0 | 1.0 | 1120 | $1,929 | $1.72 | 14d | 1 | 0.57mi |
| 1823 7th St Cuyahoga Falls, OH | 3.0 | 1.5 | 1248 | $2,850 | $2.28 | 43d | 1 | 0.63mi |
| 1276 Bailey Rd Cuyahoga Falls, OH | 3.0 | 2.0 | 1188 | $1,800 | $1.52 | 43d | 1 | 0.93mi |
| 1059 Jean Ave Akron, OH | 3.0 | 1.0 | 1012 | $1,300 | $1.28 | 43d | 1 | 1.13mi |
| 1832 15th St Cuyahoga Falls, OH | 3.0 | 1.0 | 1000 | $1,495 | $1.50 | 23d | 1 | 1.14mi |
| 1180 Murray Ave Akron, OH | 3.0 | 2.0 | 1340 | $1,175 | $0.88 | 21d | 1 | 1.41mi |
| 1088 Lexington Ave Akron, OH | 3.0 | 1.0 | 1008 | $1,600 | $1.59 | 13d | 1 | 1.43mi |
Listing history 2 events
-
2026-04-19status Pending
-
2026-04-07$189,900 Active
ⓘ Source: listings_history table (triggers on properties + properties_extension) + one-shot
backfill from property_details.listing_events for pre-trigger history.
Tax reassessment forecast OH · Partial reset (capped growth)
- Current annual tax
- $3,221 · $268/mo
- Projected year-2 tax
- $3,221 · $268/mo
- Expected delta
- $0/yr ($0/mo · 0.0%)
ⓘ Screening estimate from a state-policy table — verify with the county assessor before closing.
Climate risk First Street
- Flood 1/10 Low FEMA zone X (unshaded) · 0% chance over 30 yrs
- Wildfire 1/10 Low
- Heat 3/10 Moderate 7 d/yr ≥97°F today · 17 d/yr by 30 yrs out
- Wind 1/10 Low
- Air quality 3/10 Moderate 2 unhealthy d/yr today · 4 by 30 yrs out
Nearby sold comps map
Loading sold comps map…
Walkable amenities ~0.75 mi
Loading nearby amenities…
Taxation est. · year 1
- Rental income
- $22,699
- − Mortgage interest
- −$10,637
- − Property taxes
- −$3,221
- − Insurance
- −$950
- − Repairs & maintenance
- −$1,816
- − Management
- −$1,816
- − Depreciation
- −$5,524
- Taxable loss
- −$1,265
- Est. tax savings @ 24.0%
- +$304
- After-tax cash flow
- $2,115/yr
For passive investors: Depreciation is non-cash, so a rental often shows a tax loss while cash-flowing — sheltering income. Rental losses are passive: they offset passive income freely, and up to $25,000/yr can offset ordinary (W-2) income if you actively participate and your MAGI is under $100k (phasing out to $0 by $150k); unused losses carry forward. On sale, claimed depreciation is recaptured at up to 25%, and gains may owe capital-gains tax (a 1031 exchange can defer both). Figures are a year-1 estimate at your 24.0% rate — not tax advice; consult a CPA.
Schools (NCES district)
- District
- Cuyahoga Falls City
- NCES district ID
- 3904383
- Math proficiency
- 47% ▼ -18.00%
- Reading proficiency
- 58% ▼ -7.00%
- Median HH income
- $49,587
- Composite
- 44.78/100
- National rank
- #2746
- State rank
- #408 of 656 in OH
Livability — Cuyahoga Falls
- Score
- 83/100
- State rank
- #60
- US rank
- #870
Category grades
Schools grade is shown separately in the Schools card above.
Census & demographics
- Census place
- Cuyahoga Falls, OH
- County
- Summit County · 440,783 people
- City population
- 47,005
- Metro
- Akron, OH
- Population (ZIP)
- 28,546
- Household income
- $63,342
- Rent vs Own
- Severe rent burden
- 1080.0
Population outlook (Summit County) Hauer SSP2
- Today (2025)
- 546,583 people
- By 2030
- 544,028 · -0.5%
- By 2040
- 531,363 · -2.8%
- By 2050
- 514,923 · -5.8%
- By 2075
- 481,765 · -11.9%
- By 2100
- 432,265 · -20.9%
Race, ethnicity, and origin ACS 2023
- Neighborhood character
- Predominantly White (81%)
- Race & ethnicity
- White 81% Asian 7% Black 5% Two or more races 5% Hispanic / Latino 2%
- Common ancestry
- Romanian 4% Lithuanian 2% Scotch-Irish 2%
- Foreign-born
- 7% · India, China, Canada
- Languages at home
- 90% English-only · Other Indo-European 6% Other Asian/Pacific 1% German/W. Germanic 1%
Political lean MEDSL · Summit
- 2024 margin
- Lean D (+7.0) · D 53.0% · R 46.0%
- 2008→2024 swing
- -9.6pp toward R · 2008: 16.6pp · 2024: 7.0pp
- All cycles
- 2024: D+7.0 2020: D+9.6 2016: D+8.2 2012: D+14.8 2008: D+16.6
Not yet ingested
- Civics
- —
Market trends
- HPI YoY
- ▼ -222.74%
- Current HPI
- 213.5428
- Rent YoY
- ▲ 6.95%
- Metro
- Akron, OH
- State GDP YoY
- ▲ 1.98%
- F500 in state
- 48
Industry mix (Fortune 500 HQ in OH)
| Industry | F500 HQs | Revenue |
|---|---|---|
| Insurance | 3 | $145B |
|
||
| Industrial Machinery | 3 | $49B |
|
||
| Financial Services | 3 | $24B |
|
||
| Consumer Goods | 2 | $93B |
|
||
| Aerospace / Defense | 2 | $47B |
|
||
| Utilities | 2 | $33B |
|
||
Price history
2 events — show timeline
- 2026-04-19 Pending — MLSNOW
- 2026-04-07 Listed $189,900 MLSNOW
Property tax history
+5.0%/yrLatest (2025): $3,221 · -1.8% YoY. Source: county tax records.
Cash-flow waterfall
monthlySold comps — $/sqft
last 12 mo · ≤1 miLoading sold comps…