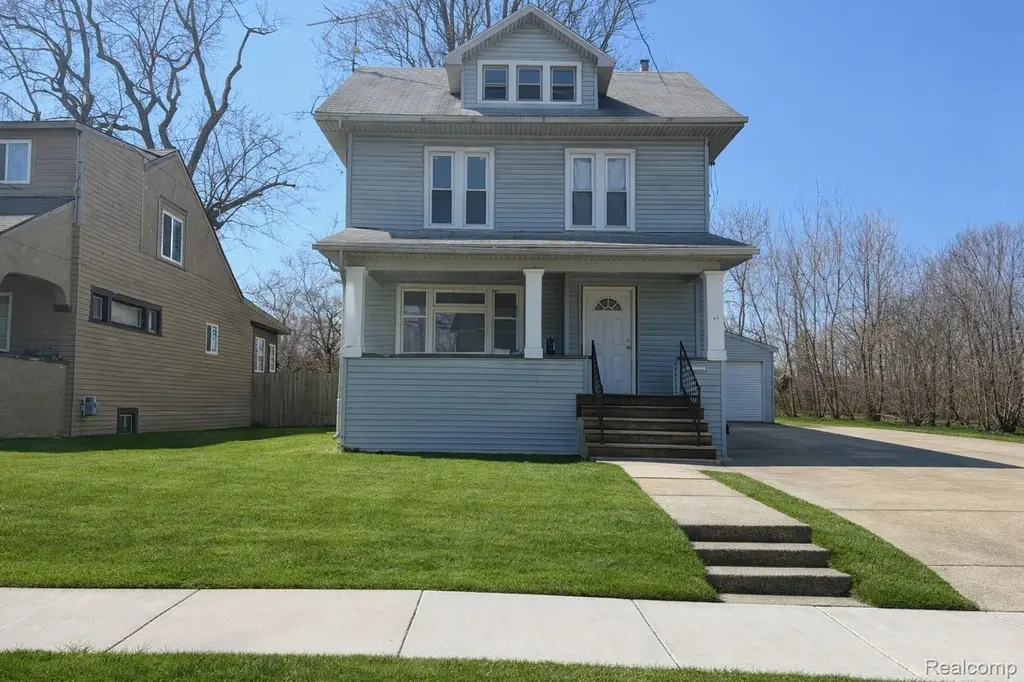
51 Henderson St · Pontiac, MI
Flood risk 1/10 · Minimal
- FEMA flood zone
- X (unshaded)
- Chance of flooding over 30 yrs
- 0.0%
- Est. flood insurance / yr
- $473 – $860
Fire risk 1/10 · Minimal
- Est. fire insurance / yr
- $784 – $1,456
Heat risk 2/10 · Minimal
- Hot days now (above 96°F)
- 7 days/yr
- Hot days in 30 yrs
- 15 days/yr
Wind risk 2/10 · Minimal
- Chance of severe wind over 30 yrs
- —
Air-quality risk 3/10 · Minor
- Unhealthy air days now
- 2 days/yr
- Unhealthy air days in 30 yrs
- 4 days/yr
Risk factors via First Street. Map © Google.
Why this score? — see what drove the B grade
The composite is a weighted blend of 9 inputs, each scored 0–100. Each bar is that input's sub-score; the figure is the points it added to the 100-point composite (weight × sub-score).
- Cash flow +30.0/30.0
- ARV discount +13.2/15.0
- DSCR +10.0/10.0
- 1% rule +7.8/10.0
- Livability +3.2/5.0
- Rent growth +2.5/5.0
- Condition / age +2.5/5.0
- Schools +1.0/10.0
- Appreciation +0.0/10.0
$120,000
🖨 Deal sheet 📄 Offer letter ✓ Due diligence
Listing remarks MLS
* Back on market due to buyer financing * Welcome to this spacious, colonial home with the lot next door at 55 Henderson being included in the sale. This home is waiting for a handy first time homebuyer or an experienced investor to put the finishing touches. Along with being located close to major freeways and downtown, this home is just what you need. Schedule your showing today.
Key facts
- 5,227 sq ft lot
- 2 garage spots
- Built 1910
Neighborhood map
What this means for you Summary
Snapshot
- This is a 3-bed/1.0-bath single-family listed at $120k.
Deal economics
- At list price, monthly cash flow is $455 ($5k/yr) — positive.
- The deal already cash-flows at list — no discount required.
- Meets the 1% rule at list price ($2k rent vs $120k).
- Recommended offer: $113k (6.0% below list) — sets the bar for market timing.
- Cap rate 10.8% vs local median 6.7% in Pontiac — top-decile yield for the area; either an underpriced asset or a hidden risk that comps aren't pricing in. Stress-test before assuming the spread holds.
Location & tenants
- Location reads 64/100 on livability (#499 in MI) — a middle-class / working-renter tenant base. Strengths: commute A+, cost of living A+, housing A+; Watch: health & safety D, schools F, crime F.
- Pontiac City School District (urban): math 8% / reading 17% proficiency, ranked #514 of 540 in MI (top 95%) — low school quality limits family demand, transient renter base, plan for 1-2y turnover; 81% free/reduced lunch — lower-income household profile, screen leases tightly.
- Market conditions: 100 active listings in the ZIP; 17 comparable units currently listed for rent nearby; rentals at typical pace (median 24d on market — plan ~3-4 weeks tenant-placement turnaround); 2,614 units permitted in Oakland County in 2024 (721 in 5+ unit buildings).
- This rent runs 36% of the median local income ($51k/yr) — at the standard rent-burdened threshold; future hikes will face affordability resistance.
Forward outlook
- Local home prices are declining (-3.0%/yr); year-one equity from $830 of loan paydown is wiped out by about $4k of value loss. Plan a longer hold.
- Oakland County population projected at +10% by 2050 — modest demand growth; plan on rents tracking national, not racing it.
- At projected returns (-3.0% appreciation + 3.0% rent growth), your $34k cash investment doubles in ~8 years — after that, you're playing with house money.
Negotiation context
- It's been on market 63 days — a 6% lower offer ($113k) is reasonable based on typical stale-listing flexibility.
- 6 sale attempts since 9y ago with the ask held roughly flat each time — persistent listings suggest the price (not the market) is what's stuck; bring a comps-based counter.
- Current owner paid $38k; list at $120k implies a 216% gain — meaningful room to come down on a strong offer.
Risks & watch-outs
- Watch-outs: built in 1910 — expect roof / HVAC / electrical / plumbing capex.
Questions for the listing agent
- It's been on market 63 days. Have you received any prior offers? Is the seller open to a 6% concession, seller financing, or rate buy-down credit?
- Built in 1910 — when were the roof, HVAC, electrical panel, plumbing, and water heater last replaced?
- Why hasn't it sold? Are there any deal-killer items the seller is aware of (foundation, flood, title, zoning, code violations)?
- Is there a deadline driving the sale (1031 exchange, divorce, estate, relocation)? That informs how much negotiation room exists.
- Schools are F-rated, which usually means shorter tenancies and higher turnover. Who's the typical renter profile here, and what's been the actual vacancy rate?
- Crime grade is F in this area — have there been break-ins, vandalism, or insurance claims at this property in the last 3 years? What carrier currently insures it and at what premium?
- What's the average days-on-market for RENTAL listings here right now (not sales)? A rising rental-DOM trend means longer vacancies and softer asking-rent achievability than the comps imply.
- What's the recent tenant-quality profile in this submarket — average credit score on applications, eviction rate, late-payment / NSF rate, and stable-employment percentage? A property-management company in the area should have these aggregated.
- How much new for-sale + rental construction is in the pipeline within 1–3 miles? Heavy new supply typically softens prices + rents 12–24 months out; constrained supply supports both.
Investment metrics
- 1% rule
- 1.28% ✓
- Cap rate
- 10.85%
- Cash-on-cash
- 16.27%
- DSCR
- 1.72
- GRM
- 6.5
CMA / ARV
- ARV (median comp)
- $137,312
- List price
- $120,000
- Delta
- -12.61%
- Verdict
- UNDERPRICED
- Comps
- 20 within 1.0 mi
Show comp detail 12 sales within ~0.75 mi
| Address | Dist | Beds/Ba | Sqft | Sold | Price | $/sf | Match |
|---|---|---|---|---|---|---|---|
| 143 Thorpe St | 0.28mi | 3/1.0 | 1,247 (-5%) | 2mo | $174,900 | $140 | 77 |
| 75 Green St | 0.27mi | 3/1.0 | 1,218 (-7%) | 2mo | $113,000 | $93 | 74 |
| 105 Augusta Ave | 0.26mi | 3/1.5 | 1,231 (-6%) | 3mo | $114,000 | $93 | 73 |
| 27 Crawford St | 0.50mi | 3/1.0 | 1,302 (-0%) | 4mo | $94,000 | $72 | 73 |
| 69 Lincoln St | 0.17mi | 3/2.0 | 1,211 (-8%) | 7mo | $175,000 | $145 | 70 |
| 63 Mark Ave | 0.31mi | 3/1.0 | 1,444 (+10%) | 1mo | $61,000 | $42 | 68 |
| 176 Chippewa Rd | 0.74mi | 3/1.0 | 1,288 (-2%) | 1mo | $199,900 | $155 | 62 |
| 167 Mark Ave | 0.36mi | 3/2.0 | 1,415 (+8%) | 4mo | $162,000 | $114 | 62 |
| 140 W Howard St | 0.74mi | 3/1.5 | 1,288 (-2%) | 5mo | $105,000 | $82 | 57 |
| 175 S Johnson St | 0.47mi | 4/3.0 (+1) | 1,313 (+0%) | 13mo | $155,000 | $118 | 54 |
| 24 Utica Rd | 0.67mi | 3/1.0 | 1,370 (+5%) | 10mo | $90,500 | $66 | 53 |
| 160 Chippewa Rd | 0.72mi | 3/2.5 | 1,500 (+15%) | 0mo | $250,000 | $167 | 36 |
Match score weights: distance 35% · size 25% · config 20% · recency 20%. Top-matched comps best support the ARV.
Projected returns pro-forma
-3.0% appreciation · 3.0% rent growth · sell at horizon
- IRR
- 7.3%
- Equity multiple
- 1.28×
- Total profit
- $9,540
- Equity at exit
- $17,892
- IRR
- 16.6%
- Equity multiple
- 2.36×
- Total profit
- $45,567
- Equity at exit
- $10,375
Cash invested: $33,600 (down + closing). Projections, not guarantees.
Landlord ↔ Tenant lean methodology
- Overall (STATE)
- 62 Landlord-Friendly
- State Michigan
- 62 Landlord-Friendly · EVEN
- County
- — inherits STATE
- City
- — inherits STATE
ZIP-level market 48341
- Active inventory
- 100
- Price-to-rent
- 6.5×
Monthly cashflow live
- Estimated rent
- $1,532 high interval (Pro) →
- Mortgage (P&I)
- −$629
- Tax from tax record
- −$76 /mo · $907/yr
- Insurance
- −$50
- HOA
- −$0
- Vacancy / Maint / Mgmt
- −$322
- Net cashflow
- $455
Break-even live
UW: 25.0% down · 7.5% · 30yr · 1.5% tax · 5.0% vac · 8.0% maint · 8.0% mgmt
Financing live
Cash to close
- Down payment
- $30,000
- Closing costs
- $3,600
- Reserves months
- —
- Total cash needed
- —
Loan-product check · same deal, 3 products live
Conventional
25% down · 7.5% · 30yr
- Down + closing
- —
- Monthly P&I
- —
- Monthly cashflow
- —
- DSCR
- —
- Eligible?
- —
Personal DTI + credit; lowest rate.
DSCR
20% down · 8.5% · 30yr
- Down + closing
- —
- Monthly P&I
- —
- Monthly cashflow
- —
- DSCR
- —
- Eligible?
- —
No personal income docs; deal must DSCR.
Hard money
10% down · 12.0% · 12mo
- Down + closing
- —
- Monthly P&I
- —
- Monthly cashflow
- —
- DSCR
- —
- Eligible?
- —
Short-term bridge; refi at stabilization.
Rent comps 17 comps
| Address | Beds | Baths | Sqft | Rent | $/sqft | DOM | Units | Dist |
|---|---|---|---|---|---|---|---|---|
| 23 Henry Clay Ave Unit 1 Pontiac, MI | 3.0 | 1.0 | 1200 | $1,450 | $1.21 | 17d | 1 | 0.32mi |
| 38 Spokane Dr Pontiac, MI | 2.0 | 1.0 | 1000 | $1,000 | $1.00 | 43d | 1 | 0.53mi |
| 60 Waldo St Pontiac, MI | 3.0 | 1.0 | 1100 | $1,500 | $1.36 | 4d | 1 | 0.55mi |
| 74 E Iroquois Rd Pontiac, MI | 3.0 | 1.0 | 1661 | $1,695 | $1.02 | 24d | 1 | 0.59mi |
| 99 Chippewa Rd Pontiac, MI | 4.0 | 1.0 | 1315 | $1,750 | $1.33 | 24d | 1 | 0.66mi |
| 223 Tucker St Pontiac, MI | 2.0 | 2.5 | 1295 | $1,700 | $1.31 | 17d | 1 | 0.73mi |
| 5 Wenonah Dr Pontiac, MI | 4.0 | 1.5 | 1749 | $2,000 | $1.14 | 43d | 1 | 0.83mi |
| 27 Sylvan Pontiac, MI | 2.0 | 1.5 | 1370 | $1,175 | $0.86 | 12d | 1 | 1.02mi |
| 949 Boston Ave Waterford Twp, MI | 2.0 | 1.0 | 1320 | $1,150 | $0.87 | 43d | 1 | 1.05mi |
| 949 Boston Ave Unit 1 Waterford Township, MI | 2.0 | 1.0 | 1220 | $1,150 | $0.94 | 21d | 1 | 1.05mi |
| 4000 Winston Dr Pontiac, MI | 2.0 | 1.5 | 1032 | $515 | $0.50 | 2d | 1 | 1.11mi |
| 49 Oakhill St Pontiac, MI | 3.0 | 1.0 | 1200 | $1,575 | $1.31 | 24d | 1 | 1.11mi |
| 995 Lakeview St Waterford, MI | 2.0 | 1.5 | 884 | $1,375 | $1.56 | 24d | 1 | 1.18mi |
| 65 Whitfield St Pontiac, MI | 3.0 | 1.0 | 924 | $1,175 | $1.27 | 43d | 1 | 1.23mi |
| 249 W Wilson Ave Unit 1 Pontiac, MI | 3.0 | 1.0 | 900 | $1,540 | $1.71 | 43d | 1 | 1.34mi |
| 91 Waterly Ave Waterford, MI | 3.0 | 1.5 | 1550 | $1,660 | $1.07 | 1d | 1 | 1.39mi |
| 59 N Lynn Ave Waterford, MI | 3.0 | 1.0 | 1300 | $2,100 | $1.62 | 2d | 1 | 1.48mi |
Listing history 25 events
-
2026-06-13statusdays on market $120,000 Pending 63 DOM
-
2026-06-09days on market $120,000 Active Under Contract 61 DOM
-
2026-06-08days on market $120,000 Active Under Contract 60 DOM
-
2026-06-07days on market $120,000 Active Under Contract 59 DOM
-
2026-06-04days on market $120,000 Active Under Contract 56 DOM
-
2026-06-03days on market $120,000 Active Under Contract 55 DOM
-
2026-06-02days on market $120,000 Active Under Contract 54 DOM
-
2026-06-01days on market $120,000 Active Under Contract 53 DOM
-
2026-05-31days on market $120,000 Active Under Contract 52 DOM
-
2026-04-28status Active 385-char remark
Show marketing remark (385 chars)
* Back on market due to buyer financing * Welcome to this spacious, colonial home with the lot next door at 55 Henderson being included in the sale. This home is waiting for a handy first time homebuyer or an experienced investor to put the finishing touches. Along with being located close to major freeways and downtown, this home is just what you need. Schedule your showing today.
-
2026-04-24historical Accepting Backup Offers 385-char remark
Show marketing remark (385 chars)
* Back on market due to buyer financing * Welcome to this spacious, colonial home with the lot next door at 55 Henderson being included in the sale. This home is waiting for a handy first time homebuyer or an experienced investor to put the finishing touches. Along with being located close to major freeways and downtown, this home is just what you need. Schedule your showing today.
-
2026-04-24historical Active Under Contract 385-char remark
Show marketing remark (385 chars)
* Back on market due to buyer financing * Welcome to this spacious, colonial home with the lot next door at 55 Henderson being included in the sale. This home is waiting for a handy first time homebuyer or an experienced investor to put the finishing touches. Along with being located close to major freeways and downtown, this home is just what you need. Schedule your showing today.
-
2026-04-10$120,000 Active 385-char remark
Show marketing remark (385 chars)
* Back on market due to buyer financing * Welcome to this spacious, colonial home with the lot next door at 55 Henderson being included in the sale. This home is waiting for a handy first time homebuyer or an experienced investor to put the finishing touches. Along with being located close to major freeways and downtown, this home is just what you need. Schedule your showing today.
-
2026-04-07historical $120,000 385-char remark
Show marketing remark (385 chars)
* Back on market due to buyer financing * Welcome to this spacious, colonial home with the lot next door at 55 Henderson being included in the sale. This home is waiting for a handy first time homebuyer or an experienced investor to put the finishing touches. Along with being located close to major freeways and downtown, this home is just what you need. Schedule your showing today.
-
2017-12-12soldstatus $38,000 Sold
-
2017-12-12soldstatus $38,000 Closed
-
2017-11-27status Pending
-
2017-11-27status Pending
-
2017-11-13$39,900 Active
-
2017-11-13$39,900 Active
-
2015-04-13soldstatus $25,000
-
1998-12-30soldstatus $25,400
-
1989-11-20soldstatus $13,000
ⓘ Source: listings_history table (triggers on properties + properties_extension) + one-shot
backfill from property_details.listing_events for pre-trigger history.
Tax reassessment forecast MI · Partial reset (capped growth)
- Current annual tax
- $907 · $76/mo
- Projected year-2 tax
- $1,377 · $115/mo
- Expected delta
- +$471/yr (+$39/mo · 51.9%)
ⓘ Screening estimate from a state-policy table — verify with the county assessor before closing.
Climate risk First Street
- Flood 1/10 Low FEMA zone X (unshaded) · 0% chance over 30 yrs
- Wildfire 1/10 Low
- Heat 2/10 Low 7 d/yr ≥96°F today · 15 d/yr by 30 yrs out
- Wind 2/10 Low
- Air quality 3/10 Moderate 2 unhealthy d/yr today · 4 by 30 yrs out
Nearby sold comps map
Loading sold comps map…
Walkable amenities ~0.75 mi
Loading nearby amenities…
Taxation est. · year 1
- Rental income
- $18,384
- − Mortgage interest
- −$6,722
- − Property taxes
- −$907
- − Insurance
- −$600
- − Repairs & maintenance
- −$1,471
- − Management
- −$1,471
- − Depreciation
- −$3,491
- Taxable income
- $3,723
- Est. tax owed @ 24.0%
- −$894
- After-tax cash flow
- $4,572/yr
For passive investors: Depreciation is non-cash, so a rental often shows a tax loss while cash-flowing — sheltering income. Rental losses are passive: they offset passive income freely, and up to $25,000/yr can offset ordinary (W-2) income if you actively participate and your MAGI is under $100k (phasing out to $0 by $150k); unused losses carry forward. On sale, claimed depreciation is recaptured at up to 25%, and gains may owe capital-gains tax (a 1031 exchange can defer both). Figures are a year-1 estimate at your 24.0% rate — not tax advice; consult a CPA.
Schools (NCES district)
- District
- Pontiac City School District
- NCES district ID
- 2628740
- Math proficiency
- 8% ▼ -5.00%
- Reading proficiency
- 17% ▼ -3.00%
- Median HH income
- $33,888
- Composite
- 10.12/100
- National rank
- #9802
- State rank
- #514 of 540 in MI
Livability — Pontiac
- Score
- 64/100
- State rank
- #499
- US rank
- #14703
Category grades
Schools grade is shown separately in the Schools card above.
Census & demographics
- Census place
- Pontiac, MI
- County
- Oakland County · 1,009,092 people
- City population
- 44,593
- Metro
- Detroit-Warren-Dearborn, MI
- Population (ZIP)
- 18,924
- Household income
- $51,390
- Rent vs Own
- Severe rent burden
- 833.0
Population outlook (Oakland County) Hauer SSP2
- Today (2025)
- 1,335,747 people
- By 2030
- 1,375,100 · +2.9%
- By 2040
- 1,435,385 · +7.5%
- By 2050
- 1,469,250 · +10.0%
- By 2075
- 1,531,946 · +14.7%
- By 2100
- 1,450,485 · +8.6%
Race, ethnicity, and origin ACS 2023
- Neighborhood character
- Diverse neighborhood (Simpson 0.61)
- Race & ethnicity
- Black 57% White 22% Hispanic / Latino 12% Two or more races 11% Asian 3%
- Hispanic origin (detail)
- Mexican 4% Puerto Rican 2%
- Common ancestry
- Slovak 2% Romanian 1% Swiss 1%
- Foreign-born
- 10% · Canada
- Languages at home
- 86% English-only · Spanish 9% Other Indo-European 1% Other Asian/Pacific 1%
Political lean MEDSL · Oakland
- 2024 margin
- D (+10.6) · D 54.4% · R 43.8% · Other 1.9%
- 2008→2024 swing
- -3.9pp toward R · 2008: 14.5pp · 2024: 10.6pp
- All cycles
- 2024: D+10.6 2020: D+14.1 2016: D+8.1 2012: D+8.1 2008: D+14.5
Not yet ingested
- Civics
- —
Market trends
- HPI YoY
- ▼ -204.11%
- Current HPI
- 257.8941
- Rent YoY
- —
- Metro
- Detroit-Warren-Dearborn, MI
- State GDP YoY
- ▲ 1.37%
- F500 in state
- 28
Industry mix (Fortune 500 HQ in MI)
| Industry | F500 HQs | Revenue |
|---|---|---|
| Automotive Parts | 3 | $48B |
|
||
| Automotive | 2 | $372B |
|
||
| Chemicals | 1 | $45B |
|
||
| Automotive Retail | 1 | $29B |
|
||
| Healthcare / Medical Devices | 1 | $23B |
|
||
| Automotive Technology | 1 | $20B |
|
||
Price history
+823.1% since first listed16 events — show timeline
- 2026-04-28 Relisted — MiRealSource-MiMLS
- 2026-04-28 Relisted — REALCOMP
- 2026-04-24 Contingent — MiRealSource-MiMLS
- 2026-04-24 Contingent — REALCOMP
- 2026-04-10 Listed $120,000 REALCOMP
- 2026-04-10 Listed $120,000 MiRealSource-MiMLS
- 2026-04-07 Coming Soon $120,000 MiRealSource-MiMLS
- 2017-12-12 Sold (MLS) $38,000 MiRealSource-MiMLS
- 2017-12-12 Sold (MLS) $38,000 REALCOMP
- 2017-11-27 Pending — MiRealSource-MiMLS
- 2017-11-27 Pending — REALCOMP
- 2017-11-13 Listed $39,900 MiRealSource-MiMLS
- 2017-11-13 Listed $39,900 REALCOMP
- 2015-04-13 Sold (Public Records) $25,000 Public Records
- 1998-12-30 Sold (Public Records) $25,400 Public Records
- 1989-11-20 Sold (Public Records) $13,000 Public Records
Property tax history
+2.3%/yrLatest (2025): $907 · -9.3% YoY. Source: county tax records.
Cash-flow waterfall
monthlySold comps — $/sqft
last 12 mo · ≤1 miLoading sold comps…