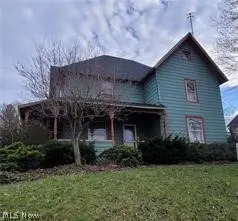
323 W Liberty · Hubbard, OH
Flood risk 1/10 · Minimal
- FEMA flood zone
- X (unshaded)
- Chance of flooding over 30 yrs
- 0.0%
- Est. flood insurance / yr
- $473 – $860
Fire risk 1/10 · Minimal
- Est. fire insurance / yr
- $713 – $1,323
Heat risk 3/10 · Minor
- Hot days now (above 97°F)
- 7 days/yr
- Hot days in 30 yrs
- 18 days/yr
Wind risk 1/10 · Minimal
- Chance of severe wind over 30 yrs
- —
Air-quality risk 3/10 · Minor
- Unhealthy air days now
- 2 days/yr
- Unhealthy air days in 30 yrs
- 6 days/yr
Risk factors via First Street. Map © Google.
Why this score? — see what drove the B+ grade
The composite is a weighted blend of 9 inputs, each scored 0–100. Each bar is that input's sub-score; the figure is the points it added to the 100-point composite (weight × sub-score).
- Cash flow +30.0/30.0
- ARV discount +15.0/15.0
- 1% rule +10.0/10.0
- DSCR +10.0/10.0
- Schools +4.8/10.0
- Livability +3.5/5.0
- Rent growth +2.5/5.0
- Condition / age +2.5/5.0
- Appreciation +0.0/10.0
$79,900
🖨 Deal sheet 📄 Offer letter ✓ Due diligence
Listing remarks MLS
Prime Commercial property. Use as a duplex, single family or business. Newer roof. Generously sized rooms. Located in the heart of Hubbard.
Key facts
- Newer roof
- 0.32 acre lot
- Parking
Tags
Neighborhood map
What this means for you Summary
Snapshot
- This is a 4-bed/2.0-bath single-family listed at $80k.
Deal economics
- At list price, monthly cash flow is $501 ($6k/yr) — positive.
- The deal already cash-flows at list — no discount required.
- Meets the 1% rule at list price ($1k rent vs $80k).
- Recommended offer: $75k (6.0% below list) — sets the bar for market timing.
- Cap rate 13.8% vs local median 3.3% in Hubbard — top-decile yield for the area; either an underpriced asset or a hidden risk that comps aren't pricing in. Stress-test before assuming the spread holds.
Location & tenants
- Location reads 70/100 on livability (#473 in OH) — a middle-class / working-renter tenant base. Strengths: cost of living A+, housing A+, schools A-; Watch: amenities F, commute F, health & safety F.
- Hubbard Exempted Village (suburban): math 54% / reading 60% proficiency, ranked #346 of 656 in OH (top 53%) — acceptable for families but not a draw, mixed tenant base, ~2y average lease.
- Market conditions: 62 active listings in the ZIP; 129 units permitted in Trumbull County in 2024 (0 in 5+ unit buildings).
Forward outlook
- Local home prices are declining (-3.0%/yr); year-one equity from $552 of loan paydown is wiped out by about $2k of value loss. Plan a longer hold.
- Trumbull County population projected at -22% by 2050 — secular population decline; favor cash flow + early exit over multi-decade hold.
- At projected returns (-3.0% appreciation + 3.0% rent growth), your $22k cash investment doubles in ~5 years — after that, you're playing with house money.
Negotiation context
- It's been on market 90 days — a 6% lower offer ($75k) is reasonable based on typical stale-listing flexibility.
- 7 sale attempts since 23y ago with the ask held roughly flat each time — persistent listings suggest the price (not the market) is what's stuck; bring a comps-based counter.
- Current owner paid $31k; list at $80k implies a 161% gain — meaningful room to come down on a strong offer.
Risks & watch-outs
- Watch-outs: built in 1900 — expect roof / HVAC / electrical / plumbing capex.
Questions for the listing agent
- It's been on market 90 days. Have you received any prior offers? Is the seller open to a 6% concession, seller financing, or rate buy-down credit?
- Built in 1900 — when were the roof, HVAC, electrical panel, plumbing, and water heater last replaced?
- Why hasn't it sold? Are there any deal-killer items the seller is aware of (foundation, flood, title, zoning, code violations)?
- Is there a deadline driving the sale (1031 exchange, divorce, estate, relocation)? That informs how much negotiation room exists.
- Schools are A-rated — typically a magnet for longer-tenancy family renters. What's the average tenant stay here, and is there a school-zone premium baked into asking?
- What's the average days-on-market for RENTAL listings here right now (not sales)? A rising rental-DOM trend means longer vacancies and softer asking-rent achievability than the comps imply.
- What's the recent tenant-quality profile in this submarket — average credit score on applications, eviction rate, late-payment / NSF rate, and stable-employment percentage? A property-management company in the area should have these aggregated.
- How much new for-sale + rental construction is in the pipeline within 1–3 miles? Heavy new supply typically softens prices + rents 12–24 months out; constrained supply supports both.
Investment metrics
- 1% rule
- 1.74% ✓
- Cap rate
- 13.82%
- Cash-on-cash
- 26.88%
- DSCR
- 2.20
- GRM
- 4.8
CMA / ARV
- ARV (median comp)
- $122,983
- List price
- $79,900
- Delta
- -35.03%
- Verdict
- UNDERPRICED
- Comps
- 10 within 1.0 mi
Show comp detail 12 sales within ~0.75 mi
| Address | Dist | Beds/Ba | Sqft | Sold | Price | $/sf | Match |
|---|---|---|---|---|---|---|---|
| 351 Center St | 0.30mi | 3/2.0 (-1) | 1,824 (-8%) | 6mo | $159,000 | $87 | 63 |
| 444 Grandview Ave SE | 0.59mi | 3/2.0 (-1) | 1,880 (-5%) | 1mo | $289,900 | $154 | 58 |
| 100 Forest Hill Dr | 0.68mi | 3/2.5 (-1) | 2,044 (+3%) | 1mo | $445,000 | $218 | 56 |
| 559 Jackson St | 0.45mi | 3/2.0 (-1) | 1,782 (-10%) | 2mo | $213,000 | $120 | 56 |
| 959 Dogwood Dr | 0.64mi | 3/2.5 (-1) | 1,988 (+0%) | 9mo | $269,900 | $136 | 55 |
| 836 School St | 0.47mi | 5/1.5 (+1) | 2,182 (+10%) | 4mo | $126,500 | $58 | 51 |
| 312 W Park Ave | 0.38mi | 4/2.5 | 1,696 (-14%) | 7mo | $175,000 | $103 | 50 |
| 191 Maple Leaf Dr | 0.67mi | 4/2.5 | 2,136 (+8%) | 8mo | $440,000 | $206 | 47 |
| 652 Meadowland Dr | 0.66mi | 3/1.5 (-1) | 1,860 (-6%) | 8mo | $205,000 | $110 | 45 |
| 134 Buckeye Dr | 0.74mi | 4/2.5 | 1,784 (-10%) | 9mo | $270,000 | $151 | 39 |
| 1009 Palmetto Dr | 0.68mi | 4/3.0 | 2,200 (+11%) | 10mo | $339,900 | $155 | 38 |
| 231 Princeton Ave | 0.75mi | 4/2.0 | 1,729 (-13%) | 16mo | $160,000 | $93 | 30 |
Match score weights: distance 35% · size 25% · config 20% · recency 20%. Top-matched comps best support the ARV.
Projected returns pro-forma
-3.0% appreciation · 3.0% rent growth · sell at horizon
- IRR
- 20.8%
- Equity multiple
- 1.85×
- Total profit
- $19,013
- Equity at exit
- $11,913
- IRR
- 29.0%
- Equity multiple
- 3.59×
- Total profit
- $57,844
- Equity at exit
- $6,908
Cash invested: $22,372 (down + closing). Projections, not guarantees.
Landlord ↔ Tenant lean methodology
- Overall (STATE)
- 73 Landlord-Friendly
- State Ohio
- 73 Landlord-Friendly · R+6
- County
- — inherits STATE
- City
- — inherits STATE
ZIP-level market 44425
- Home prices YoY
- -25.2%
- Active inventory
- 62
- Price-to-rent
- 4.8×
Monthly cashflow live
- Estimated rent
- $1,389 medium interval (Pro) →
- Mortgage (P&I)
- −$419
- Tax from tax record
- −$144 /mo · $1,728/yr
- Insurance
- −$33
- HOA
- −$0
- Vacancy / Maint / Mgmt
- −$292
- Net cashflow
- $501
Break-even live
UW: 25.0% down · 7.5% · 30yr · 1.5% tax · 5.0% vac · 8.0% maint · 8.0% mgmt
Financing live
Cash to close
- Down payment
- $19,975
- Closing costs
- $2,397
- Reserves months
- —
- Total cash needed
- —
Loan-product check · same deal, 3 products live
Conventional
25% down · 7.5% · 30yr
- Down + closing
- —
- Monthly P&I
- —
- Monthly cashflow
- —
- DSCR
- —
- Eligible?
- —
Personal DTI + credit; lowest rate.
DSCR
20% down · 8.5% · 30yr
- Down + closing
- —
- Monthly P&I
- —
- Monthly cashflow
- —
- DSCR
- —
- Eligible?
- —
No personal income docs; deal must DSCR.
Hard money
10% down · 12.0% · 12mo
- Down + closing
- —
- Monthly P&I
- —
- Monthly cashflow
- —
- DSCR
- —
- Eligible?
- —
Short-term bridge; refi at stabilization.
Listing history 33 events
-
2026-06-19days on market $79,900 Active 90 DOM
-
2026-06-18days on market $79,900 Active 89 DOM
-
2026-06-17days on market $79,900 Active 88 DOM
-
2026-06-16days on market $79,900 Active 87 DOM
-
2026-06-15days on market $79,900 Active 86 DOM
-
2026-06-14days on market $79,900 Active 84 DOM
-
2026-06-13days on market $79,900 Active 83 DOM
-
2026-06-10days on market $79,900 Active 81 DOM
-
2026-06-09days on market $79,900 Active 80 DOM
-
2026-06-08days on market $79,900 Active 79 DOM
-
2026-06-07days on market $79,900 Active 78 DOM
-
2026-06-05days on market $79,900 Active 75 DOM
-
2026-06-02days on market $79,900 Active 73 DOM
-
2026-06-01days on market $79,900 Active 72 DOM
-
2026-05-31days on market $79,900 Active 71 DOM
-
2026-05-30days on market $79,900 Active 70 DOM
-
2026-03-20$79,900 Active 139-char remark
Show marketing remark (139 chars)
Prime Commercial property. Use as a duplex, single family or business. Newer roof. Generously sized rooms. Located in the heart of Hubbard.
-
2025-11-27historical
-
2025-05-27$89,900 Active
-
2024-09-07historical
-
2024-02-07$99,000 Active
-
2022-10-20historical
-
2022-09-20price $87,000
-
2022-04-20$99,900 Active
-
2019-06-13status Pending
-
2019-05-10status Pending
-
2019-05-10historical
-
2019-04-13$38,900 Active
-
2004-09-04historical
-
2004-07-06$76,900
-
2004-03-27historical
-
2003-04-17$76,900
-
1990-01-12soldstatus $30,600
ⓘ Source: listings_history table (triggers on properties + properties_extension) + one-shot
backfill from property_details.listing_events for pre-trigger history.
Tax reassessment forecast OH · Partial reset (capped growth)
- Current annual tax
- $1,728 · $144/mo
- Projected year-2 tax
- $1,728 · $144/mo
- Expected delta
- $0/yr ($0/mo · 0.0%)
ⓘ Screening estimate from a state-policy table — verify with the county assessor before closing.
Climate risk First Street
- Flood 1/10 Low FEMA zone X (unshaded) · 0% chance over 30 yrs
- Wildfire 1/10 Low
- Heat 3/10 Moderate 7 d/yr ≥97°F today · 18 d/yr by 30 yrs out
- Wind 1/10 Low
- Air quality 3/10 Moderate 2 unhealthy d/yr today · 6 by 30 yrs out
Nearby sold comps map
Loading sold comps map…
Walkable amenities ~0.75 mi
Loading nearby amenities…
Taxation est. · year 1
- Rental income
- $16,669
- − Mortgage interest
- −$4,476
- − Property taxes
- −$1,728
- − Insurance
- −$400
- − Repairs & maintenance
- −$1,333
- − Management
- −$1,333
- − Depreciation
- −$2,324
- Taxable income
- $5,074
- Est. tax owed @ 24.0%
- −$1,218
- After-tax cash flow
- $4,795/yr
For passive investors: Depreciation is non-cash, so a rental often shows a tax loss while cash-flowing — sheltering income. Rental losses are passive: they offset passive income freely, and up to $25,000/yr can offset ordinary (W-2) income if you actively participate and your MAGI is under $100k (phasing out to $0 by $150k); unused losses carry forward. On sale, claimed depreciation is recaptured at up to 25%, and gains may owe capital-gains tax (a 1031 exchange can defer both). Figures are a year-1 estimate at your 24.0% rate — not tax advice; consult a CPA.
Schools (NCES district)
- District
- Hubbard Exempted Village
- NCES district ID
- 3904542
- Math proficiency
- 54% ▼ -19.00%
- Reading proficiency
- 60% ▼ -12.00%
- Median HH income
- $45,623
- Composite
- 48.15/100
- National rank
- #2179
- State rank
- #346 of 656 in OH
Livability — Hubbard
- Score
- 70/100
- State rank
- #473
- US rank
- #7892
Category grades
Schools grade is shown separately in the Schools card above.
Census & demographics
- Census place
- Hubbard, OH
- County
- Trumbull · 193,293 people
- City population
- 13,329
- Metro
- Youngstown-Warren, OH
- Population (ZIP)
- 13,329
- Household income
- $62,287
- Rent vs Own
- Severe rent burden
- 11.1
Population outlook (Trumbull County) Hauer SSP2
- Today (2025)
- 191,696 people
- By 2030
- 184,015 · -4.0%
- By 2040
- 166,810 · -13.0%
- By 2050
- 149,857 · -21.8%
- By 2075
- 115,769 · -39.6%
- By 2100
- 83,617 · -56.4%
Race, ethnicity, and origin ACS 2023
- Neighborhood character
- Predominantly White (92%)
- Race & ethnicity
- White 92% Hispanic / Latino 3% Black 3% Two or more races 2%
- Common ancestry
- Romanian 4% Slovak 2% Scandinavian 1%
- Foreign-born
- 2% · Canada
- Languages at home
- 97% English-only · Spanish 1%
Political lean MEDSL · Trumbull
- 2024 margin
- R (+16.8) · D 41.2% · R 58.0%
- 2008→2024 swing
- -39.2pp toward R · 2008: 22.4pp · 2024: -16.8pp
- All cycles
- 2024: R+16.8 2020: R+10.6 2016: R+6.4 2012: D+22.2 2008: D+22.4
Not yet ingested
- Civics
- —
Market trends
- HPI YoY
- ▼ -68.06%
- Current HPI
- 201.5984
- Rent YoY
- —
- Metro
- —
- State GDP YoY
- ▲ 1.98%
- F500 in state
- 48
Industry mix (Fortune 500 HQ in OH)
| Industry | F500 HQs | Revenue |
|---|---|---|
| Insurance | 3 | $145B |
|
||
| Industrial Machinery | 3 | $49B |
|
||
| Financial Services | 3 | $24B |
|
||
| Consumer Goods | 2 | $93B |
|
||
| Aerospace / Defense | 2 | $47B |
|
||
| Utilities | 2 | $33B |
|
||
Price history
+161.1% since first listed17 events — show timeline
- 2026-03-20 Listed $79,900 MLSNOW
- 2025-11-27 Listing Removed — MLSNOW
- 2025-05-27 Listed $89,900 MLSNOW
- 2024-09-07 Listing Removed — MLSNOW
- 2024-02-07 Listed $99,000 MLSNOW
- 2022-10-20 Listing Removed — MLSNOW
- 2022-09-20 Price Changed $87,000 MLSNOW
- 2022-04-20 Listed $99,900 MLSNOW
- 2019-06-13 Pending — MLSNOW
- 2019-05-10 Pending — MLSNOW
- 2019-05-10 Listing Removed — MLSNOW
- 2019-04-13 Listed $38,900 MLSNOW
- 2004-09-04 Listing Removed — MLSNOW
- 2004-07-06 Listed $76,900 MLSNOW
- 2004-03-27 Listing Removed — MLSNOW
- 2003-04-17 Listed $76,900 MLSNOW
- 1990-01-12 Sold (Public Records) $30,600 Public Records
Property tax history
+2.5%/yrLatest (2025): $1,728 · +1.8% YoY. Source: county tax records.
Cash-flow waterfall
monthlySold comps — $/sqft
last 12 mo · ≤1 miLoading sold comps…