 Duplex
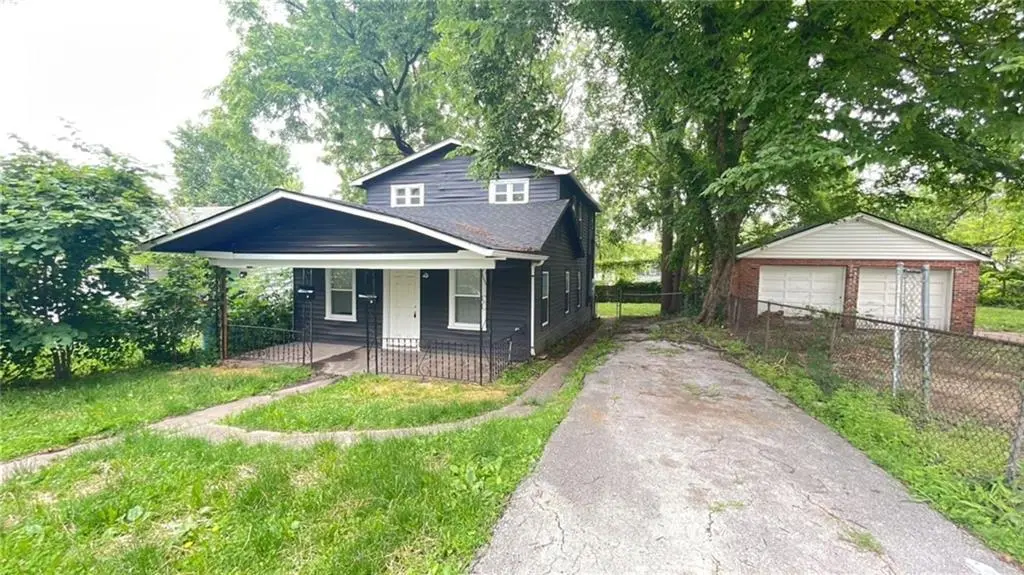
807 S Hardy Ave · Independence, MO
Flood risk 1/10 · Minimal
- FEMA flood zone
- X (unshaded)
- Chance of flooding over 30 yrs
- 0.0%
- Est. flood insurance / yr
- $507 – $1,088
Fire risk 1/10 · Minimal
- Est. fire insurance / yr
- $1,054 – $1,958
Heat risk 4/10 · Minor
- Hot days now (above 106°F)
- 7 days/yr
- Hot days in 30 yrs
- 17 days/yr
Wind risk 2/10 · Minimal
- Chance of severe wind over 30 yrs
- —
Air-quality risk 3/10 · Minor
- Unhealthy air days now
- 2 days/yr
- Unhealthy air days in 30 yrs
- 3 days/yr
Risk factors via First Street. Map © Google.
Why this score? — see what drove the B- grade
The composite is a weighted blend of 9 inputs, each scored 0–100. Each bar is that input's sub-score; the figure is the points it added to the 100-point composite (weight × sub-score).
- Cash flow +22.6/30.0
- ARV discount +10.7/15.0
- Appreciation +10.0/10.0
- DSCR +7.2/10.0
- 1% rule +4.8/10.0
- Livability +4.1/5.0
- Schools +2.7/10.0
- Rent growth +2.5/5.0
- Condition / age +2.5/5.0
$190,000
🖨 Deal sheet 📄 Offer letter ✓ Due diligence
Multi-family units
County records classify this as Multi-Family (2-4 Unit). Listing-text estimate: 2 units. confirmed
Listing remarks MLS
Investors, don’t miss this turn-key opportunity at 807 S Hardy in Independence, MO—a FULLY REMODELED duplex that is fully occupied. Each unit features 2 bedrooms and 1 bathroom, new plank flooring, gorgeous cermanic tile in kitchens and bathrooms. Each unit is approximately 700 sq ft. Both have modern mini-split HVAC systems for efficient comfort. The property features a nice-sized front porch for one unit and a spacious backyard for the other, all in a desirable Independence neighborhood. This beautifully renovated duplex is now low-maintenance and ideal for investors seeking strong rental demand! Agents - please contact listing agent direct to schedule a showing!
Key facts
- Spacious backyard
- New plank flooring
- 5,016 sq ft lot
Tags
Neighborhood map
What this means for you Summary
Snapshot
- This is a 2 × 2-bed/1-bath units multifamily listed at $190k.
Deal economics
- At list price, monthly cash flow is $324 ($4k/yr) — positive. Per door: $162/mo.
- The deal already cash-flows at list — no discount required.
- To meet the 1% rule (rent ≥ 1% of price), the offer needs to be $187k (1.7% below list).
- Recommended offer: $167k (12.0% below list) — sets the bar for market timing.
- Cap rate 8.3% vs local median 5.0% in Independence — top-decile yield for the area; either an underpriced asset or a hidden risk that comps aren't pricing in. Stress-test before assuming the spread holds.
Location & tenants
- Location reads 82/100 on livability (#10 in MO, #1,296 nationally) — a professional / high-income tenant draw. Strengths: amenities A+, commute A+, cost of living A+; Watch: schools C-, employment D+, crime F.
- Independence 30 (suburban): math 26% / reading 38% proficiency, ranked #252 of 324 in MO (top 78%) — families likely to look elsewhere, expect single-tenant / working-renter base with shorter leases.
- Market conditions: 46 active listings in the ZIP; 19 comparable units currently listed for rent nearby; rentals at typical pace (median 18d on market — plan ~3-4 weeks tenant-placement turnaround); 4,002 units permitted in Jackson County in 2024 (2,271 in 5+ unit buildings).
- At $1,867/mo this rent would consume 47% of the median local household income ($47k/yr) (locally 330% of renters already pay >50% of income on rent) — very limited rent-growth headroom before tenants either downsize or default.
Forward outlook
- In year one you build about $20k of equity ($1k loan paydown + $19k appreciation (10.0% local appreciation)).
- Jackson County population projected at +4% by 2050 — modest demand growth; plan on rents tracking national, not racing it.
- At projected returns (10.0% appreciation + 3.0% rent growth), your $53k cash investment doubles in ~3 years — after that, you're playing with house money.
- By year 2, paydown + projected appreciation supports a ~$33k cash-out refi (75% LTV) — recoverable capital for the next deal without selling this one.
Negotiation context
- It's been on market 138 days — a 12% lower offer ($167k) is reasonable based on typical stale-listing flexibility.
- 6 sale attempts since 25y ago with the ask held roughly flat each time — persistent listings suggest the price (not the market) is what's stuck; bring a comps-based counter.
Risks & watch-outs
- Watch-outs: built in 1915 — expect roof / HVAC / electrical / plumbing capex.
Questions for the listing agent
- It's been on market 138 days. Have you received any prior offers? Is the seller open to a 12% concession, seller financing, or rate buy-down credit?
- Can we see the unit-by-unit rent roll, current vacancy, and any below-market leases? What's the average tenancy length?
- What capital expenditures (roof, boiler, parking lot, exteriors) have been made in the last 5 years, and what's planned in the next 2?
- Built in 1915 — when were the roof, HVAC, electrical panel, plumbing, and water heater last replaced?
- Why hasn't it sold? Are there any deal-killer items the seller is aware of (foundation, flood, title, zoning, code violations)?
- Is there a deadline driving the sale (1031 exchange, divorce, estate, relocation)? That informs how much negotiation room exists.
- Crime grade is F in this area — have there been break-ins, vandalism, or insurance claims at this property in the last 3 years? What carrier currently insures it and at what premium?
- What's the average days-on-market for RENTAL listings here right now (not sales)? A rising rental-DOM trend means longer vacancies and softer asking-rent achievability than the comps imply.
- What's the recent tenant-quality profile in this submarket — average credit score on applications, eviction rate, late-payment / NSF rate, and stable-employment percentage? A property-management company in the area should have these aggregated.
- How much new apartment / multifamily construction is in the pipeline within 1–3 miles? Heavy new supply (>2% of stock underway) typically softens rents 12–24 months out; light construction supports rent growth.
Investment metrics
- 1% rule
- 0.98% ✗
- Cap rate
- 8.34%
- Cash-on-cash
- 7.30%
- DSCR
- 1.32
- GRM
- 8.5
CMA / ARV
- ARV (median comp)
- $204,522
- List price
- $190,000
- Delta
- -7.10%
- Verdict
- FAIR
- Comps
- 6 within 1.0 mi
Show comp detail 1 sale within ~0.75 mi
| Address | Dist | Beds/Ba | Sqft | Sold | Price | $/sf | Match |
|---|---|---|---|---|---|---|---|
| 10501 E 8th St | 0.14mi | 4/2.0 | 1,516 (+3%) | 15mo | $190,000 | $125 | 76 |
Match score weights: distance 35% · size 25% · config 20% · recency 20%. Top-matched comps best support the ARV.
Projected returns pro-forma
10.0% appreciation · 3.0% rent growth · sell at horizon
- IRR
- 29.6%
- Equity multiple
- 3.33×
- Total profit
- $124,020
- Equity at exit
- $171,167
- IRR
- 25.7%
- Equity multiple
- 7.56×
- Total profit
- $348,868
- Equity at exit
- $369,128
Cash invested: $53,200 (down + closing). Projections, not guarantees.
Landlord ↔ Tenant lean methodology
- Overall (STATE)
- 81 Strongly Landlord-Friendly
- State Missouri
- 81 Strongly Landlord-Friendly · R+10
- County
- — inherits STATE
- City
- — inherits STATE
ZIP-level market 64053
- Home prices YoY
- 17.9%
- Active inventory
- 46
- Price-to-rent
- 17.0×
Monthly cashflow live
- Estimated rent
- $1,867 high interval (Pro) →
- Mortgage (P&I)
- −$996
- Tax from tax record
- −$76 /mo · $909/yr
- Insurance
- −$79
- HOA
- −$0
- Vacancy / Maint / Mgmt
- −$392
- Net cashflow
- $324
Break-even live
2-unit breakdown (identical units grouped — click to expand)
| Units | Beds | Baths | Est. rent |
|---|---|---|---|
| 2× units | 2 | 1 | $1,866 |
| #1 | 2 | 1 | $933 |
| #2 | 2 | 1 | $933 |
| Total (2 units) | $1,867 | ||
UW: 25.0% down · 7.5% · 30yr · 1.5% tax · 5.0% vac · 8.0% maint · 8.0% mgmt
Financing live
Cash to close
- Down payment
- $47,500
- Closing costs
- $5,700
- Reserves months
- —
- Total cash needed
- —
Loan-product check · same deal, 3 products live
Conventional
25% down · 7.5% · 30yr
- Down + closing
- —
- Monthly P&I
- —
- Monthly cashflow
- —
- DSCR
- —
- Eligible?
- —
Personal DTI + credit; lowest rate.
DSCR
20% down · 8.5% · 30yr
- Down + closing
- —
- Monthly P&I
- —
- Monthly cashflow
- —
- DSCR
- —
- Eligible?
- —
No personal income docs; deal must DSCR.
Hard money
10% down · 12.0% · 12mo
- Down + closing
- —
- Monthly P&I
- —
- Monthly cashflow
- —
- DSCR
- —
- Eligible?
- —
Short-term bridge; refi at stabilization.
Rent comps 19 comps
| Address | Beds | Baths | Sqft | Rent | $/sqft | DOM | Units | Dist |
|---|---|---|---|---|---|---|---|---|
| 10104 E Golf Ave Independence, MO | 3.0 | 2.0 | 1205 | $1,395 | $1.16 | 15d | 1 | 0.22mi |
| 1109 S Appleton Ave Independence, MO | 3.0 | 2.0 | 1200 | $1,195 | $1.00 | 16d | 1 | 0.34mi |
| 1416 S Hardy Ave Independence, MO | 5.0 | 2.0 | 1328 | $1,625 | $1.22 | 44d | 1 | 0.51mi |
| 9528 E Winner Rd Independence, MO | 1.0–3.0 | 1.0 | 730 | $1,099 | $1.51 | 44d | 1 | 0.58mi |
| 554 S Arlington Ave Independence, MO | 4.0 | 1.0 | 1161 | $1,395 | $1.20 | 15d | 1 | 0.59mi |
| 1425 S Northern Blvd Independence, MO | 3.0 | 1.5 | 1275 | $1,200 | $0.94 | 8d | 1 | 0.62mi |
| 600 S Glenwood Ave Unit G-2 Independence, MO | 3.0 | 2.0 | 1600 | $1,650 | $1.03 | 21d | 1 | 0.66mi |
| 600 S Glenwood Ave Unit G Independence, MO | 4.0 | 2.0 | 1600 | $1,675 | $1.05 | 44d | 1 | 0.66mi |
| 576 S Oxford Ave Independence, MO | 3.0 | 2.0 | 1098 | $1,400 | $1.28 | 44d | 1 | 0.72mi |
| 10622 E Scarritt Ave Sugar Creek, MO | 4.0 | 1.0 | 1560 | $1,445 | $0.93 | 44d | 1 | 0.86mi |
| 11323 E Thompson St Sugar Creek, MO | 3.0 | 2.5 | 1794 | $1,800 | $1.00 | 12d | 1 | 0.86mi |
| 100 S Oxford Ave Independence, MO | 3.0 | 2.0 | 1141 | $1,425 | $1.25 | 44d | 1 | 0.97mi |
| 11500 E Anderson St Independence, MO | 3.0 | 2.0 | 1200 | $1,599 | $1.33 | 17d | 1 | 0.97mi |
| 182 Novak St Sugar Creek, MO | 3.0 | 2.0 | 1350 | $1,800 | $1.33 | 17d | 1 | 1.04mi |
| 10817 E 19th Ter S Independence, MO | 3.0 | 1.0 | 1428 | $1,801 | $1.26 | 16d | 1 | 1.11mi |
| 10323 E 20th St S Independence, MO | 3.0 | 1.0 | 936 | $1,400 | $1.50 | 44d | 1 | 1.12mi |
| 2110 S Sterling Ave Independence, MO | 3.0 | 2.0 | 1722 | $1,849 | $1.07 | 16d | 1 | 1.28mi |
| 11709 E Winner Rd Independence, MO | 3.0 | 1.5 | 1300 | $1,195 | $0.92 | 16d | 1 | 1.33mi |
| 2256 S Sterling Ave Independence, MO | 3.0 | 1.5 | 1284 | $1,399 | $1.09 | 16d | 1 | 1.38mi |
Listing history 29 events
-
2026-06-18days on market $190,000 Active 138 DOM
-
2026-06-17days on market $190,000 Active 137 DOM
-
2026-06-16days on market $190,000 Active 136 DOM
-
2026-06-15days on market $190,000 Active 135 DOM
-
2026-06-13days on market $190,000 Active 133 DOM
-
2026-06-09days on market $190,000 Active 129 DOM
-
2026-06-08days on market $190,000 Active 128 DOM
-
2026-06-07days on market $190,000 Active 127 DOM
-
2026-06-05days on market $190,000 Active 124 DOM
-
2026-06-03days on market $190,000 Active 123 DOM
-
2026-06-02days on market $190,000 Active 122 DOM
-
2026-06-01days on market $190,000 Active 121 DOM
-
2026-05-31days on market $190,000 Active 120 DOM
-
2026-03-28price $190,000 685-char remark
Show marketing remark (685 chars)
Investors, don’t miss this turn-key opportunity at 807 S Hardy in Independence, MO—a FULLY REMODELED duplex that is fully occupied. Each unit features 2 bedrooms and 1 bathroom, new plank flooring, gorgeous cermanic tile in kitchens and bathrooms. Each unit is approximately 700 sq ft. Both have modern mini-split HVAC systems for efficient comfort. The property features a nice-sized front porch for one unit and a spacious backyard for the other, all in a desirable Independence neighborhood. This beautifully renovated duplex is now low-maintenance and ideal for investors seeking strong rental demand! Agents - please contact listing agent direct to schedule a showing!
-
2026-01-31$195,000 Active 685-char remark
Show marketing remark (685 chars)
Investors, don’t miss this turn-key opportunity at 807 S Hardy in Independence, MO—a FULLY REMODELED duplex that is fully occupied. Each unit features 2 bedrooms and 1 bathroom, new plank flooring, gorgeous cermanic tile in kitchens and bathrooms. Each unit is approximately 700 sq ft. Both have modern mini-split HVAC systems for efficient comfort. The property features a nice-sized front porch for one unit and a spacious backyard for the other, all in a desirable Independence neighborhood. This beautifully renovated duplex is now low-maintenance and ideal for investors seeking strong rental demand! Agents - please contact listing agent direct to schedule a showing!
-
2023-07-21soldstatus Closed 87-char remark
Show marketing remark (87 chars)
Up/down duplex, 2 bed, 1 ba each unit. Needs full rehab. Motivated sellers, make offer.
-
2023-07-06status Pending 87-char remark
Show marketing remark (87 chars)
Up/down duplex, 2 bed, 1 ba each unit. Needs full rehab. Motivated sellers, make offer.
-
2023-07-06status Active 87-char remark
Show marketing remark (87 chars)
Up/down duplex, 2 bed, 1 ba each unit. Needs full rehab. Motivated sellers, make offer.
-
2023-06-28historical 87-char remark
Show marketing remark (87 chars)
Up/down duplex, 2 bed, 1 ba each unit. Needs full rehab. Motivated sellers, make offer.
-
2023-06-12status Active 87-char remark
Show marketing remark (87 chars)
Up/down duplex, 2 bed, 1 ba each unit. Needs full rehab. Motivated sellers, make offer.
-
2023-06-12price $80,000 87-char remark
Show marketing remark (87 chars)
Up/down duplex, 2 bed, 1 ba each unit. Needs full rehab. Motivated sellers, make offer.
-
2023-06-03status Pending 87-char remark
Show marketing remark (87 chars)
Up/down duplex, 2 bed, 1 ba each unit. Needs full rehab. Motivated sellers, make offer.
-
2023-05-23status Active 87-char remark
Show marketing remark (87 chars)
Up/down duplex, 2 bed, 1 ba each unit. Needs full rehab. Motivated sellers, make offer.
-
2023-05-21status Pending 87-char remark
Show marketing remark (87 chars)
Up/down duplex, 2 bed, 1 ba each unit. Needs full rehab. Motivated sellers, make offer.
-
2023-05-15$124,000 Active 87-char remark
Show marketing remark (87 chars)
Up/down duplex, 2 bed, 1 ba each unit. Needs full rehab. Motivated sellers, make offer.
-
2001-11-30soldstatus
-
2001-11-28soldstatus
-
2001-08-10$59,000
-
1997-06-16soldstatus
ⓘ Source: listings_history table (triggers on properties + properties_extension) + one-shot
backfill from property_details.listing_events for pre-trigger history.
Tax reassessment forecast MO · Resets to sale price
- Current annual tax
- $909 · $76/mo
- Projected year-2 tax
- $1,843 · $154/mo
- Expected delta
- +$934/yr (+$78/mo · 102.8%)
ⓘ Screening estimate from a state-policy table — verify with the county assessor before closing.
Climate risk First Street
- Flood 1/10 Low FEMA zone X (unshaded) · 0% chance over 30 yrs
- Wildfire 1/10 Low
- Heat 4/10 Moderate 7 d/yr ≥106°F today · 17 d/yr by 30 yrs out
- Wind 2/10 Low
- Air quality 3/10 Moderate 2 unhealthy d/yr today · 3 by 30 yrs out
Nearby sold comps map
Loading sold comps map…
Walkable amenities ~0.75 mi
Loading nearby amenities…
Taxation est. · year 1
- Rental income
- $22,404
- − Mortgage interest
- −$10,643
- − Property taxes
- −$909
- − Insurance
- −$950
- − Repairs & maintenance
- −$1,792
- − Management
- −$1,792
- − Depreciation
- −$5,527
- Taxable income
- $790
- Est. tax owed @ 24.0%
- −$190
- After-tax cash flow
- $3,694/yr
For passive investors: Depreciation is non-cash, so a rental often shows a tax loss while cash-flowing — sheltering income. Rental losses are passive: they offset passive income freely, and up to $25,000/yr can offset ordinary (W-2) income if you actively participate and your MAGI is under $100k (phasing out to $0 by $150k); unused losses carry forward. On sale, claimed depreciation is recaptured at up to 25%, and gains may owe capital-gains tax (a 1031 exchange can defer both). Figures are a year-1 estimate at your 24.0% rate — not tax advice; consult a CPA.
Schools (NCES district)
- District
- Independence 30
- NCES district ID
- 2915480
- Math proficiency
- 26% ▼ -8.00%
- Reading proficiency
- 38% ▼ -5.00%
- Median HH income
- $41,843
- Composite
- 27.04/100
- National rank
- #7054
- State rank
- #252 of 324 in MO
Livability — Independence
- Score
- 82/100
- State rank
- #10
- US rank
- #1296
Category grades
Schools grade is shown separately in the Schools card above.
Census & demographics
- Census place
- Independence, MO
- County
- Jackson County · 687,798 people
- City population
- 117,675
- Metro
- Kansas City, MO-KS
- Population (ZIP)
- 6,775
- Household income
- $47,285
- Rent vs Own
- Severe rent burden
- 330.0
Population outlook (Jackson County) Hauer SSP2
- Today (2025)
- 719,589 people
- By 2030
- 731,456 · +1.6%
- By 2040
- 746,689 · +3.8%
- By 2050
- 749,289 · +4.1%
- By 2075
- 736,227 · +2.3%
- By 2100
- 668,210 · -7.1%
Race, ethnicity, and origin ACS 2023
- Neighborhood character
- Diverse neighborhood (Simpson 0.57)
- Race & ethnicity
- White 59% Hispanic / Latino 28% Two or more races 14% Black 9% Native American 3%
- Hispanic origin (detail)
- Mexican 25%
- Common ancestry
- Italian 12% Lithuanian 3% Slovak 1%
- Foreign-born
- 12% · Canada, China
- Languages at home
- 78% English-only · Spanish 21%
Political lean MEDSL · Jackson
- 2024 margin
- D (+19.3) · D 58.9% · R 39.5% · Other 1.6%
- 2008→2024 swing
- -6.1pp toward R · 2008: 25.4pp · 2024: 19.3pp
- All cycles
- 2024: D+19.3 2020: D+22.0 2016: D+16.6 2012: D+19.0 2008: D+25.4
Not yet ingested
- Civics
- —
Market trends
- HPI YoY
- ▲ 52.69%
- Current HPI
- 347.9512
- Rent YoY
- —
- Metro
- Kansas City, MO-KS
- State GDP YoY
- ▲ 1.84%
- F500 in state
- 20
Industry mix (Fortune 500 HQ in MO)
| Industry | F500 HQs | Revenue |
|---|---|---|
| Healthcare | 1 | $163B |
|
||
| Insurance | 1 | $21B |
|
||
| Industrial Technology | 1 | $17B |
|
||
| Retail | 1 | $16B |
|
||
| Industrial Distribution | 1 | $10B |
|
||
| Utilities | 1 | $9B |
|
||
Price history
+222.0% since first listed16 events — show timeline
- 2026-03-28 Price Changed $190,000 Heartland MLS as Distributed by MLS Grid
- 2026-01-31 Listed $195,000 Heartland MLS as Distributed by MLS Grid
- 2023-07-21 Sold (MLS) — Heartland MLS as Distributed by MLS Grid
- 2023-07-06 Pending — Heartland MLS as Distributed by MLS Grid
- 2023-07-06 Relisted — Heartland MLS as Distributed by MLS Grid
- 2023-06-28 Listing Removed — Heartland MLS as Distributed by MLS Grid
- 2023-06-12 Relisted — Heartland MLS as Distributed by MLS Grid
- 2023-06-12 Price Changed $80,000 Heartland MLS as Distributed by MLS Grid
- 2023-06-03 Pending — Heartland MLS as Distributed by MLS Grid
- 2023-05-23 Relisted — Heartland MLS as Distributed by MLS Grid
- 2023-05-21 Pending — Heartland MLS as Distributed by MLS Grid
- 2023-05-15 Listed $124,000 Heartland MLS as Distributed by MLS Grid
- 2001-11-30 Sold (Public Records) — Public Records
- 2001-11-28 Sold (MLS) — Heartland MLS as Distributed by MLS Grid
- 2001-08-10 Listed $59,000 Heartland MLS as Distributed by MLS Grid
- 1997-06-16 Sold (Public Records) — Public Records
Property tax history
+1.9%/yrLatest (2015): $909 · +1.9% YoY. Source: county tax records.
Cash-flow waterfall
monthlySold comps — $/sqft
last 12 mo · ≤1 miLoading sold comps…