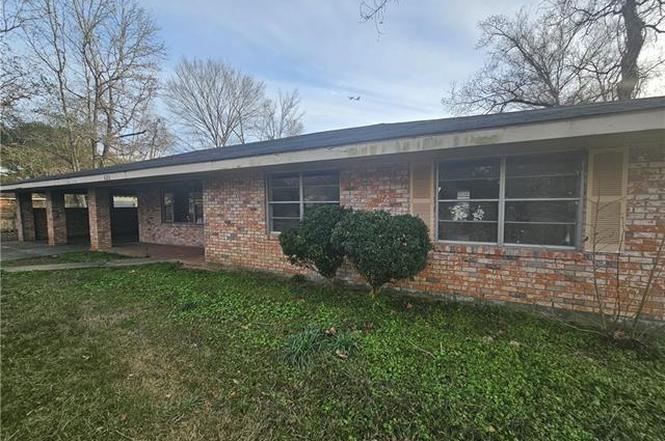
682 Martin Luther King Dr · Marksville, LA
Flood risk 1/10 · Minimal
- FEMA flood zone
- X
- Chance of flooding over 30 yrs
- 0.0%
- Est. flood insurance / yr
- $507 – $1,088
Fire risk 2/10 · Minimal
- Est. fire insurance / yr
- $1,269 – $2,357
Heat risk 8/10 · Major
- Hot days now (above 111°F)
- 7 days/yr
- Hot days in 30 yrs
- 19 days/yr
Wind risk 8/10 · Major
- Chance of severe wind over 30 yrs
- 99.0%
Air-quality risk 1/10 · Minimal
- Unhealthy air days now
- 0 days/yr
- Unhealthy air days in 30 yrs
- 0 days/yr
Risk factors via First Street. Map © Google.
Why this score? — see what drove the C grade
The composite is a weighted blend of 9 inputs, each scored 0–100. Each bar is that input's sub-score; the figure is the points it added to the 100-point composite (weight × sub-score).
- Cash flow +30.0/30.0
- 1% rule +10.0/10.0
- DSCR +10.0/10.0
- Livability +2.6/5.0
- Rent growth +2.5/5.0
- Condition / age +2.5/5.0
- Schools +2.1/10.0
- ARV discount +0.0/15.0
- Appreciation +0.0/10.0
$59,900
🖨 Deal sheet 📄 Offer letter ✓ Due diligence
Listing remarks
INVESTOR DEAL , THIS IS A GREAT RENTAL OR FLIP PROPERTY 4 BED 2 BATH DOUBLE CARPORT FIREPLACE 2 LIVING AREAS FIREPLACE FENCED YARD BRICK ON SLAB . .. HOUSE NEEDS TLC BUT HAS GOOD BONES !
Key facts
- Fenced yard
- Brick on slab
- Double carport
Tags
Property features AI
Exterior
- Parking: Carport
- Home design: Single family residence
- Construction: Composition roof
- Exterior features: Chain link fencing; Other fencing
Interior
- Bedrooms: Bedroom 1; Bedroom 2; Bedroom 3; Bedroom 4
- Bathrooms: 2 full bathrooms
- Heating & cooling: Wood burning fireplace
- Interior features: Den; Living room
Neighborhood map
What this means for you Summary
Snapshot
- This is a 4-bed/2.0-bath single-family listed at $60k.
Deal economics
- At list price, monthly cash flow is $676 ($8k/yr) — positive.
- The deal already cash-flows at list — no discount required.
- Meets the 1% rule at list price ($1k rent vs $60k).
- Recommended offer: $53k (12.0% below list) — sets the bar for market timing.
- Cap rate 19.8% vs local median 6.5% in Marksville — top-decile yield for the area; either an underpriced asset or a hidden risk that comps aren't pricing in. Stress-test before assuming the spread holds.
Location & tenants
- Location reads 52/100 on livability (#415 in LA) — a working-class tenant base; expect higher turnover. Strengths: cost of living A+; Watch: health & safety C-, schools D, crime F.
- Avoyelles Parish (rural): math 22% / reading 30% proficiency, ranked #56 of 98 in LA (top 57%) — low school quality limits family demand, transient renter base, plan for 1-2y turnover; 75% free/reduced lunch — lower-income household profile, screen leases tightly.
- Market conditions: 75 active listings in the ZIP; 15 units permitted in Avoyelles Parish in 2024 (0 in 5+ unit buildings).
Forward outlook
- Local home prices are declining (-3.0%/yr); year-one equity from $414 of loan paydown is wiped out by about $2k of value loss. Plan a longer hold.
- Avoyelles County population projected at -18% by 2050 — secular population decline; favor cash flow + early exit over multi-decade hold.
- At projected returns (-3.0% appreciation + 3.0% rent growth), your $17k cash investment doubles in ~3 years — after that, you're playing with house money.
Negotiation context
- It's been on market 140 days — a 12% lower offer ($53k) is reasonable based on typical stale-listing flexibility.
- 3 sale attempts since 18y ago with the ask held roughly flat each time — persistent listings suggest the price (not the market) is what's stuck; bring a comps-based counter.
Risks & watch-outs
- Climate carrying-cost: severe wind risk, 99% chance of damaging wind over 30y; extreme-heat days projected 7→19/yr by 2055 (HVAC capex compounding) — expect insurance premiums to compound above CPI over the hold.
Questions for the listing agent
- It's been on market 140 days. Have you received any prior offers? Is the seller open to a 12% concession, seller financing, or rate buy-down credit?
- Why hasn't it sold? Are there any deal-killer items the seller is aware of (foundation, flood, title, zoning, code violations)?
- Is there a deadline driving the sale (1031 exchange, divorce, estate, relocation)? That informs how much negotiation room exists.
- Schools are D-rated, which usually means shorter tenancies and higher turnover. Who's the typical renter profile here, and what's been the actual vacancy rate?
- Crime grade is F in this area — have there been break-ins, vandalism, or insurance claims at this property in the last 3 years? What carrier currently insures it and at what premium?
- What's the average days-on-market for RENTAL listings here right now (not sales)? A rising rental-DOM trend means longer vacancies and softer asking-rent achievability than the comps imply.
- What's the recent tenant-quality profile in this submarket — average credit score on applications, eviction rate, late-payment / NSF rate, and stable-employment percentage? A property-management company in the area should have these aggregated.
- How much new for-sale + rental construction is in the pipeline within 1–3 miles? Heavy new supply typically softens prices + rents 12–24 months out; constrained supply supports both.
Investment metrics
- 1% rule
- 2.20% ✓
- Cap rate
- 19.85%
- Cash-on-cash
- 48.40%
- DSCR
- 3.15
- GRM
- 3.8
CMA / ARV
- ARV (on-the-fly)
- $49,525
- Comps found
- 1
Show comp detail 1 sale within ~0.75 mi
| Address | Dist | Beds/Ba | Sqft | Sold | Price | $/sf | Match |
|---|---|---|---|---|---|---|---|
| 148 & 146 Laurel St | 0.68mi | 3/2.0 (-1) | 2,161 (+9%) | 3mo | $55,000 | $25 | 46 |
Match score weights: distance 35% · size 25% · config 20% · recency 20%. Top-matched comps best support the ARV.
Projected returns pro-forma
-3.0% appreciation · 3.0% rent growth · sell at horizon
- IRR
- 45.9%
- Equity multiple
- 2.99×
- Total profit
- $33,367
- Equity at exit
- $8,931
- IRR
- 51.7%
- Equity multiple
- 6.04×
- Total profit
- $84,488
- Equity at exit
- $5,179
Cash invested: $16,772 (down + closing). Projections, not guarantees.
Landlord ↔ Tenant lean methodology
- Overall (STATE)
- 90 Strongly Landlord-Friendly
- State Louisiana
- 90 Strongly Landlord-Friendly · R+12
- County
- — inherits STATE
- City
- — inherits STATE
ZIP-level market 71351
- Active inventory
- 75
- Price-to-rent
- 3.8×
Monthly cashflow live
- Estimated rent
- $1,316 medium interval (Pro) →
- Mortgage (P&I)
- −$314
- Tax from tax record
- −$24 /mo · $286/yr
- Insurance
- −$25
- HOA
- −$0
- Vacancy / Maint / Mgmt
- −$276
- Net cashflow
- $676
Break-even live
UW: 25.0% down · 7.5% · 30yr · 1.5% tax · 5.0% vac · 8.0% maint · 8.0% mgmt
Financing live
Cash to close
- Down payment
- $14,975
- Closing costs
- $1,797
- Reserves months
- —
- Total cash needed
- —
Loan-product check · same deal, 3 products live
Conventional
25% down · 7.5% · 30yr
- Down + closing
- —
- Monthly P&I
- —
- Monthly cashflow
- —
- DSCR
- —
- Eligible?
- —
Personal DTI + credit; lowest rate.
DSCR
20% down · 8.5% · 30yr
- Down + closing
- —
- Monthly P&I
- —
- Monthly cashflow
- —
- DSCR
- —
- Eligible?
- —
No personal income docs; deal must DSCR.
Hard money
10% down · 12.0% · 12mo
- Down + closing
- —
- Monthly P&I
- —
- Monthly cashflow
- —
- DSCR
- —
- Eligible?
- —
Short-term bridge; refi at stabilization.
Listing history 21 events
-
2026-06-19days on market $59,900 Active 140 DOM
-
2026-06-18days on market $59,900 Active 139 DOM
-
2026-06-17days on market $59,900 Active 138 DOM
-
2026-06-16days on market $59,900 Active 137 DOM
-
2026-06-15days on market $59,900 Active 136 DOM
-
2026-06-14days on market $59,900 Active 134 DOM
-
2026-06-13days on market $59,900 Active 133 DOM
-
2026-06-10days on market $59,900 Active 131 DOM
-
2026-06-09days on market $59,900 Active 130 DOM
-
2026-06-08days on market $59,900 Active 129 DOM
-
2026-06-07days on market $59,900 Active 128 DOM
-
2026-06-03days on market $59,900 Active 124 DOM
-
2026-06-02days on market $59,900 Active 123 DOM
-
2026-06-01days on market $59,900 Active 122 DOM
-
2026-05-31days on market $59,900 Active 121 DOM
-
2026-05-30days on market $59,900 Active 120 DOM
-
2026-01-28$59,900 Active
-
2022-05-20$80,000
-
2021-11-22soldstatus $700,000
-
2009-02-17soldstatus $84,500
-
2008-12-15$85,000
ⓘ Source: listings_history table (triggers on properties + properties_extension) + one-shot
backfill from property_details.listing_events for pre-trigger history.
Tax reassessment forecast LA · Resets to sale price
- Current annual tax
- $286 · $24/mo
- Projected year-2 tax
- $329 · $27/mo
- Expected delta
- +$44/yr (+$4/mo · 15.4%)
ⓘ Screening estimate from a state-policy table — verify with the county assessor before closing.
Climate risk First Street
- Flood 1/10 Low FEMA zone X · 0% chance over 30 yrs
- Wildfire 2/10 Low
- Heat 8/10 Severe 7 d/yr ≥111°F today · 19 d/yr by 30 yrs out
- Wind 8/10 Severe 99% chance of damaging wind over 30 yrs
- Air quality 1/10 Low 0 unhealthy d/yr today · 0 by 30 yrs out
Nearby sold comps map
Loading sold comps map…
Walkable amenities ~0.75 mi
Loading nearby amenities…
Taxation est. · year 1
- Rental income
- $15,788
- − Mortgage interest
- −$3,355
- − Property taxes
- −$286
- − Insurance
- −$300
- − Repairs & maintenance
- −$1,263
- − Management
- −$1,263
- − Depreciation
- −$1,743
- Taxable income
- $7,579
- Est. tax owed @ 24.0%
- −$1,819
- After-tax cash flow
- $6,299/yr
For passive investors: Depreciation is non-cash, so a rental often shows a tax loss while cash-flowing — sheltering income. Rental losses are passive: they offset passive income freely, and up to $25,000/yr can offset ordinary (W-2) income if you actively participate and your MAGI is under $100k (phasing out to $0 by $150k); unused losses carry forward. On sale, claimed depreciation is recaptured at up to 25%, and gains may owe capital-gains tax (a 1031 exchange can defer both). Figures are a year-1 estimate at your 24.0% rate — not tax advice; consult a CPA.
Schools (NCES district)
- District
- Avoyelles Parish
- NCES district ID
- 2200150
- Math proficiency
- 22% ▼ -32.00%
- Reading proficiency
- 30% ▼ -29.00%
- Median HH income
- $33,891
- Composite
- 21.32/100
- National rank
- #8378
- State rank
- #56 of 98 in LA
Livability — Marksville
- Score
- 52/100
- State rank
- #415
- US rank
- #25114
Category grades
Schools grade is shown separately in the Schools card above.
Census & demographics
- Census place
- Marksville, LA
- Population (ZIP)
- 11,494
Population outlook (Avoyelles County) Hauer SSP2
- Today (2025)
- 39,084 people
- By 2030
- 37,784 · -3.3%
- By 2040
- 35,049 · -10.3%
- By 2050
- 32,225 · -17.5%
- By 2075
- 25,695 · -34.3%
- By 2100
- 18,985 · -51.4%
Race, ethnicity, and origin ACS 2023
- Neighborhood character
- Majority White (62%)
- Race & ethnicity
- White 62% Black 25% Two or more races 8% Hispanic / Latino 2% Native American 2% Asian 1%
- Common ancestry
- Lithuanian 22% Iranian 1%
- Foreign-born
- 2% · Canada, China, Vietnam
- Languages at home
- 91% English-only · French/Haitian/Cajun 7% Spanish 1% Chinese 1%
Political lean MEDSL · Avoyelles
- 2024 margin
- Solid R (+43.1) · D 27.8% · R 71.0% · Other 1.2%
- 2008→2024 swing
- -20.1pp toward R · 2008: -23.1pp · 2024: -43.1pp
- All cycles
- 2024: R+43.1 2020: R+40.8 2016: R+37.0 2012: R+27.0 2008: R+23.1
Not yet ingested
- Civics
- —
Market trends
- HPI YoY
- ▼ -66.16%
- Current HPI
- 95.5318
- Rent YoY
- —
- Metro
- —
- State GDP YoY
- ▲ 3.29%
- F500 in state
- 10
Industry mix (Fortune 500 HQ in LA)
| Industry | F500 HQs | Revenue |
|---|---|---|
| Telecommunications | 2 | $23B |
|
||
| Utilities | 1 | $12B |
|
||
| Wholesale / Distribution | 1 | $5B |
|
||
| Advertising | 1 | $2B |
|
||
Price history
-29.5% since first listed5 events — show timeline
- 2026-01-28 Listed $59,900 AcadianaMLS
- 2022-05-20 Listed $80,000 AcadianaMLS
- 2021-11-22 Sold (Public Records) $700,000 Public Records
- 2009-02-17 Sold (Public Records) $84,500 Public Records
- 2008-12-15 Listed $85,000 AcadianaMLS
Property tax history
-4.7%/yrLatest (2025): $286 · +0.0% YoY. Source: county tax records.
Cash-flow waterfall
monthlySold comps — $/sqft
last 12 mo · ≤1 miLoading sold comps…