7265 Chasewood Dr · Houston, TX
Flood risk 1/10 · Minimal
- FEMA flood zone
- X (unshaded)
- Chance of flooding over 30 yrs
- 0.0%
- Est. flood insurance / yr
- $507 – $1,088
Fire risk 3/10 · Minor
- Est. fire insurance / yr
- $1,222 – $2,270
Heat risk 9/10 · Severe
- Hot days now (above 110°F)
- 7 days/yr
- Hot days in 30 yrs
- 23 days/yr
Wind risk 9/10 · Severe
- Chance of severe wind over 30 yrs
- 99.0%
Air-quality risk 3/10 · Minor
- Unhealthy air days now
- 2 days/yr
- Unhealthy air days in 30 yrs
- 3 days/yr
Risk factors via First Street. Map © Google.
Why this score? — see what drove the C grade
The composite is a weighted blend of 9 inputs, each scored 0–100. Each bar is that input's sub-score; the figure is the points it added to the 100-point composite (weight × sub-score).
- Cash flow +23.6/30.0
- 1% rule +8.7/10.0
- DSCR +7.6/10.0
- Appreciation +4.7/10.0
- Schools +4.5/10.0
- Livability +3.7/5.0
- Rent growth +2.6/5.0
- Condition / age +2.5/5.0
- ARV discount +0.0/15.0
$119,000
🖨 Deal sheet 📄 Offer letter ✓ Due diligence
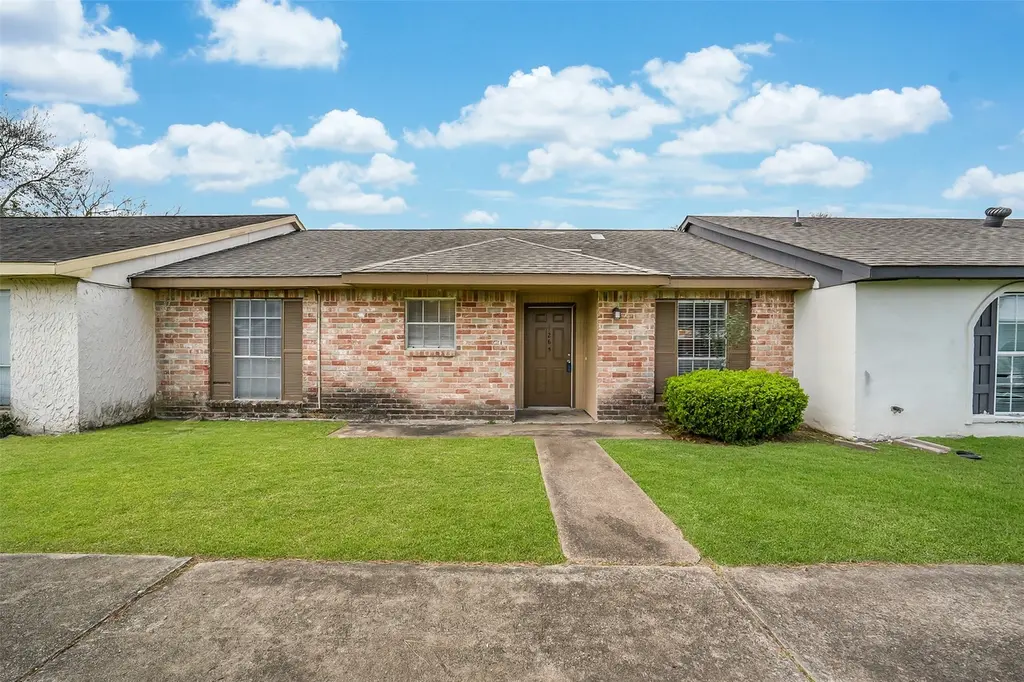
Listing remarks MLS
Move-In Ready 2 bedroom, 2 bathroom townhome in the Chasewood community in Missouri City! Located near the intersection of the Fort Bend Parkway and Sam Houston Tollway, this single story bungalow offers 1,164 square feet of living space with durable tile flooring, charming exposed brick walls, and neutral grey paint throughout the family room with a corner set wood burning fireplace. A pass through serving bar connects to the light & bright kitchen with white cabinetry, granite countertops, a tile backsplash, and white appliances. Down the hall, find a secondary bedroom with an impressively sized closet and a hall bathroom, as well as the master suite with dual walk-in closets and an en suite bath. Also note the fenced backyard for privacy and the 2 car covered carport for parking. It's a must-see that won't last long!
Key facts
- Move-in ready
- Chasewood community
- Granite countertops
Tags
Neighborhood map
What this means for you Summary
Snapshot
- This is a 2-bed/2.0-bath single-family listed at $119k.
Deal economics
- At list price, monthly cash flow is $225 ($3k/yr) — positive.
- The deal already cash-flows at list — no discount required.
- Meets the 1% rule at list price ($2k rent vs $119k).
- Recommended offer: $108k (9.0% below list) — sets the bar for market timing.
- Cap rate 8.6% vs local median 3.2% in Houston — top-decile yield for the area; either an underpriced asset or a hidden risk that comps aren't pricing in. Stress-test before assuming the spread holds.
Location & tenants
- Location reads 74/100 on livability (#184 in TX, #4,771 nationally) — a middle-class / working-renter tenant base. Strengths: amenities A+, cost of living A+, housing A+; Watch: schools D, crime F.
- Fort Bend ISD (suburban): math 44% / reading 53% proficiency, ranked #140 of 826 in TX (top 17%) — families likely to look elsewhere, expect single-tenant / working-renter base with shorter leases.
- Market conditions: Rents flat; 186 active listings in the ZIP; 14 comparable units currently listed for rent nearby; rentals at typical pace (median 14d on market — plan ~3-4 weeks tenant-placement turnaround); 12,093 units permitted in Fort Bend County in 2024 (815 in 5+ unit buildings).
Forward outlook
- In year one you build about $167 of equity ($823 loan paydown + $-656 appreciation (-0.6% local appreciation)).
- Fort Bend County population projected at +75% by 2050 — long-run rental-demand tailwind backs the buy-and-hold thesis.
Negotiation context
- It's been on market 104 days — a 9% lower offer ($108k) is reasonable based on typical stale-listing flexibility.
Risks & watch-outs
- Climate carrying-cost: severe wind risk, 99% chance of damaging wind over 30y; extreme-heat days projected 7→23/yr by 2055 (HVAC capex compounding) — expect insurance premiums to compound above CPI over the hold.
Questions for the listing agent
- It's been on market 104 days. Have you received any prior offers? Is the seller open to a 9% concession, seller financing, or rate buy-down credit?
- Built in 1974 — when were the roof, HVAC, electrical panel, plumbing, and water heater last replaced?
- What does the HOA fee cover, when was the last increase, and are there any pending special assessments or reserve-fund shortfalls?
- Why hasn't it sold? Are there any deal-killer items the seller is aware of (foundation, flood, title, zoning, code violations)?
- Is there a deadline driving the sale (1031 exchange, divorce, estate, relocation)? That informs how much negotiation room exists.
- Schools are D-rated, which usually means shorter tenancies and higher turnover. Who's the typical renter profile here, and what's been the actual vacancy rate?
- Crime grade is F in this area — have there been break-ins, vandalism, or insurance claims at this property in the last 3 years? What carrier currently insures it and at what premium?
- What's the average days-on-market for RENTAL listings here right now (not sales)? A rising rental-DOM trend means longer vacancies and softer asking-rent achievability than the comps imply.
- What's the recent tenant-quality profile in this submarket — average credit score on applications, eviction rate, late-payment / NSF rate, and stable-employment percentage? A property-management company in the area should have these aggregated.
- How much new for-sale + rental construction is in the pipeline within 1–3 miles? Heavy new supply typically softens prices + rents 12–24 months out; constrained supply supports both.
Investment metrics
- 1% rule
- 1.37% ✓
- Cap rate
- 8.56%
- Cash-on-cash
- 8.10%
- DSCR
- 1.36
- GRM
- 6.1
CMA / ARV
- ARV (median comp)
- $97,718
- List price
- $119,000
- Delta
- 21.78%
- Verdict
- OVERPRICED
- Comps
- 20 within 1.0 mi
Show comp detail 5 sales within ~0.75 mi
| Address | Dist | Beds/Ba | Sqft | Sold | Price | $/sf | Match |
|---|---|---|---|---|---|---|---|
| 6913 Chasewood Dr | 0.11mi | 3/2.0 (+1) | 1,312 (+13%) | 4mo | $99,000 | $75 | 65 |
| 15405 Nickel Dr | 0.58mi | 3/2.0 (+1) | 1,123 (-4%) | 13mo | $165,000 | $147 | 52 |
| 7610 Goudin Dr | 0.43mi | 3/2.5 (+1) | 1,303 (+12%) | 6mo | $220,000 | $169 | 48 |
| 7319 Bahia Ln | 0.33mi | 3/2.0 (+1) | 1,323 (+14%) | 22mo | $199,500 | $151 | 38 |
| 6631 Indian Falls Dr | 0.73mi | 3/2.0 (+1) | 1,310 (+12%) | 8mo | $191,500 | $146 | 33 |
Match score weights: distance 35% · size 25% · config 20% · recency 20%. Top-matched comps best support the ARV.
Projected returns pro-forma
-0.55% appreciation · 0.34% rent growth · sell at horizon
- IRR
- 2.5%
- Equity multiple
- 1.11×
- Total profit
- $3,717
- Equity at exit
- $31,311
- IRR
- 5.9%
- Equity multiple
- 1.54×
- Total profit
- $18,112
- Equity at exit
- $35,138
Cash invested: $33,320 (down + closing). Projections, not guarantees.
Landlord ↔ Tenant lean methodology
- Overall (STATE)
- 87 Strongly Landlord-Friendly
- State Texas
- 87 Strongly Landlord-Friendly · R+5
- County
- — inherits STATE
- City
- — inherits STATE
ZIP-level market 77489
- Home prices YoY
- -0.2%
- Rents YoY
- 0.3%
- Active inventory
- 186
- Price-to-rent
- 6.1×
Monthly cashflow live
- Estimated rent
- $1,628 high interval (Pro) →
- Mortgage (P&I)
- −$624
- Tax from tax record
- −$159 /mo · $1,913/yr
- Insurance
- −$50
- HOA
- −$228
- Vacancy / Maint / Mgmt
- −$342
- Net cashflow
- $225
Break-even live
UW: 25.0% down · 7.5% · 30yr · 1.5% tax · 5.0% vac · 8.0% maint · 8.0% mgmt
Financing live
Cash to close
- Down payment
- $29,750
- Closing costs
- $3,570
- Reserves months
- —
- Total cash needed
- —
Loan-product check · same deal, 3 products live
Conventional
25% down · 7.5% · 30yr
- Down + closing
- —
- Monthly P&I
- —
- Monthly cashflow
- —
- DSCR
- —
- Eligible?
- —
Personal DTI + credit; lowest rate.
DSCR
20% down · 8.5% · 30yr
- Down + closing
- —
- Monthly P&I
- —
- Monthly cashflow
- —
- DSCR
- —
- Eligible?
- —
No personal income docs; deal must DSCR.
Hard money
10% down · 12.0% · 12mo
- Down + closing
- —
- Monthly P&I
- —
- Monthly cashflow
- —
- DSCR
- —
- Eligible?
- —
Short-term bridge; refi at stabilization.
Rent comps 14 comps
| Address | Beds | Baths | Sqft | Rent | $/sqft | DOM | Units | Dist |
|---|---|---|---|---|---|---|---|---|
| 15703 Baybriar Dr Missouri City, TX | 3.0 | 2.0 | 1252 | $1,615 | $1.29 | 20d | 1 | 0.73mi |
| 15823 Baybriar Dr Missouri City, TX | 3.0 | 2.0 | 1335 | $1,641 | $1.23 | 5d | 1 | 0.88mi |
| 13960 Hillcroft St Unit 321 Houston, TX | 1.0 | 1.0 | 1017 | $1,310 | $1.29 | 8d | 1 | 0.89mi |
| 13960 Hillcroft St Unit 13981 Houston, TX | 1.0 | 1.0 | 1017 | $1,340 | $1.32 | 44d | 1 | 0.89mi |
| 13960 Hillcroft St Unit 1174 Houston, TX | 1.0 | 1.0 | 1017 | $1,350 | $1.33 | 11d | 1 | 0.89mi |
| 13960 Hillcroft St Unit 425 Houston, TX | 2.0 | 2.0 | 1332 | $1,540 | $1.16 | 8d | 1 | 0.89mi |
| 13960 Hillcroft St Unit 2174 Houston, TX | 2.0 | 2.0 | 1332 | $1,532 | $1.15 | 3d | 1 | 0.89mi |
| 13960 Hillcroft St Unit 13975 Houston, TX | 1.0 | 1.0 | 1017 | $1,307 | $1.29 | 3d | 1 | 0.89mi |
| 13960 Hillcroft St Unit 14017 Houston, TX | 2.0 | 2.0 | 1332 | $1,540 | $1.16 | 16d | 1 | 0.89mi |
| 13960 Hillcroft St Unit 13975 Houston, TX | 1.0 | 1.0 | 1017 | $1,345 | $1.32 | 14d | 1 | 0.89mi |
| 13939 Hillcroft Ave Unit 13972 Houston, TX | 3.0 | 2.0 | 1404 | $2,164 | $1.54 | 21d | 1 | 1.08mi |
| 13939 Hillcroft Ave Unit 13976 Houston, TX | 2.0 | 2.0 | 1089 | $1,703 | $1.56 | 21d | 1 | 1.08mi |
| 13939 Hillcroft Ave Houston, TX | 1.0–3.0 | 1.0–2.0 | 985 | $1,778 | $1.80 | 3d | 22 | 1.08mi |
| 16211 Corsair Rd Houston, TX | 3.0 | 2.0 | 1139 | $1,813 | $1.59 | 24d | 1 | 1.34mi |
HOA detail
- Monthly dues
- $228 · $2,736/yr
Listing history 13 events
-
2026-06-18days on market $119,000 Active 104 DOM
-
2026-06-17days on market $119,000 Active 103 DOM
-
2026-06-16days on market $119,000 Active 102 DOM
-
2026-06-15days on market $119,000 Active 101 DOM
-
2026-06-13days on market $119,000 Active 99 DOM
-
2026-06-09days on market $119,000 Active 95 DOM
-
2026-06-07days on market $119,000 Active 93 DOM
-
2026-06-04days on market $119,000 Active 90 DOM
-
2026-06-03days on market $119,000 Active 89 DOM
-
2026-06-02days on market $119,000 Active 88 DOM
-
2026-06-01days on market $119,000 Active 87 DOM
-
2026-05-31days on market $119,000 Active 86 DOM
-
2026-03-06$119,000 Active 835-char remark
Show marketing remark (835 chars)
Move-In Ready 2 bedroom, 2 bathroom townhome in the Chasewood community in Missouri City! Located near the intersection of the Fort Bend Parkway and Sam Houston Tollway, this single story bungalow offers 1,164 square feet of living space with durable tile flooring, charming exposed brick walls, and neutral grey paint throughout the family room with a corner set wood burning fireplace. A pass through serving bar connects to the light & bright kitchen with white cabinetry, granite countertops, a tile backsplash, and white appliances. Down the hall, find a secondary bedroom with an impressively sized closet and a hall bathroom, as well as the master suite with dual walk-in closets and an en suite bath. Also note the fenced backyard for privacy and the 2 car covered carport for parking. It's a must-see that won't last long!
ⓘ Source: listings_history table (triggers on properties + properties_extension) + one-shot
backfill from property_details.listing_events for pre-trigger history.
Tax reassessment forecast TX · Resets to sale price
- Current annual tax
- $1,913 · $159/mo
- Projected year-2 tax
- $2,178 · $181/mo
- Expected delta
- +$265/yr (+$22/mo · 13.9%)
ⓘ Screening estimate from a state-policy table — verify with the county assessor before closing.
Climate risk First Street
- Flood 1/10 Low FEMA zone X (unshaded) · 0% chance over 30 yrs
- Wildfire 3/10 Moderate
- Heat 9/10 Extreme 7 d/yr ≥110°F today · 23 d/yr by 30 yrs out
- Wind 9/10 Extreme 99% chance of damaging wind over 30 yrs
- Air quality 3/10 Moderate 2 unhealthy d/yr today · 3 by 30 yrs out
Nearby sold comps map
Loading sold comps map…
Walkable amenities ~0.75 mi
Loading nearby amenities…
Taxation est. · year 1
- Rental income
- $19,532
- − Mortgage interest
- −$6,666
- − Property taxes
- −$1,913
- − Insurance
- −$595
- − Repairs & maintenance
- −$1,563
- − Management
- −$1,563
- − HOA
- −$2,736
- − Depreciation
- −$3,462
- Taxable income
- $1,035
- Est. tax owed @ 24.0%
- −$248
- After-tax cash flow
- $2,449/yr
For passive investors: Depreciation is non-cash, so a rental often shows a tax loss while cash-flowing — sheltering income. Rental losses are passive: they offset passive income freely, and up to $25,000/yr can offset ordinary (W-2) income if you actively participate and your MAGI is under $100k (phasing out to $0 by $150k); unused losses carry forward. On sale, claimed depreciation is recaptured at up to 25%, and gains may owe capital-gains tax (a 1031 exchange can defer both). Figures are a year-1 estimate at your 24.0% rate — not tax advice; consult a CPA.
Schools (NCES district)
- District
- Fort Bend ISD
- NCES district ID
- 4819650
- Math proficiency
- 44% ▼ -15.00%
- Reading proficiency
- 53% ▼ -4.00%
- Median HH income
- $82,360
- Composite
- 44.61/100
- National rank
- #2779
- State rank
- #140 of 826 in TX
Livability — Houston
- Score
- 74/100
- State rank
- #184
- US rank
- #4771
Category grades
Schools grade is shown separately in the Schools card above.
Census & demographics
- Census place
- Houston, TX
- County
- Fort Bend County · 836,777 people
- City population
- 3,226,434
- Metro
- Houston-The Woodlands-Sugar Land, TX
- Population (ZIP)
- 39,292
- Household income
- $74,689
- Rent vs Own
- Severe rent burden
- 1121.0
Population outlook (Fort Bend County) Hauer SSP2
- Today (2025)
- 1,004,526 people
- By 2030
- 1,153,104 · +14.8%
- By 2040
- 1,453,718 · +44.7%
- By 2050
- 1,753,781 · +74.6%
- By 2075
- 2,455,772 · +144.5%
- By 2100
- 2,930,528 · +191.7%
Race, ethnicity, and origin ACS 2023
- Neighborhood character
- Majority Black (60%)
- Race & ethnicity
- Black 60% Hispanic / Latino 29% Two or more races 13% White 4% Asian 3%
- Hispanic origin (detail)
- Mexican 17%
- Foreign-born
- 16% · Canada, Vietnam
- Languages at home
- 73% English-only · Spanish 22% Vietnamese 1% Other Asian/Pacific 1%
Political lean MEDSL · Fort Bend
- 2024 margin
- Toss-up / Even · D 49.5% · R 47.9% · Other 2.6%
- 2008→2024 swing
- +4.0pp toward D · 2008: -2.4pp · 2024: 1.6pp
- All cycles
- 2024: D+1.6 2020: D+10.6 2016: D+6.6 2012: R+6.8 2008: R+2.4
Not yet ingested
- Civics
- —
Market trends
- HPI YoY
- ▼ -0.55%
- Current HPI
- 288.1306
- Rent YoY
- ▲ 0.34%
- Metro
- Houston-The Woodlands-Sugar Land, TX
- State GDP YoY
- ▲ 3.95%
- F500 in state
- 110
Industry mix (Fortune 500 HQ in TX)
| Industry | F500 HQs | Revenue |
|---|---|---|
| Energy | 16 | $1,198B |
|
||
| Technology | 5 | $198B |
|
||
| Engineering / Construction | 4 | $72B |
|
||
| Energy Services | 3 | $60B |
|
||
| Utilities | 3 | $41B |
|
||
| Healthcare | 2 | $330B |
|
||
Price history
1 event — show timeline
- 2026-03-06 Listed $119,000 HARMLS
Property tax history
+5.4%/yrLatest (2025): $1,913 · +2.7% YoY. Source: county tax records.
Cash-flow waterfall
monthlySold comps — $/sqft
last 12 mo · ≤1 miLoading sold comps…