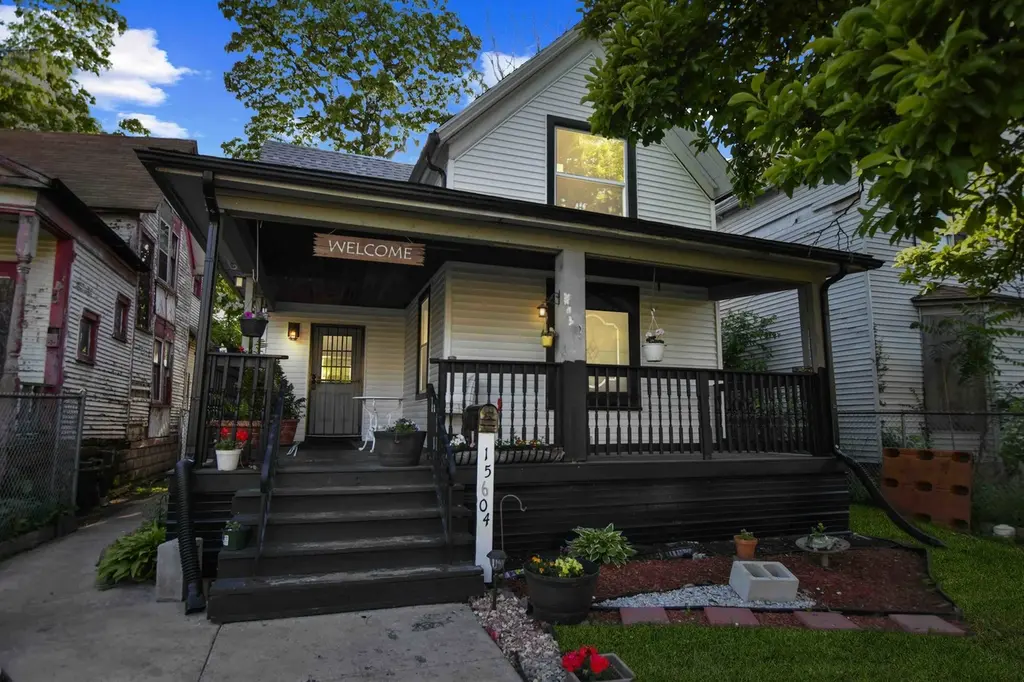
15604 Loomis Ave · Harvey, IL
Flood risk 1/10 · Minimal
- FEMA flood zone
- X (unshaded)
- Chance of flooding over 30 yrs
- 0.0%
- Est. flood insurance / yr
- $473 – $860
Fire risk 1/10 · Minimal
- Est. fire insurance / yr
- $804 – $1,492
Heat risk 3/10 · Minor
- Hot days now (above 102°F)
- 7 days/yr
- Hot days in 30 yrs
- 15 days/yr
Wind risk 2/10 · Minimal
- Chance of severe wind over 30 yrs
- —
Air-quality risk 3/10 · Minor
- Unhealthy air days now
- 4 days/yr
- Unhealthy air days in 30 yrs
- 4 days/yr
Risk factors via First Street. Map © Google.
Why this score? — see what drove the C+ grade
The composite is a weighted blend of 9 inputs, each scored 0–100. Each bar is that input's sub-score; the figure is the points it added to the 100-point composite (weight × sub-score).
- Cash flow +26.5/30.0
- Appreciation +10.0/10.0
- DSCR +9.0/10.0
- 1% rule +6.2/10.0
- Livability +3.4/5.0
- Rent growth +2.5/5.0
- Condition / age +2.5/5.0
- Schools +0.7/10.0
- ARV discount +0.0/15.0
$170,000
🖨 Deal sheet 📄 Offer letter ✓ Due diligence
Listing remarks MLS
Investor's and Rehabber's Dream: Victorian Charm Await Your Vision. Embrace the opportunity to restore this historic 2-story Victorian to its former grandeur! This property, in need of extensive rehab, offers a nostalgic charm with its expansive wrap-around porch. Step inside to discover a main level featuring a formal dining area, a spacious living room, an L-shaped kitchen, and a versatile bedroom or den. Upstairs, you'll find two additional bedrooms, complemented by a lofty area. The unfinished basement provides ample storage space. Sold as-is, the price reflects the property's current condition-ideal for those ready to take on the challenge. Buyer to assume responsibility for any necessary city repairs and escrows. Don't miss out on the chance to revitalize this 'neglected' gem into a true masterpiece. Schedule your showing today!
Key facts
- Updated electrical
- New kitchen
- Furnace installed
Tags
Property features AI
Finance
- Other: Property is not currently leased; Possession is negotiable
- HOA & community: No master association fee required; Community features include curbs, sidewalks, street lights and paved streets
Exterior
- Parking: Off-alley parking
- Utilities: Water source: Lake Michigan; Public sewer
- Home design: Detached single-family home; Two-story model; Fee simple ownership; Property was rehabilitated in 2026; Over 100 years old (originally built prior to 1978)
- Construction: Frame construction; Asphalt roof; Not rebuilt
- Exterior features: Patio; Lot dimensions approximately 36 x 172; Lot is less than 0.25 acre; Curbs, sidewalks, street lights, and paved streets in the neighborhood
Interior
- Kitchen: Range; Microwave; Refrigerator; Eating area / table space
- Bedrooms: Master bedroom on second floor (13 x 13); Second bedroom on second floor (13 x 12) with blinds; Third bedroom on main level (13 x 10) with hardwood flooring; Loft on second floor (13 x 13)
- Flooring: Hardwood flooring in multiple main rooms
- Bathrooms: One full bathroom
- Heating & cooling: Natural gas forced-air heating
- Interior features: First-floor bedroom; Separate dining room; Unfinished full basement; Screens on windows; Seven total rooms
- Laundry & utility: Laundry room; Dryer; Gas water heater; CO detectors
Neighborhood map
What this means for you Summary
Snapshot
- This is a 3-bed/1.5-bath single-family listed at $170k.
Deal economics
- At list price, monthly cash flow is $450 ($5k/yr) — positive.
- The deal already cash-flows at list — no discount required.
- Meets the 1% rule at list price ($2k rent vs $170k).
Location & tenants
- Location reads 67/100 on livability (#539 in IL) — a middle-class / working-renter tenant base. Strengths: commute A+, cost of living A+, housing A-; Watch: health & safety D+, crime F, amenities F.
- Thornton Twp Hsd 205 (suburban): math 7% / reading 8% proficiency, ranked #594 of 620 in IL (top 96%) — low school quality limits family demand, transient renter base, plan for 1-2y turnover.
- Zoned schools: Thornton Township High School (math 7% / reading 7%, grade F, #605 of 693 statewide, top 87%, 1,628 students, 0% FRL).
- Market conditions: 134 active listings in the ZIP; 4 comparable units currently listed for rent nearby; rentals at typical pace (median 25d on market — plan ~3-4 weeks tenant-placement turnaround); 6,272 units permitted in Cook County in 2024 (4,658 in 5+ unit buildings).
Forward outlook
- In year one you build about $18k of equity ($1k loan paydown + $17k appreciation (10.0% local appreciation)).
- At projected returns (10.0% appreciation + 3.0% rent growth), your $48k cash investment doubles in ~2 years — after that, you're playing with house money.
- By year 3, paydown + projected appreciation supports a ~$46k cash-out refi (75% LTV) — recoverable capital for the next deal without selling this one.
Negotiation context
- Only 14 days on market — expect competitive offers; lowballing is unlikely to land.
- 3 sale attempts with the ask held roughly flat each time — persistent listings suggest the price (not the market) is what's stuck; bring a comps-based counter.
- Current owner paid $45k; list at $170k implies a 278% gain — meaningful room to come down on a strong offer.
Risks & watch-outs
- Watch-outs: built in 1897 — expect roof / HVAC / electrical / plumbing capex.
Questions for the listing agent
- Built in 1897 — when were the roof, HVAC, electrical panel, plumbing, and water heater last replaced?
- Is there a deadline driving the sale (1031 exchange, divorce, estate, relocation)? That informs how much negotiation room exists.
- Schools are F-rated, which usually means shorter tenancies and higher turnover. Who's the typical renter profile here, and what's been the actual vacancy rate?
- Crime grade is F in this area — have there been break-ins, vandalism, or insurance claims at this property in the last 3 years? What carrier currently insures it and at what premium?
- What's the average days-on-market for RENTAL listings here right now (not sales)? A rising rental-DOM trend means longer vacancies and softer asking-rent achievability than the comps imply.
- What's the recent tenant-quality profile in this submarket — average credit score on applications, eviction rate, late-payment / NSF rate, and stable-employment percentage? A property-management company in the area should have these aggregated.
- How much new for-sale + rental construction is in the pipeline within 1–3 miles? Heavy new supply typically softens prices + rents 12–24 months out; constrained supply supports both.
Investment metrics
- 1% rule
- 1.12% ✓
- Cap rate
- 9.47%
- Cash-on-cash
- 11.33%
- DSCR
- 1.50
- GRM
- 7.4
CMA / ARV
- ARV (on-the-fly)
- $140,937
- Comps found
- 12
Show comp detail 12 sales within ~0.75 mi
| Address | Dist | Beds/Ba | Sqft | Sold | Price | $/sf | Match |
|---|---|---|---|---|---|---|---|
| 15515 Marshfield Ave | 0.31mi | 3/1.0 | 1,247 (-4%) | 9mo | $135,000 | $108 | 70 |
| 15641 Paulina St | 0.36mi | 3/2.0 | 1,260 (-3%) | 11mo | $46,500 | $37 | 68 |
| 15726 Vine Ave | 0.24mi | 3/2.0 | 1,174 (-9%) | 10mo | $189,999 | $162 | 63 |
| 48 E 154th St | 0.28mi | 3/2.5 | 1,422 (+10%) | 4mo | $205,000 | $144 | 63 |
| 15708 Park Ave | 0.27mi | 3/2.0 | 1,467 (+14%) | 0mo | $167,500 | $114 | 63 |
| 15934 Marshfield Ave | 0.55mi | 3/2.0 | 1,221 (-6%) | 8mo | $105,000 | $86 | 56 |
| 15943 Ashland Ave | 0.52mi | 3/1.5 | 1,174 (-9%) | 11mo | $110,000 | $94 | 51 |
| 16030 Gauger Ave | 0.58mi | 3/1.5 | 1,152 (-11%) | 10mo | $125,000 | $109 | 46 |
| 16122 Ashland Ave | 0.70mi | 4/1.5 (+1) | 1,381 (+7%) | 7mo | $230,000 | $167 | 45 |
| 15018 Myrtle Ave | 0.72mi | 4/1.5 (+1) | 1,397 (+8%) | 7mo | $88,900 | $64 | 42 |
| 15018 Loomis Ave | 0.71mi | 4/2.0 (+1) | 1,400 (+8%) | 9mo | $230,000 | $164 | 38 |
| 112 W 155th St | 0.60mi | 4/2.0 (+1) | 1,470 (+14%) | 7mo | $159,999 | $109 | 36 |
Match score weights: distance 35% · size 25% · config 20% · recency 20%. Top-matched comps best support the ARV.
Projected returns pro-forma
10.0% appreciation · 3.0% rent growth · sell at horizon
- IRR
- 32.6%
- Equity multiple
- 3.55×
- Total profit
- $121,173
- Equity at exit
- $153,149
- IRR
- 28.1%
- Equity multiple
- 8.02×
- Total profit
- $334,228
- Equity at exit
- $330,273
Cash invested: $47,600 (down + closing). Projections, not guarantees.
Landlord ↔ Tenant lean methodology
- Overall (STATE)
- 43 Moderately Tenant-Leaning
- State Illinois
- 43 Moderately Tenant-Leaning · D+7
- County
- — inherits STATE
- City
- — inherits STATE
ZIP-level market 60426
- Home prices YoY
- 6.9%
- Active inventory
- 134
- Price-to-rent
- 7.4×
Monthly cashflow live
- Estimated rent
- $1,903 medium interval (Pro) →
- Mortgage (P&I)
- −$891
- Tax from tax record
- −$92 /mo · $1,100/yr
- Insurance
- −$71
- HOA
- −$0
- Vacancy / Maint / Mgmt
- −$400
- Net cashflow
- $450
Break-even live
UW: 25.0% down · 7.5% · 30yr · 1.5% tax · 5.0% vac · 8.0% maint · 8.0% mgmt
Financing live
Cash to close
- Down payment
- $42,500
- Closing costs
- $5,100
- Reserves months
- —
- Total cash needed
- —
Loan-product check · same deal, 3 products live
Conventional
25% down · 7.5% · 30yr
- Down + closing
- —
- Monthly P&I
- —
- Monthly cashflow
- —
- DSCR
- —
- Eligible?
- —
Personal DTI + credit; lowest rate.
DSCR
20% down · 8.5% · 30yr
- Down + closing
- —
- Monthly P&I
- —
- Monthly cashflow
- —
- DSCR
- —
- Eligible?
- —
No personal income docs; deal must DSCR.
Hard money
10% down · 12.0% · 12mo
- Down + closing
- —
- Monthly P&I
- —
- Monthly cashflow
- —
- DSCR
- —
- Eligible?
- —
Short-term bridge; refi at stabilization.
Rent comps 4 comps
| Address | Beds | Baths | Sqft | Rent | $/sqft | DOM | Units | Dist |
|---|---|---|---|---|---|---|---|---|
| 16125 Marshfield Ave Markham, IL | 3.0 | 1.0 | 1043 | $2,400 | $2.30 | 1d | 1 | 0.72mi |
| 16048 Halsted St Unit 2 Harvey, IL | 3.0 | 1.0 | 1091 | $1,650 | $1.51 | 24d | 1 | 0.95mi |
| 14802 Cooper Ave Harvey, IL | 3.0 | 1.5 | 1200 | $1,700 | $1.42 | 24d | 1 | 1.40mi |
| 14629 Hoyne Ave Dixmoor, IL | 3.0 | 1.0 | 920 | $1,495 | $1.62 | 24d | 1 | 1.48mi |
Listing history 10 events
-
2026-06-18days on market $170,000 Active 14 DOM
-
2026-06-17days on market $170,000 Active 13 DOM
-
2026-06-16days on market $170,000 Active 12 DOM
-
2026-06-15days on market $170,000 Active 11 DOM
-
2026-06-13days on market $170,000 Active 9 DOM
-
2026-06-13days on market $170,000 Active 8 DOM
-
2026-06-09days on market $170,000 Active 5 DOM
-
2026-06-08days on market $170,000 Active 4 DOM
-
2026-06-07remarks 650-char remark
-
2026-06-07$170,000 Active 3 DOM
ⓘ Source: listings_history table (triggers on properties + properties_extension) + one-shot
backfill from property_details.listing_events for pre-trigger history.
Tax reassessment forecast IL · Partial reset (capped growth)
- Current annual tax
- $1,100 · $92/mo
- Projected year-2 tax
- $2,480 · $207/mo
- Expected delta
- +$1,379/yr (+$115/mo · 125.3%)
ⓘ Screening estimate from a state-policy table — verify with the county assessor before closing.
Climate risk First Street
- Flood 1/10 Low FEMA zone X (unshaded) · 0% chance over 30 yrs
- Wildfire 1/10 Low
- Heat 3/10 Moderate 7 d/yr ≥102°F today · 15 d/yr by 30 yrs out
- Wind 2/10 Low
- Air quality 3/10 Moderate 4 unhealthy d/yr today · 4 by 30 yrs out
Nearby sold comps map
Loading sold comps map…
Walkable amenities ~0.75 mi
Loading nearby amenities…
Taxation est. · year 1
- Rental income
- $22,839
- − Mortgage interest
- −$9,523
- − Property taxes
- −$1,100
- − Insurance
- −$850
- − Repairs & maintenance
- −$1,827
- − Management
- −$1,827
- − Depreciation
- −$4,945
- Taxable income
- $2,766
- Est. tax owed @ 24.0%
- −$664
- After-tax cash flow
- $4,731/yr
For passive investors: Depreciation is non-cash, so a rental often shows a tax loss while cash-flowing — sheltering income. Rental losses are passive: they offset passive income freely, and up to $25,000/yr can offset ordinary (W-2) income if you actively participate and your MAGI is under $100k (phasing out to $0 by $150k); unused losses carry forward. On sale, claimed depreciation is recaptured at up to 25%, and gains may owe capital-gains tax (a 1031 exchange can defer both). Figures are a year-1 estimate at your 24.0% rate — not tax advice; consult a CPA.
Schools (NCES district)
- District
- Thornton Twp Hsd 205
- NCES district ID
- 1738970
- Math proficiency
- 7% ▬ 0.00%
- Reading proficiency
- 8% ▼ -2.00%
- Median HH income
- $43,392
- Composite
- 6.92/100
- National rank
- #9976
- State rank
- #594 of 620 in IL
Livability — Harvey
- Score
- 67/100
- State rank
- #539
- US rank
- #11162
Category grades
Schools grade is shown separately in the Schools card above.
Census & demographics
- Census place
- Harvey, IL
- City population
- 23,066
- Population (ZIP)
- 23,066
Population outlook (Cook County) Hauer SSP2
- Today (2025)
- 5,347,519 people
- By 2030
- 5,357,703 · +0.2%
- By 2040
- 5,324,924 · -0.4%
- By 2050
- 5,230,762 · -2.2%
- By 2075
- 4,785,735 · -10.5%
- By 2100
- 4,188,836 · -21.7%
Race, ethnicity, and origin ACS 2023
- Neighborhood character
- Majority Black (59%)
- Race & ethnicity
- Black 59% Hispanic / Latino 33% Two or more races 12% White 3% Asian 2%
- Hispanic origin (detail)
- Mexican 31%
- Foreign-born
- 17% · Canada
- Languages at home
- 67% English-only · Spanish 30% Other Indo-European 2% French/Haitian/Cajun 1%
Political lean MEDSL · Cook
- 2024 margin
- Solid D (+42.0) · D 70.4% · R 28.4% · Other 1.2%
- 2008→2024 swing
- -11.4pp toward R · 2008: 53.4pp · 2024: 42.0pp
- All cycles
- 2024: D+42.0 2020: D+50.3 2016: D+53.0 2012: D+49.4 2008: D+53.4
Not yet ingested
- Civics
- —
Market trends
- HPI YoY
- ▲ 20.36%
- Current HPI
- 313.7895
- Rent YoY
- —
- Metro
- —
- State GDP YoY
- ▲ 1.59%
- F500 in state
- 60
Industry mix (Fortune 500 HQ in IL)
| Industry | F500 HQs | Revenue |
|---|---|---|
| Insurance | 4 | $201B |
|
||
| Consumer Goods | 4 | $87B |
|
||
| Industrial Machinery | 3 | $64B |
|
||
| Healthcare | 2 | $55B |
|
||
| Retail / Pharmacy | 1 | $148B |
|
||
| Agriculture / Food | 1 | $86B |
|
||
Price history
+240.9% since first listed8 events — show timeline
- 2026-06-04 Listed $170,000 MRED as Distributed by MLS Grid
- 2025-05-21 Sold (Public Records) $45,000 Public Records
- 2025-05-20 Sold (MLS) $45,000 MRED as Distributed by MLS Grid
- 2025-04-24 Contingent — MRED as Distributed by MLS Grid
- 2025-04-17 Listing Removed — MRED as Distributed by MLS Grid
- 2025-04-17 Listed $49,873 MRED as Distributed by MLS Grid
- 2025-04-10 Price Changed — MRED as Distributed by MLS Grid
- 2025-01-30 Listed — MRED as Distributed by MLS Grid
Property tax history
-1.0%/yrLatest (2023): $1,100 · +126.5% YoY. Source: county tax records.
Cash-flow waterfall
monthlySold comps — $/sqft
last 12 mo · ≤1 miLoading sold comps…