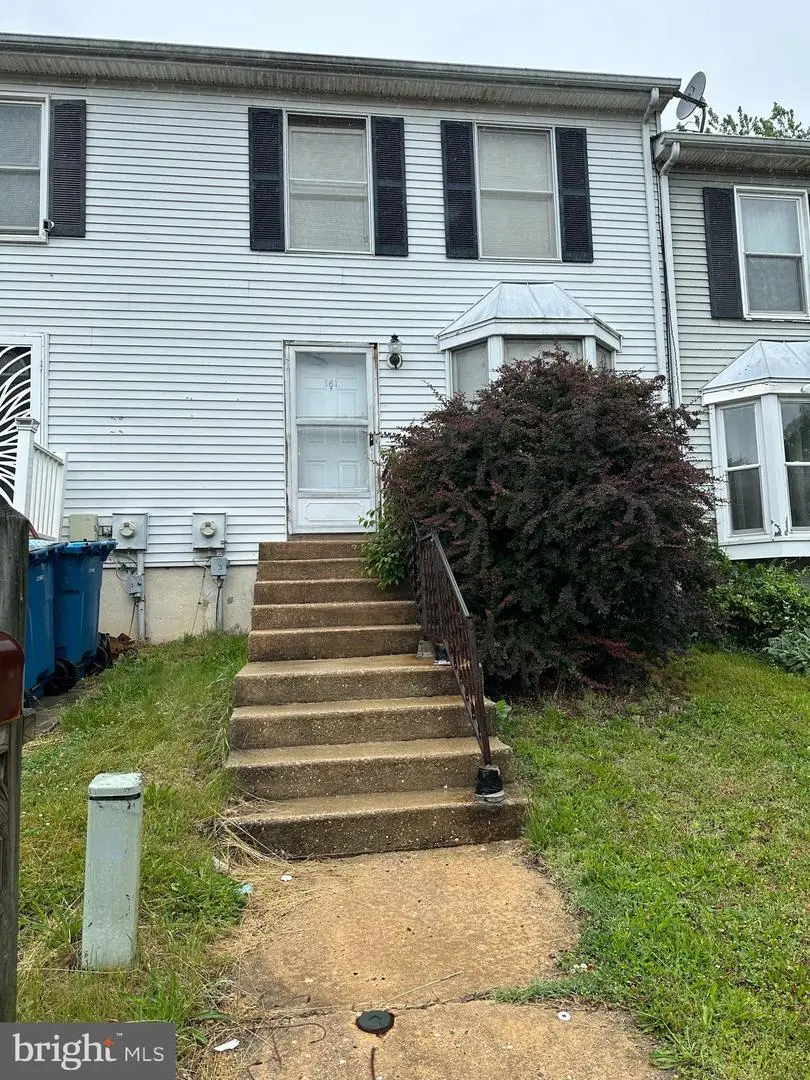
161 Whitburn Pl · Bear, DE
Flood risk 1/10 · Minimal
- FEMA flood zone
- X (unshaded)
- Chance of flooding over 30 yrs
- 0.0%
- Est. flood insurance / yr
- $473 – $860
Fire risk 1/10 · Minimal
- Est. fire insurance / yr
- $476 – $884
Heat risk 7/10 · Major
- Hot days now (above 103°F)
- 7 days/yr
- Hot days in 30 yrs
- 15 days/yr
Wind risk 6/10 · Moderate
- Chance of severe wind over 30 yrs
- 27.0%
Air-quality risk 4/10 · Minor
- Unhealthy air days now
- 3 days/yr
- Unhealthy air days in 30 yrs
- 5 days/yr
Risk factors via First Street. Map © Google.
Why this score? — see what drove the B+ grade
The composite is a weighted blend of 9 inputs, each scored 0–100. Each bar is that input's sub-score; the figure is the points it added to the 100-point composite (weight × sub-score).
- Cash flow +30.0/30.0
- ARV discount +15.0/15.0
- DSCR +10.0/10.0
- 1% rule +9.1/10.0
- Livability +3.7/5.0
- Rent growth +3.0/5.0
- Schools +2.5/10.0
- Condition / age +2.5/5.0
- Appreciation +0.0/10.0
$159,900
🖨 Deal sheet (PDF) 📄 Offer letter ✓ Due diligence
Listing remarks
3 Bedrooms, 1.5 Baths townhome in Glasscow Pines in Newark, Delaware. Very convenient locations: minutes to highway, shopping and restaurants. Property being sold AS IS. Personal items will be removed prior to closing.
Key facts
- $23 HOA
- 2 parking spots
- Built 1989
Property features AI
Finance
- Other: Assessor indicates year built and finished area; Above-grade finished area reported as 1,075 (per assessor)
- HOA & community: HOA fee $275 annually
Exterior
- Parking: Off-street parking for 2 vehicles; Two total garage and parking spaces
- Utilities: Public water; Public sewer; Electric available; Natural gas available; Cable TV available
- Home design: Interior townhouse/rowhouse; Fee simple ownership
- Construction: Vinyl and aluminum siding; Concrete perimeter foundation; Above-grade and below-grade structures
- Exterior features: Lot dimensions approximately 18 x 100; No tidal water
Interior
- Bedrooms: Three bedrooms on the first upper level
- Bathrooms: One full bathroom; One half bathroom on the main level
- Heating & cooling: Heat pump(s) heating; Central air conditioning; Electric heating fuel; Electric hot water
- Interior features: Full basement; Living area per assessor
Neighborhood map
What this means for you Summary
Snapshot
- This is a 3-bed/1.5-bath townhouse listed at $160k.
Deal economics
- At list price, monthly cash flow is $700 ($8k/yr) — positive.
- The deal already cash-flows at list — no discount required.
- Meets the 1% rule at list price ($2k rent vs $160k).
- Cap rate 11.5% vs local median 4.7% in Bear — top-decile yield for the area; either an underpriced asset or a hidden risk that comps aren't pricing in. Stress-test before assuming the spread holds.
Location & tenants
- Location reads 73/100 on livability (#8 in DE) — a middle-class / working-renter tenant base. Strengths: housing A+, employment A-, cost of living A-; Watch: crime C-, amenities F, commute F.
- Christina School District (suburban): math 22% / reading 33% proficiency, ranked #18 of 26 in DE (top 69%) — low school quality limits family demand, transient renter base, plan for 1-2y turnover.
- Zoned schools: Keene (William B.) Elementary School (math 22% / reading 32%, grade F, #59 of 105 statewide, top 60%, 474 students, 0% FRL); Gauger-Cobbs Middle School (math 11% / reading 26%, grade F, #30 of 36 statewide, top 86%, 779 students, 0% FRL); Glasgow High School (math 8% / reading 17%, grade F, #36 of 40 statewide, top 90%, 895 students, 0% FRL) — zoned schools average 0% FRL vs 50% district-wide (50 pts lower); this property's tenant base skews higher-income than the district average.
- Market conditions: Rents rising (+2.2%/yr); 154 active listings in the ZIP; 8 comparable units currently listed for rent nearby; rentals leasing fast (median 1d on market — plan ~1-2 weeks tenant-placement turnaround); solid renter incomes; 1,367 units permitted in New Castle County in 2024 (201 in 5+ unit buildings).
Forward outlook
- Local home prices are declining (-3.0%/yr); year-one equity from $1k of loan paydown is wiped out by about $5k of value loss. Plan a longer hold.
- New Castle County population projected at +9% by 2050 — modest demand growth; plan on rents tracking national, not racing it.
- At projected returns (-3.0% appreciation + 2.2% rent growth), your $45k cash investment doubles in ~7 years — after that, you're playing with house money.
Negotiation context
- Only 5 days on market — expect competitive offers; lowballing is unlikely to land.
- Current owner paid $78k; list at $160k implies a 104% gain — meaningful room to come down on a strong offer.
Risks & watch-outs
- Climate carrying-cost: major wind risk, 27% chance of damaging wind over 30y; extreme-heat days projected 7→15/yr by 2055 (HVAC capex compounding) — expect insurance premiums to compound above CPI over the hold.
Questions for the listing agent
- What does the HOA fee cover, when was the last increase, and are there any pending special assessments or reserve-fund shortfalls?
- Is there a deadline driving the sale (1031 exchange, divorce, estate, relocation)? That informs how much negotiation room exists.
- Schools are D-rated, which usually means shorter tenancies and higher turnover. Who's the typical renter profile here, and what's been the actual vacancy rate?
- What's the average days-on-market for RENTAL listings here right now (not sales)? A rising rental-DOM trend means longer vacancies and softer asking-rent achievability than the comps imply.
- What's the recent tenant-quality profile in this submarket — average credit score on applications, eviction rate, late-payment / NSF rate, and stable-employment percentage? A property-management company in the area should have these aggregated.
- How much new for-sale + rental construction is in the pipeline within 1–3 miles? Heavy new supply typically softens prices + rents 12–24 months out; constrained supply supports both.
Investment metrics
- 1% rule
- 1.41% ✓
- Cap rate
- 11.55%
- Cash-on-cash
- 18.77%
- DSCR
- 1.84
- GRM
- 5.9
CMA / ARV
- ARV (on-the-fly)
- $246,175
- Comps found
- 12
Show comp detail 12 sales within ~0.75 mi
| Address | Dist | Beds/Ba | Sqft | Sold | Price | $/sf | Match |
|---|---|---|---|---|---|---|---|
| 115 Whitburn Pl | 0.04mi | 3/1.5 | 1,075 (0%) | 4mo | $250,000 | $233 | 95 |
| 106 Whitburn Pl | 0.07mi | 3/1.5 | 1,075 (0%) | 15mo | $217,000 | $202 | 84 |
| 303 Thayer Ct | 0.35mi | 3/1.5 | 1,150 (+7%) | 1mo | $270,000 | $235 | 72 |
| 327 Thayer Ct | 0.33mi | 3/1.5 | 1,150 (+7%) | 12mo | $250,000 | $217 | 63 |
| 304 Thayer Ct | 0.32mi | 3/1.5 | 1,150 (+7%) | 15mo | $160,000 | $139 | 61 |
| 455 Strathaven Ct | 0.39mi | 3/1.5 | 1,150 (+7%) | 13mo | $265,000 | $230 | 60 |
| 309 Thayer Ct | 0.34mi | 3/1.5 | 1,150 (+7%) | 16mo | $220,000 | $191 | 59 |
| 123 Council Cir | 0.69mi | 3/2.0 | 1,200 (+12%) | 2mo | $285,000 | $238 | 45 |
| 10 Bradley Dr | 0.64mi | 3/1.5 | 1,225 (+14%) | 3mo | $275,000 | $224 | 44 |
| 30 Bradley Dr | 0.66mi | 3/1.5 | 1,225 (+14%) | 8mo | $280,000 | $229 | 40 |
| 11 Bradley Dr | 0.62mi | 3/1.5 | 1,225 (+14%) | 15mo | $281,000 | $229 | 35 |
| 1001 San Remo Ct | 0.73mi | 2/1.5 (-1) | 1,225 (+14%) | 16mo | $290,000 | $237 | 24 |
Match score weights: distance 35% · size 25% · config 20% · recency 20%. Top-matched comps best support the ARV.
Projected returns pro-forma
-3.0% appreciation · 2.19% rent growth · sell at horizon
- IRR
- 9.7%
- Equity multiple
- 1.38×
- Total profit
- $16,883
- Equity at exit
- $23,842
- IRR
- 18.1%
- Equity multiple
- 2.45×
- Total profit
- $64,848
- Equity at exit
- $13,825
Cash invested: $44,772 (down + closing). Projections, not guarantees.
Landlord ↔ Tenant lean methodology
- Overall (STATE)
- 70 Landlord-Friendly
- State Delaware
- 70 Landlord-Friendly · D+7
- County
- — inherits STATE
- City
- — inherits STATE
ZIP-level market 19702
- Rents YoY
- 2.2%
- Active inventory
- 154
- Price-to-rent
- 5.9×
Monthly cashflow live
- Estimated rent
- $2,252 high interval (Pro) →
- Mortgage (P&I)
- −$839
- Tax from tax record
- −$151 /mo · $1,811/yr
- Insurance
- −$67
- HOA
- −$23
- Vacancy / Maint / Mgmt
- −$473
- Net cashflow
- $700
Break-even live
Sensitivity live
| Price | -10% $791 | -5% $745 | +0% $700 | +5% $655 | +10% $610 |
|---|---|---|---|---|---|
| Rent | -10% $522 | -5% $611 | +0% $700 | +5% $789 | +10% $878 |
| Rate | -1.0pp $781 | -0.5pp $741 | base $700 | +0.5pp $659 | +1.0pp $617 |
UW: 25.0% down · 7.5% · 30yr · 1.5% tax · 5.0% vac · 8.0% maint · 8.0% mgmt
Financing live
Cash to close
- Down payment
- $39,975
- Closing costs
- $4,797
- Reserves months
- —
- Total cash needed
- —
Loan-product check · same deal, 3 products live
Conventional
25% down · 7.5% · 30yr
- Down + closing
- —
- Monthly P&I
- —
- Monthly cashflow
- —
- DSCR
- —
- Eligible?
- —
Personal DTI + credit; lowest rate.
DSCR
20% down · 8.5% · 30yr
- Down + closing
- —
- Monthly P&I
- —
- Monthly cashflow
- —
- DSCR
- —
- Eligible?
- —
No personal income docs; deal must DSCR.
Hard money
10% down · 12.0% · 12mo
- Down + closing
- —
- Monthly P&I
- —
- Monthly cashflow
- —
- DSCR
- —
- Eligible?
- —
Short-term bridge; refi at stabilization.
Rent comps 8 comps
| Address | Beds | Baths | Sqft | Rent | $/sqft | DOM | Units | Dist |
|---|---|---|---|---|---|---|---|---|
| 2102 Ashkirk Dr Newark, DE | 1.0–2.0 | 1.0–2.0 | 880 | $1,795 | $2.04 | 0d | 6 | 0.19mi |
| 885 Salem Church Rd Newark, DE | 1.0–2.0 | 1.0–2.0 | 850 | $1,795 | $2.11 | 0d | 1 | 0.47mi |
| 50 Turnberry Ct Bear, DE | 1.0–3.0 | 1.0–3.0 | 1598 | $3,400 | $2.13 | 0d | 195 | 0.56mi |
| 10 McFarland Dr Newark, DE | 1.0–2.0 | 1.0–2.0 | 955 | $2,125 | $2.22 | 0d | 3 | 0.71mi |
| 900 Woodchuck Pl Bear, DE | 1.0–3.0 | 1.0–2.0 | 935 | $2,235 | $2.39 | 0d | 44 | 0.88mi |
| 2139 Valence Pl Newark, DE | 2.0–3.0 | 2.0 | 1183 | $2,505 | $2.12 | 17d | 6 | 0.98mi |
| 308 Skeet Ave Bear, DE | 3.0 | 2.0 | 1100 | $2,300 | $2.09 | 26d | 1 | 1.02mi |
| 1 Kennedy Cir Bear, DE | 2.0–3.0 | 2.0–3.0 | 1702 | $3,315 | $1.95 | 0d | 34 | 1.10mi |
HOA detail
- Monthly dues
- $23 · $276/yr
Listing history 7 events
-
2026-06-21status $159,900 Active Under Contract 5 DOM
-
2026-06-17days on market $159,900 Active 5 DOM
-
2026-06-16days on market $159,900 Active 4 DOM
-
2026-06-15days on market $159,900 Active 3 DOM
-
2026-06-13status $159,900 Active 1 DOM
-
2026-06-10remarks 218-char remark
-
2026-06-10$159,900 Coming Soon 1 DOM
ⓘ Source: listings_history table (triggers on properties + properties_extension) + one-shot
backfill from property_details.listing_events for pre-trigger history.
Tax reassessment forecast DE · Partial reset (capped growth)
- Current annual tax
- $1,811 · $151/mo
- Projected year-2 tax
- $1,811 · $151/mo
- Expected delta
- $0/yr ($0/mo · 0.0%)
ⓘ Screening estimate from a state-policy table — verify with the county assessor before closing.
Climate risk First Street
- Flood 1/10 Low FEMA zone X (unshaded) · 0% chance over 30 yrs
- Wildfire 1/10 Low
- Heat 7/10 Severe 7 d/yr ≥103°F today · 15 d/yr by 30 yrs out
- Wind 6/10 Major 27% chance of damaging wind over 30 yrs
- Air quality 4/10 Moderate 3 unhealthy d/yr today · 5 by 30 yrs out
Nearby sold comps map
Loading sold comps map…
Walkable amenities ~0.75 mi
Loading nearby amenities…
Taxation est. · year 1
- Rental income
- $27,026
- − Mortgage interest
- −$8,957
- − Property taxes
- −$1,811
- − Insurance
- −$800
- − Repairs & maintenance
- −$2,162
- − Management
- −$2,162
- − HOA
- −$276
- − Depreciation
- −$4,652
- Taxable income
- $6,208
- Est. tax owed @ 24.0%
- −$1,490
- After-tax cash flow
- $6,913/yr
For passive investors: Depreciation is non-cash, so a rental often shows a tax loss while cash-flowing — sheltering income. Rental losses are passive: they offset passive income freely, and up to $25,000/yr can offset ordinary (W-2) income if you actively participate and your MAGI is under $100k (phasing out to $0 by $150k); unused losses carry forward. On sale, claimed depreciation is recaptured at up to 25%, and gains may owe capital-gains tax (a 1031 exchange can defer both). Figures are a year-1 estimate at your 24.0% rate — not tax advice; consult a CPA.
Schools (NCES district)
- District
- Christina School District
- NCES district ID
- 1000200
- Math proficiency
- 22% ▼ -12.00%
- Reading proficiency
- 33% ▼ -5.00%
- Median HH income
- $58,838
- Composite
- 24.93/100
- National rank
- #7567
- State rank
- #18 of 26 in DE
Livability — Bear
- Score
- 73/100
- State rank
- #8
- US rank
- #5158
Category grades
Schools grade is shown separately in the Schools card above.
Census & demographics
- Census place
- Bear, DE
- County
- New Castle County · 483,412 people
- City population
- 42,984
- Metro
- Philadelphia-Camden-Wilmington, PA-NJ-DE-MD
- Population (ZIP)
- 55,683
- Household income
- $92,446
- Rent vs Own
- Severe rent burden
- 1421.0
Population outlook (New Castle County) Hauer SSP2
- Today (2025)
- 594,686 people
- By 2030
- 609,164 · +2.4%
- By 2040
- 632,154 · +6.3%
- By 2050
- 649,068 · +9.1%
- By 2075
- 687,771 · +15.7%
- By 2100
- 694,961 · +16.9%
Race, ethnicity, and origin ACS 2023
- Neighborhood character
- Highly diverse neighborhood (Simpson 0.73)
- Race & ethnicity
- White 38% Black 31% Hispanic / Latino 14% Asian 12% Two or more races 8%
- Hispanic origin (detail)
- Mexican 7% Puerto Rican 3%
- Common ancestry
- Romanian 3% Lithuanian 1% Slovak 1%
- Foreign-born
- 22% · Canada, China, South Korea
- Languages at home
- 73% English-only · Spanish 11% Other Indo-European 5% Other Asian/Pacific 3%
Political lean MEDSL · New Castle
- 2024 margin
- Solid D (+32.6) · D 65.5% · R 32.9% · Other 1.6%
- 2008→2024 swing
- -8.1pp toward R · 2008: 40.6pp · 2024: 32.6pp
- All cycles
- 2024: D+32.6 2020: D+37.1 2016: D+29.6 2012: D+34.1 2008: D+40.6
Not yet ingested
- Civics
- —
Market trends
- HPI YoY
- ▼ -241.79%
- Current HPI
- 248.8414
- Rent YoY
- ▲ 2.19%
- Metro
- Philadelphia-Camden-Wilmington, PA-NJ-DE-MD
- State GDP YoY
- —
- F500 in state
- 0
Price history
+110.7% since first listed3 events — show timeline
- 2026-06-09 Coming Soon $159,900 BRIGHT MLS
- 1995-07-17 Sold (Public Records) $78,500 Public Records
- 1990-03-01 Sold (Public Records) $75,900 Public Records
Property tax history
+3.5%/yrLatest (2024): $1,811 · +2.7% YoY. Source: county tax records.
Cash-flow waterfall
monthlySold comps — $/sqft
last 12 mo · ≤1 miLoading sold comps…