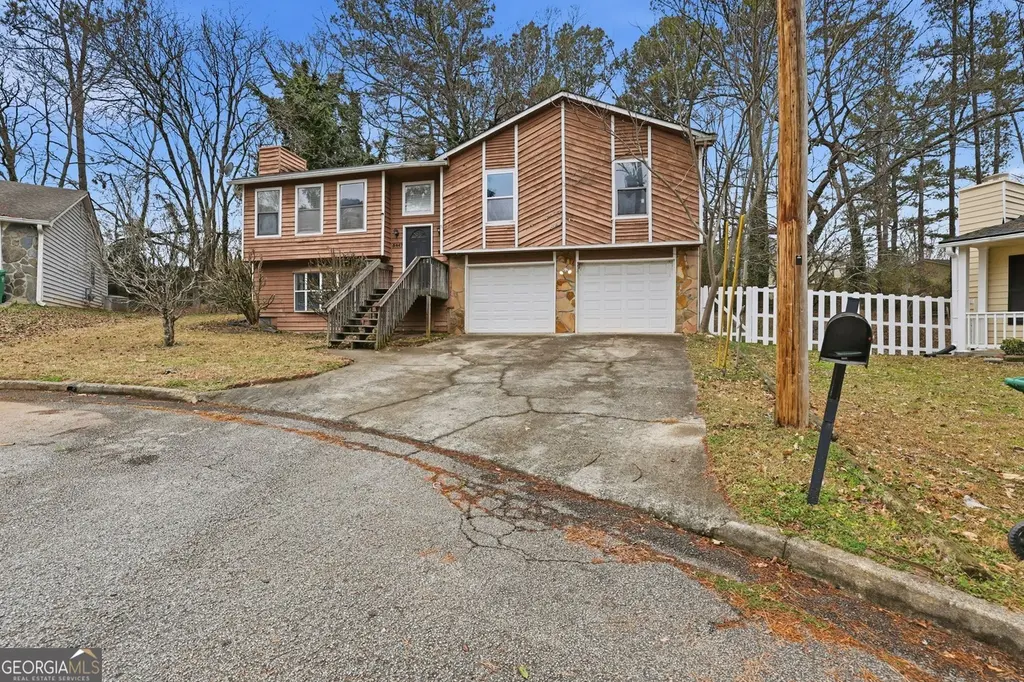
5447 Pepperwood Ct · Stone Mountain, GA
Flood risk 1/10 · Minimal
- FEMA flood zone
- X (unshaded)
- Chance of flooding over 30 yrs
- 0.0%
- Est. flood insurance / yr
- $507 – $1,088
Fire risk 1/10 · Minimal
- Est. fire insurance / yr
- $963 – $1,789
Heat risk 5/10 · Moderate
- Hot days now (above 104°F)
- 7 days/yr
- Hot days in 30 yrs
- 17 days/yr
Wind risk 5/10 · Moderate
- Chance of severe wind over 30 yrs
- 25.0%
Air-quality risk 6/10 · Moderate
- Unhealthy air days now
- 8 days/yr
- Unhealthy air days in 30 yrs
- 11 days/yr
Risk factors via First Street. Map © Google.
Why this score? — see what drove the D+ grade
The composite is a weighted blend of 9 inputs, each scored 0–100. Each bar is that input's sub-score; the figure is the points it added to the 100-point composite (weight × sub-score).
- ARV discount +15.0/15.0
- Cash flow +14.1/30.0
- 1% rule +4.7/10.0
- DSCR +4.3/10.0
- Livability +4.0/5.0
- Rent growth +2.8/5.0
- Condition / age +2.5/5.0
- Schools +2.1/10.0
- Appreciation +0.0/10.0
$209,900
🖨 Deal sheet (PDF) 📄 Offer letter ✓ Due diligence
Listing remarks MLS
Discover this inviting split-level residence tucked away in a quiet Stone Mountain cul-de-sac. This three-bedroom, two-bathroom home offers a versatile floor plan with 1,296 square feet of primary living space and a partially finished basement for additional storage or recreation. The main level features soaring vaulted ceilings and a spacious living area centered around a classic masonry fireplace. Prepare meals in the well-appointed kitchen, which flows into a dedicated dining space overlooking the expansive backyard. The primary suite serves as a private getaway with an ensuite bath, while two additional bedrooms offer ample space for a variety of needs. Outside, enjoy the privacy of a wooded lot with a rear deck perfect for outdoor relaxation. An attached two-car garage provides convenience and extra utility space.
Key facts
- Quiet cul-de-sac
- Masonry fireplace
- 0.32 acre lot
Tags
Neighborhood map
What this means for you Summary
Snapshot
- This is a 3-bed/2.0-bath single-family listed at $210k.
Deal economics
- At list price, monthly cash flow is $33 ($391/yr) — positive.
- The deal already cash-flows at list — no discount required.
- To meet the 1% rule (rent ≥ 1% of price), the offer needs to be $204k (2.7% below list).
- Recommended offer: $185k (12.0% below list) — sets the bar for market timing.
- Cap rate 6.5% vs local median 5.1% in Stone Mountain — meaningfully above typical; check what's discounted (condition, days-on-market, listing class) to confirm the premium yield is real.
Location & tenants
- Location reads 79/100 on livability (#11 in GA, #1,977 nationally) — a middle-class / working-renter tenant base. Strengths: commute A+, cost of living A+, housing A+; Watch: employment D+, schools F, crime F.
- Dekalb County (suburban): math 19% / reading 28% proficiency, ranked #125 of 174 in GA (top 72%) — low school quality limits family demand, transient renter base, plan for 1-2y turnover; 68% free/reduced lunch — lower-income household profile, screen leases tightly.
- Market conditions: Rents rising (+1.3%/yr); 249 active listings in the ZIP; 7 comparable units currently listed for rent nearby; rentals lingering (median 45d on market — plan ~5-8 weeks vacancy on turnover, expect pricing pressure); 57% of comp listings sitting > 30 days — soft ceiling on asking rent; solid renter incomes; 1,240 units permitted in DeKalb County in 2024 (385 in 5+ unit buildings).
Forward outlook
- Local home prices are declining (-3.0%/yr); year-one equity from $1k of loan paydown is wiped out by about $6k of value loss. Plan a longer hold.
- DeKalb County population projected at +28% by 2050 — long-run rental-demand tailwind backs the buy-and-hold thesis.
Negotiation context
- It's been on market 122 days — a 12% lower offer ($185k) is reasonable based on typical stale-listing flexibility.
- 2 sale attempts since 14y ago; this cycle's ask has dropped $45k (18%) from the opening price — seller is motivated, your offer sets the floor, not the list.
- Current owner paid $46k; list at $210k implies a 356% gain — meaningful room to come down on a strong offer.
Risks & watch-outs
- Climate carrying-cost: moderate wind risk, 25% chance of damaging wind over 30y; extreme-heat days projected 7→17/yr by 2055 (HVAC capex compounding) — expect insurance premiums to compound above CPI over the hold.
Questions for the listing agent
- It's been on market 122 days. Have you received any prior offers? Is the seller open to a 12% concession, seller financing, or rate buy-down credit?
- Why hasn't it sold? Are there any deal-killer items the seller is aware of (foundation, flood, title, zoning, code violations)?
- Is there a deadline driving the sale (1031 exchange, divorce, estate, relocation)? That informs how much negotiation room exists.
- Schools are F-rated, which usually means shorter tenancies and higher turnover. Who's the typical renter profile here, and what's been the actual vacancy rate?
- Crime grade is F in this area — have there been break-ins, vandalism, or insurance claims at this property in the last 3 years? What carrier currently insures it and at what premium?
- The area grade is low — what's the realistic commute time and amenity access for the typical tenant pool here? Any planned neighborhood developments (good or bad) we should know about?
- What's the average days-on-market for RENTAL listings here right now (not sales)? A rising rental-DOM trend means longer vacancies and softer asking-rent achievability than the comps imply.
- What's the recent tenant-quality profile in this submarket — average credit score on applications, eviction rate, late-payment / NSF rate, and stable-employment percentage? A property-management company in the area should have these aggregated.
- How much new for-sale + rental construction is in the pipeline within 1–3 miles? Heavy new supply typically softens prices + rents 12–24 months out; constrained supply supports both.
Investment metrics
- 1% rule
- 0.97% ✗
- Cap rate
- 6.48%
- Cash-on-cash
- 0.66%
- DSCR
- 1.03
- GRM
- 8.6
CMA / ARV
- ARV (median comp)
- $282,256
- List price
- $209,900
- Delta
- -25.63%
- Verdict
- UNDERPRICED
- Comps
- 20 within 1.0 mi
Show comp detail 12 sales within ~0.75 mi
| Address | Dist | Beds/Ba | Sqft | Sold | Price | $/sf | Match |
|---|---|---|---|---|---|---|---|
| 439 Orchard Dr | 0.49mi | 4/2.5 (+1) | 2,275 (+0%) | 4mo | $65,000 | $29 | 66 |
| 709 Pepperwood Trl | 0.14mi | 3/2.5 | 1,988 (-12%) | 7mo | $282,000 | $142 | 65 |
| 730 Rockborough Dr | 0.51mi | 4/2.5 (+1) | 2,173 (-4%) | 1mo | $270,000 | $124 | 61 |
| 5350 Rockbridge Rd | 0.66mi | 4/2.5 (+1) | 2,280 (+0%) | 1mo | $239,000 | $105 | 61 |
| 366 O Brian Dr | 0.57mi | 4/2.0 (+1) | 2,328 (+3%) | 6mo | $275,000 | $118 | 59 |
| 5322 Oshea Ln | 0.74mi | 4/2.5 (+1) | 2,218 (-2%) | 2mo | $297,000 | $134 | 53 |
| 630 Pennylake Ct | 0.43mi | 4/3.0 (+1) | 2,488 (+10%) | 6mo | $310,000 | $125 | 49 |
| 618 Rockborough Dr | 0.71mi | 4/2.5 (+1) | 2,100 (-8%) | 1mo | $265,000 | $126 | 46 |
| 432 Rock Meadow Dr | 0.68mi | 4/2.5 (+1) | 2,086 (-8%) | 5mo | $297,000 | $142 | 44 |
| 600 San Pablo Ct | 0.67mi | 4/2.0 (+1) | 2,550 (+12%) | 2mo | $169,900 | $67 | 42 |
| 5242 Cindy Way | 0.58mi | 4/3.0 (+1) | 1,956 (-14%) | 2mo | $340,000 | $174 | 39 |
| 5385 Martins Ln | 0.72mi | 4/2.5 (+1) | 2,000 (-12%) | 8mo | $220,000 | $110 | 33 |
Match score weights: distance 35% · size 25% · config 20% · recency 20%. Top-matched comps best support the ARV.
Projected returns pro-forma
-3.0% appreciation · 1.3% rent growth · sell at horizon
- IRR
- -17.3%
- Equity multiple
- 0.40×
- Total profit
- $-35,263
- Equity at exit
- $31,297
- IRR
- -13.0%
- Equity multiple
- 0.30×
- Total profit
- $-41,207
- Equity at exit
- $18,148
Cash invested: $58,772 (down + closing). Projections, not guarantees.
Landlord ↔ Tenant lean methodology
- Overall (STATE)
- 90 Strongly Landlord-Friendly
- State Georgia
- 90 Strongly Landlord-Friendly · R+3
- County
- — inherits STATE
- City
- — inherits STATE
ZIP-level market 30087
- Rents YoY
- 1.3%
- Active inventory
- 249
- Price-to-rent
- 8.6×
Monthly cashflow live
- Estimated rent
- $2,042 high interval (Pro) →
- Mortgage (P&I)
- −$1,101
- Tax from tax record
- −$392 /mo · $4,709/yr
- Insurance
- −$87
- HOA
- −$0
- Vacancy / Maint / Mgmt
- −$429
- Net cashflow
- $33
Break-even live
Sensitivity live
| Price | -10% $151 | -5% $92 | +0% $33 | +5% $-27 | +10% $-86 |
|---|---|---|---|---|---|
| Rent | -10% $-129 | -5% $-48 | +0% $33 | +5% $113 | +10% $194 |
| Rate | -1.0pp $138 | -0.5pp $86 | base $33 | +0.5pp $-22 | +1.0pp $-77 |
UW: 25.0% down · 7.5% · 30yr · 1.5% tax · 5.0% vac · 8.0% maint · 8.0% mgmt
Financing live
Cash to close
- Down payment
- $52,475
- Closing costs
- $6,297
- Reserves months
- —
- Total cash needed
- —
Loan-product check · same deal, 3 products live
Conventional
25% down · 7.5% · 30yr
- Down + closing
- —
- Monthly P&I
- —
- Monthly cashflow
- —
- DSCR
- —
- Eligible?
- —
Personal DTI + credit; lowest rate.
DSCR
20% down · 8.5% · 30yr
- Down + closing
- —
- Monthly P&I
- —
- Monthly cashflow
- —
- DSCR
- —
- Eligible?
- —
No personal income docs; deal must DSCR.
Hard money
10% down · 12.0% · 12mo
- Down + closing
- —
- Monthly P&I
- —
- Monthly cashflow
- —
- DSCR
- —
- Eligible?
- —
Short-term bridge; refi at stabilization.
Rent comps 7 comps
| Address | Beds | Baths | Sqft | Rent | $/sqft | DOM | Units | Dist |
|---|---|---|---|---|---|---|---|---|
| 697 Pepperwood Trl Stone Mountain, GA | 3.0 | 2.0 | 1576 | $1,650 | $1.05 | 44d | 1 | 0.09mi |
| 5509 Stonehaven Way Stone Mountain, GA | 4.0 | 3.0 | 1635 | $1,899 | $1.16 | 23d | 1 | 0.26mi |
| 524 Julius Dr Stone Mountain, GA | 3.0 | 2.0 | 1780 | $1,795 | $1.01 | 44d | 1 | 0.69mi |
| 5308 Omalley Ln Stone Mountain, GA | 4.0 | 2.5 | 1950 | $1,949 | $1.00 | 44d | 1 | 0.92mi |
| 469 Sherwood Grn Stone Mountain, GA | 3.0 | 2.0 | 1792 | $1,810 | $1.01 | 12d | 1 | 0.93mi |
| 5811 Navarre Ct Stone Mountain, GA | 3.0 | 2.0 | 1864 | $1,911 | $1.03 | 4d | 1 | 1.13mi |
| 643 Navarre Dr Stone Mountain, GA | 3.0 | 2.5 | 1666 | $2,600 | $1.56 | 44d | 1 | 1.50mi |
Listing history 24 events
-
2026-06-21days on market $209,900 Active 122 DOM
-
2026-06-18days on market $209,900 Active 119 DOM
-
2026-06-17days on market $209,900 Active 118 DOM
-
2026-06-16days on market $209,900 Active 117 DOM
-
2026-06-15statusdays on market $209,900 Active 116 DOM
-
2026-06-13pricestatusdays on market $209,900 Price Change 114 DOM
-
2026-06-09days on market $219,900 Active 110 DOM
-
2026-06-08days on market $219,900 Active 109 DOM
-
2026-06-07days on market $219,900 Active 108 DOM
-
2026-06-04days on market $219,900 Active 105 DOM
-
2026-06-03days on market $219,900 Active 104 DOM
-
2026-06-02days on market $219,900 Active 103 DOM
-
2026-06-01days on market $219,900 Active 102 DOM
-
2026-05-31statusdays on market $219,900 Active 101 DOM
-
2026-05-11price $224,900 830-char remark
Show marketing remark (830 chars)
Discover this inviting split-level residence tucked away in a quiet Stone Mountain cul-de-sac. This three-bedroom, two-bathroom home offers a versatile floor plan with 1,296 square feet of primary living space and a partially finished basement for additional storage or recreation. The main level features soaring vaulted ceilings and a spacious living area centered around a classic masonry fireplace. Prepare meals in the well-appointed kitchen, which flows into a dedicated dining space overlooking the expansive backyard. The primary suite serves as a private getaway with an ensuite bath, while two additional bedrooms offer ample space for a variety of needs. Outside, enjoy the privacy of a wooded lot with a rear deck perfect for outdoor relaxation. An attached two-car garage provides convenience and extra utility space.
-
2026-04-18price $234,900 830-char remark
Show marketing remark (830 chars)
Discover this inviting split-level residence tucked away in a quiet Stone Mountain cul-de-sac. This three-bedroom, two-bathroom home offers a versatile floor plan with 1,296 square feet of primary living space and a partially finished basement for additional storage or recreation. The main level features soaring vaulted ceilings and a spacious living area centered around a classic masonry fireplace. Prepare meals in the well-appointed kitchen, which flows into a dedicated dining space overlooking the expansive backyard. The primary suite serves as a private getaway with an ensuite bath, while two additional bedrooms offer ample space for a variety of needs. Outside, enjoy the privacy of a wooded lot with a rear deck perfect for outdoor relaxation. An attached two-car garage provides convenience and extra utility space.
-
2026-03-21price $249,900 830-char remark
Show marketing remark (830 chars)
Discover this inviting split-level residence tucked away in a quiet Stone Mountain cul-de-sac. This three-bedroom, two-bathroom home offers a versatile floor plan with 1,296 square feet of primary living space and a partially finished basement for additional storage or recreation. The main level features soaring vaulted ceilings and a spacious living area centered around a classic masonry fireplace. Prepare meals in the well-appointed kitchen, which flows into a dedicated dining space overlooking the expansive backyard. The primary suite serves as a private getaway with an ensuite bath, while two additional bedrooms offer ample space for a variety of needs. Outside, enjoy the privacy of a wooded lot with a rear deck perfect for outdoor relaxation. An attached two-car garage provides convenience and extra utility space.
-
2026-02-19$254,900 New 830-char remark
Show marketing remark (830 chars)
Discover this inviting split-level residence tucked away in a quiet Stone Mountain cul-de-sac. This three-bedroom, two-bathroom home offers a versatile floor plan with 1,296 square feet of primary living space and a partially finished basement for additional storage or recreation. The main level features soaring vaulted ceilings and a spacious living area centered around a classic masonry fireplace. Prepare meals in the well-appointed kitchen, which flows into a dedicated dining space overlooking the expansive backyard. The primary suite serves as a private getaway with an ensuite bath, while two additional bedrooms offer ample space for a variety of needs. Outside, enjoy the privacy of a wooded lot with a rear deck perfect for outdoor relaxation. An attached two-car garage provides convenience and extra utility space.
-
2013-09-30soldstatus $46,000
-
2012-12-02historical
-
2012-11-26soldstatus $46,000
-
2012-07-03$39,900 New
-
1999-10-13soldstatus $96,500
-
1985-05-22soldstatus $73,400
ⓘ Source: listings_history table (triggers on properties + properties_extension) + one-shot
backfill from property_details.listing_events for pre-trigger history.
Tax reassessment forecast GA · Resets to sale price
- Current annual tax
- $4,709 · $392/mo
- Projected year-2 tax
- $4,709 · $392/mo
- Expected delta
- $0/yr ($0/mo · 0.0%)
ⓘ Screening estimate from a state-policy table — verify with the county assessor before closing.
Climate risk First Street
- Flood 1/10 Low FEMA zone X (unshaded) · 0% chance over 30 yrs
- Wildfire 1/10 Low
- Heat 5/10 Major 7 d/yr ≥104°F today · 17 d/yr by 30 yrs out
- Wind 5/10 Major 25% chance of damaging wind over 30 yrs
- Air quality 6/10 Major 8 unhealthy d/yr today · 11 by 30 yrs out
Nearby sold comps map
Loading sold comps map…
Walkable amenities ~0.75 mi
Loading nearby amenities…
Taxation est. · year 1
- Rental income
- $24,503
- − Mortgage interest
- −$11,758
- − Property taxes
- −$4,709
- − Insurance
- −$1,050
- − Repairs & maintenance
- −$1,960
- − Management
- −$1,960
- − Depreciation
- −$6,106
- Taxable loss
- −$3,039
- Est. tax savings @ 24.0%
- +$729
- After-tax cash flow
- $1,120/yr
For passive investors: Depreciation is non-cash, so a rental often shows a tax loss while cash-flowing — sheltering income. Rental losses are passive: they offset passive income freely, and up to $25,000/yr can offset ordinary (W-2) income if you actively participate and your MAGI is under $100k (phasing out to $0 by $150k); unused losses carry forward. On sale, claimed depreciation is recaptured at up to 25%, and gains may owe capital-gains tax (a 1031 exchange can defer both). Figures are a year-1 estimate at your 24.0% rate — not tax advice; consult a CPA.
Schools (NCES district)
- District
- Dekalb County
- NCES district ID
- 1301740
- Math proficiency
- 19% ▼ -12.00%
- Reading proficiency
- 28% ▼ -7.00%
- Median HH income
- $51,448
- Composite
- 20.92/100
- National rank
- #8482
- State rank
- #125 of 174 in GA
Livability — Stone Mountain
- Score
- 79/100
- State rank
- #11
- US rank
- #1977
Category grades
Schools grade is shown separately in the Schools card above.
Census & demographics
- County
- Dekalb County · 782,738 people
- City population
- 130,941
- Metro
- Atlanta-Sandy Springs-Alpharetta, GA
- Population (ZIP)
- 38,977
- Household income
- $96,491
- Rent vs Own
- Severe rent burden
- 780.0
Population outlook (DeKalb County) Hauer SSP2
- Today (2025)
- 839,977 people
- By 2030
- 891,768 · +6.2%
- By 2040
- 988,894 · +17.7%
- By 2050
- 1,074,583 · +27.9%
- By 2075
- 1,245,026 · +48.2%
- By 2100
- 1,303,135 · +55.1%
Race, ethnicity, and origin ACS 2023
- Neighborhood character
- Diverse neighborhood (Simpson 0.56)
- Race & ethnicity
- Black 62% White 22% Asian 6% Hispanic / Latino 5% Two or more races 5%
- Common ancestry
- Slovak 1% Lithuanian 1% Serbian 1%
- Foreign-born
- 14% · Canada, China, South Korea
- Languages at home
- 86% English-only · Spanish 5% Other Indo-European 2% Other Asian/Pacific 1%
Political lean MEDSL · DeKalb
- 2024 margin
- Solid D (+64.8) · D 81.9% · R 17.1% · Other 1.0%
- 2008→2024 swing
- +6.1pp toward D · 2008: 58.6pp · 2024: 64.8pp
- All cycles
- 2024: D+64.8 2020: D+67.4 2016: D+64.8 2012: D+56.8 2008: D+58.6
Not yet ingested
- Civics
- —
Market trends
- HPI YoY
- ▼ -228.39%
- Current HPI
- 204.2122
- Rent YoY
- ▲ 1.30%
- Metro
- Atlanta-Sandy Springs-Alpharetta, GA
- State GDP YoY
- ▲ 2.66%
- F500 in state
- 28
Industry mix (Fortune 500 HQ in GA)
| Industry | F500 HQs | Revenue |
|---|---|---|
| Paper / Packaging | 2 | $29B |
|
||
| Retail | 1 | $160B |
|
||
| Transportation / Logistics | 1 | $91B |
|
||
| Airlines | 1 | $62B |
|
||
| Consumer Goods | 1 | $47B |
|
||
| Utilities | 1 | $25B |
|
||
Price history
+206.4% since first listed10 events — show timeline
- 2026-05-11 Price Changed $224,900 GAMLS
- 2026-04-18 Price Changed $234,900 GAMLS
- 2026-03-21 Price Changed $249,900 GAMLS
- 2026-02-19 Listed $254,900 GAMLS
- 2013-09-30 Sold (Public Records) $46,000 Public Records
- 2012-12-02 Listing Removed — GAMLS
- 2012-11-26 Sold (Public Records) $46,000 Public Records
- 2012-07-03 Listed $39,900 GAMLS
- 1999-10-13 Sold (Public Records) $96,500 Public Records
- 1985-05-22 Sold (Public Records) $73,400 Public Records
Property tax history
+6.3%/yrLatest (2025): $4,709 · +0.0% YoY. Source: county tax records.
Cash-flow waterfall
monthlySold comps — $/sqft
last 12 mo · ≤1 miLoading sold comps…