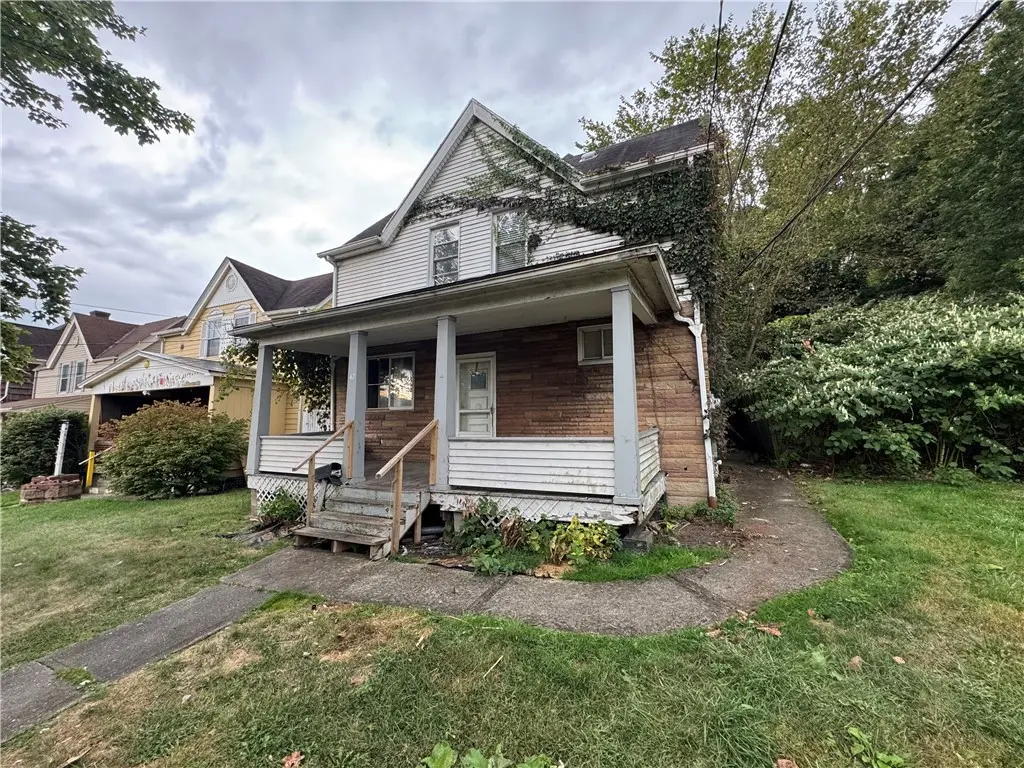
42 Sprague St · Wilmerding, PA
Flood risk 1/10 · Minimal
- FEMA flood zone
- X (unshaded)
- Chance of flooding over 30 yrs
- 0.0%
- Est. flood insurance / yr
- $473 – $860
Fire risk 1/10 · Minimal
- Est. fire insurance / yr
- $511 – $949
Heat risk 4/10 · Minor
- Hot days now (above 96°F)
- 7 days/yr
- Hot days in 30 yrs
- 19 days/yr
Wind risk 2/10 · Minimal
- Chance of severe wind over 30 yrs
- 0.0%
Air-quality risk 4/10 · Minor
- Unhealthy air days now
- 5 days/yr
- Unhealthy air days in 30 yrs
- 7 days/yr
Risk factors via First Street. Map © Google.
Why this score? — see what drove the B grade
The composite is a weighted blend of 9 inputs, each scored 0–100. Each bar is that input's sub-score; the figure is the points it added to the 100-point composite (weight × sub-score).
- Cash flow +30.0/30.0
- 1% rule +10.0/10.0
- DSCR +10.0/10.0
- ARV discount +7.5/15.0
- Appreciation +3.7/10.0
- Livability +3.5/5.0
- Rent growth +2.5/5.0
- Condition / age +2.5/5.0
- Schools +1.8/10.0
$42,000
🖨 Deal sheet 📄 Offer letter ✓ Due diligence
Listing remarks MLS
Strong rental market, it can be a good investment property. Large covered front porch enters into the living room on the left side of the home. The dining room leads to the kitchen and could be used as another living room. Kitchen can be an eat-in kitchen or extra space can be used for additional cabinet storage. The second floor is home to the three bedrooms and full bathroom.
Key facts
- 7,893 sq ft lot
- Built 1891
- Listed 276 days
Neighborhood map
What this means for you Summary
Snapshot
- This is a 3-bed/1.0-bath single-family listed at $42k.
Deal economics
- At list price, monthly cash flow is $637 ($8k/yr) — positive.
- The deal already cash-flows at list — no discount required.
- Meets the 1% rule at list price ($1k rent vs $42k).
- Recommended offer: $37k (12.0% below list) — sets the bar for market timing.
Location & tenants
- Location reads 70/100 on livability (#782 in PA) — a middle-class / working-renter tenant base. Strengths: crime A+, cost of living A+, housing A+; Watch: amenities F, commute F, employment F.
- East Allegheny SD (suburban): math 14% / reading 30% proficiency, ranked #485 of 539 in PA (top 90%) — low school quality limits family demand, transient renter base, plan for 1-2y turnover.
- Market conditions: 13 active listings in the ZIP; 12 comparable units currently listed for rent nearby; rentals lingering (median 44d on market — plan ~5-8 weeks vacancy on turnover, expect pricing pressure); 50% of comp listings sitting > 30 days — soft ceiling on asking rent; 2,996 units permitted in Allegheny County in 2024 (1,588 in 5+ unit buildings).
Forward outlook
- Local home prices are declining (-2.6%/yr); year-one equity from $290 of loan paydown is wiped out by about $1k of value loss. Plan a longer hold.
- At projected returns (-2.6% appreciation + 3.0% rent growth), your $12k cash investment doubles in ~2 years — after that, you're playing with house money.
Negotiation context
- It's been on market 276 days — a 12% lower offer ($37k) is reasonable based on typical stale-listing flexibility.
Risks & watch-outs
- Watch-outs: built in 1891 — expect roof / HVAC / electrical / plumbing capex.
Questions for the listing agent
- It's been on market 276 days. Have you received any prior offers? Is the seller open to a 12% concession, seller financing, or rate buy-down credit?
- Built in 1891 — when were the roof, HVAC, electrical panel, plumbing, and water heater last replaced?
- Why hasn't it sold? Are there any deal-killer items the seller is aware of (foundation, flood, title, zoning, code violations)?
- Is there a deadline driving the sale (1031 exchange, divorce, estate, relocation)? That informs how much negotiation room exists.
- Schools are B-rated — typically a magnet for longer-tenancy family renters. What's the average tenant stay here, and is there a school-zone premium baked into asking?
- What's the average days-on-market for RENTAL listings here right now (not sales)? A rising rental-DOM trend means longer vacancies and softer asking-rent achievability than the comps imply.
- What's the recent tenant-quality profile in this submarket — average credit score on applications, eviction rate, late-payment / NSF rate, and stable-employment percentage? A property-management company in the area should have these aggregated.
- How much new for-sale + rental construction is in the pipeline within 1–3 miles? Heavy new supply typically softens prices + rents 12–24 months out; constrained supply supports both.
Investment metrics
- 1% rule
- 2.72% ✓
- Cap rate
- 24.48%
- Cash-on-cash
- 64.95%
- DSCR
- 3.89
- GRM
- 3.1
CMA / ARV
- ARV (median comp)
- $91,193
- List price
- $42,000
- Delta
- -53.94%
- Verdict
- UNDERPRICED
- Comps
- 20 within 1.0 mi
Show comp detail 12 sales within ~0.75 mi
| Address | Dist | Beds/Ba | Sqft | Sold | Price | $/sf | Match |
|---|---|---|---|---|---|---|---|
| 47 Central Ave | 0.27mi | 3/1.0 | 1,292 (+2%) | 1mo | $194,500 | $151 | 82 |
| 518 Glenn St | 0.35mi | 3/1.0 | 1,216 (-4%) | 8mo | $110,000 | $90 | 71 |
| 1 2nd St | 0.47mi | 3/2.0 | 1,272 (+1%) | 3mo | $55,000 | $43 | 70 |
| 46 Sprague St | 0.01mi | 3/2.0 | 1,422 (+13%) | 11mo | $8,000 | $6 | 65 |
| 752 Middle Ave | 0.43mi | 2/2.0 (-1) | 1,192 (-5%) | 0mo | $36,000 | $30 | 62 |
| 275 Greensburg Pike | 0.61mi | 3/1.0 | 1,242 (-1%) | 10mo | $45,000 | $36 | 61 |
| 425 Routh Dr | 0.67mi | 3/1.5 | 1,251 (-1%) | 11mo | $182,500 | $146 | 56 |
| 801 Broadway Ave | 0.55mi | 3/1.0 | 1,144 (-9%) | 10mo | $92,000 | $80 | 51 |
| 704 Broadway Ave | 0.51mi | 3/1.5 | 1,388 (+10%) | 12mo | $195,000 | $140 | 48 |
| 160 Central Ave | 0.58mi | 3/1.0 | 1,134 (-10%) | 15mo | $134,000 | $118 | 44 |
| 454 A St | 0.68mi | 3/1.0 | 1,086 (-14%) | 2mo | $56,000 | $52 | 43 |
| 225 Miami St | 0.71mi | 2/2.0 (-1) | 1,321 (+5%) | 13mo | $127,200 | $96 | 39 |
Match score weights: distance 35% · size 25% · config 20% · recency 20%. Top-matched comps best support the ARV.
Projected returns pro-forma
-2.6% appreciation · 3.0% rent growth · sell at horizon
- IRR
- 64.5%
- Equity multiple
- 3.93×
- Total profit
- $34,437
- Equity at exit
- $7,008
- IRR
- 68.5%
- Equity multiple
- 8.04×
- Total profit
- $82,803
- Equity at exit
- $4,926
Cash invested: $11,760 (down + closing). Projections, not guarantees.
Landlord ↔ Tenant lean methodology
- Overall (STATE)
- 62 Landlord-Friendly
- State Pennsylvania
- 62 Landlord-Friendly · EVEN
- County
- — inherits STATE
- City
- — inherits STATE
ZIP-level market 15148
- Home prices YoY
- -1.8%
- Active inventory
- 13
- Price-to-rent
- 3.1×
Monthly cashflow live
- Estimated rent
- $1,142 high interval (Pro) →
- Mortgage (P&I)
- −$220
- Tax from tax record
- −$28 /mo · $336/yr
- Insurance
- −$18
- HOA
- −$0
- Vacancy / Maint / Mgmt
- −$240
- Net cashflow
- $637
Break-even live
UW: 25.0% down · 7.5% · 30yr · 1.5% tax · 5.0% vac · 8.0% maint · 8.0% mgmt
Financing live
Cash to close
- Down payment
- $10,500
- Closing costs
- $1,260
- Reserves months
- —
- Total cash needed
- —
Loan-product check · same deal, 3 products live
Conventional
25% down · 7.5% · 30yr
- Down + closing
- —
- Monthly P&I
- —
- Monthly cashflow
- —
- DSCR
- —
- Eligible?
- —
Personal DTI + credit; lowest rate.
DSCR
20% down · 8.5% · 30yr
- Down + closing
- —
- Monthly P&I
- —
- Monthly cashflow
- —
- DSCR
- —
- Eligible?
- —
No personal income docs; deal must DSCR.
Hard money
10% down · 12.0% · 12mo
- Down + closing
- —
- Monthly P&I
- —
- Monthly cashflow
- —
- DSCR
- —
- Eligible?
- —
Short-term bridge; refi at stabilization.
Rent comps 12 comps
| Address | Beds | Baths | Sqft | Rent | $/sqft | DOM | Units | Dist |
|---|---|---|---|---|---|---|---|---|
| 165 State St Wilmerding, PA | 3.0 | 1.0 | 1100 | $995 | $0.90 | 17d | 1 | 0.43mi |
| 400 Greensburg Pike North Versailles, PA | 3.0 | 1.0 | 1324 | $1,250 | $0.94 | 43d | 1 | 0.58mi |
| 1806 Greensburg Ave North Versailles Township, PA | 1.0–2.0 | 1.0 | 750 | $1,015 | $1.35 | 1d | 10 | 0.58mi |
| 569 Woodmont Ave Unit C East McKeesport, PA | 2.0 | 1.0 | 1000 | $1,000 | $1.00 | 17d | 1 | 0.73mi |
| 569 Woodmont Ave Apt B East McKeesport, PA | 2.0 | 1.0 | 1000 | $1,200 | $1.20 | 17d | 1 | 0.73mi |
| 215 Grant St Wall, PA | 2.0 | 2.5 | 960 | $750 | $0.78 | 43d | 1 | 0.78mi |
| 1615 Lynn Ave Unit 2 Turtle Creek, PA | 2.0 | 1.0 | 1100 | $1,145 | $1.04 | 43d | 1 | 0.93mi |
| 906 Penn Ave Unit A Turtle Creek, PA | 2.0 | 2.0 | 1122 | $1,250 | $1.11 | 43d | 1 | 1.03mi |
| 906 Penn Ave Unit D Turtle Creek, PA | 3.0 | 2.0 | 1277 | $1,400 | $1.10 | 43d | 1 | 1.03mi |
| 200 Delaware Ave North Versailles, PA | 3.0 | 1.5 | 1470 | $1,450 | $0.99 | 14d | 1 | 1.19mi |
| 342 Kenyon St Turtle Creek, PA | 1.0–2.0 | 1.0 | 850 | $1,155 | $1.36 | 14d | 6 | 1.25mi |
| 287 Palma St North Versailles, PA | 3.0 | 1.5 | 1008 | $1,395 | $1.38 | 43d | 1 | 1.31mi |
Listing history 16 events
-
2026-06-18days on market $42,000 Active 276 DOM
-
2026-06-17days on market $42,000 Active 275 DOM
-
2026-06-16days on market $42,000 Active 274 DOM
-
2026-06-15days on market $42,000 Active 273 DOM
-
2026-06-13days on market $42,000 Active 271 DOM
-
2026-06-09days on market $42,000 Active 267 DOM
-
2026-06-08days on market $42,000 Active 266 DOM
-
2026-06-07days on market $42,000 Active 265 DOM
-
2026-06-03days on market $42,000 Active 261 DOM
-
2026-06-02days on market $42,000 Active 260 DOM
-
2026-06-01days on market $42,000 Active 259 DOM
-
2026-05-31days on market $42,000 Active 258 DOM
-
2025-11-12price $45,000 380-char remark
Show marketing remark (380 chars)
Strong rental market, it can be a good investment property. Large covered front porch enters into the living room on the left side of the home. The dining room leads to the kitchen and could be used as another living room. Kitchen can be an eat-in kitchen or extra space can be used for additional cabinet storage. The second floor is home to the three bedrooms and full bathroom.
-
2025-10-29price $49,900 380-char remark
Show marketing remark (380 chars)
Strong rental market, it can be a good investment property. Large covered front porch enters into the living room on the left side of the home. The dining room leads to the kitchen and could be used as another living room. Kitchen can be an eat-in kitchen or extra space can be used for additional cabinet storage. The second floor is home to the three bedrooms and full bathroom.
-
2025-10-13price $54,900 380-char remark
Show marketing remark (380 chars)
Strong rental market, it can be a good investment property. Large covered front porch enters into the living room on the left side of the home. The dining room leads to the kitchen and could be used as another living room. Kitchen can be an eat-in kitchen or extra space can be used for additional cabinet storage. The second floor is home to the three bedrooms and full bathroom.
-
2025-09-15$59,900 Active 380-char remark
Show marketing remark (380 chars)
Strong rental market, it can be a good investment property. Large covered front porch enters into the living room on the left side of the home. The dining room leads to the kitchen and could be used as another living room. Kitchen can be an eat-in kitchen or extra space can be used for additional cabinet storage. The second floor is home to the three bedrooms and full bathroom.
ⓘ Source: listings_history table (triggers on properties + properties_extension) + one-shot
backfill from property_details.listing_events for pre-trigger history.
Tax reassessment forecast PA · Partial reset (capped growth)
- Current annual tax
- $336 · $28/mo
- Projected year-2 tax
- $500 · $42/mo
- Expected delta
- +$164/yr (+$14/mo · 48.8%)
ⓘ Screening estimate from a state-policy table — verify with the county assessor before closing.
Climate risk First Street
- Flood 1/10 Low FEMA zone X (unshaded) · 0% chance over 30 yrs
- Wildfire 1/10 Low
- Heat 4/10 Moderate 7 d/yr ≥96°F today · 19 d/yr by 30 yrs out
- Wind 2/10 Low 0% chance of damaging wind over 30 yrs
- Air quality 4/10 Moderate 5 unhealthy d/yr today · 7 by 30 yrs out
Nearby sold comps map
Loading sold comps map…
Walkable amenities ~0.75 mi
Loading nearby amenities…
Taxation est. · year 1
- Rental income
- $13,705
- − Mortgage interest
- −$2,353
- − Property taxes
- −$336
- − Insurance
- −$210
- − Repairs & maintenance
- −$1,096
- − Management
- −$1,096
- − Depreciation
- −$1,222
- Taxable income
- $7,392
- Est. tax owed @ 24.0%
- −$1,774
- After-tax cash flow
- $5,864/yr
For passive investors: Depreciation is non-cash, so a rental often shows a tax loss while cash-flowing — sheltering income. Rental losses are passive: they offset passive income freely, and up to $25,000/yr can offset ordinary (W-2) income if you actively participate and your MAGI is under $100k (phasing out to $0 by $150k); unused losses carry forward. On sale, claimed depreciation is recaptured at up to 25%, and gains may owe capital-gains tax (a 1031 exchange can defer both). Figures are a year-1 estimate at your 24.0% rate — not tax advice; consult a CPA.
Schools (NCES district)
- District
- East Allegheny SD
- NCES district ID
- 4208060
- Math proficiency
- 14% ▼ -13.00%
- Reading proficiency
- 30% ▼ -19.00%
- Median HH income
- $38,748
- Composite
- 18.44/100
- National rank
- #8930
- State rank
- #485 of 539 in PA
Livability — Wilmerding
- Score
- 70/100
- State rank
- #782
- US rank
- #7877
Category grades
Schools grade is shown separately in the Schools card above.
Census & demographics
- Census place
- Wilmerding, PA
- Population (ZIP)
- 2,287
Population outlook (Allegheny County) Hauer SSP2
- Today (2025)
- 1,250,282 people
- By 2030
- 1,256,482 · +0.5%
- By 2040
- 1,256,318 · +0.5%
- By 2050
- 1,244,169 · -0.5%
- By 2075
- 1,197,693 · -4.2%
- By 2100
- 1,093,187 · -12.6%
Race, ethnicity, and origin ACS 2023
- Neighborhood character
- Predominantly White (71%)
- Race & ethnicity
- White 71% Black 25% Two or more races 3% Hispanic / Latino 2%
- Common ancestry
- Romanian 6% Slovak 2% Iranian 1%
- Foreign-born
- 1%
- Languages at home
- 97% English-only · Spanish 2%
Political lean MEDSL · Allegheny
- 2024 margin
- Strong D (+20.3) · D 59.7% · R 39.4%
- 2008→2024 swing
- +4.8pp toward D · 2008: 15.5pp · 2024: 20.3pp
- All cycles
- 2024: D+20.3 2020: D+20.4 2016: D+16.4 2012: D+14.4 2008: D+15.5
Not yet ingested
- Civics
- —
Market trends
- HPI YoY
- ▼ -2.60%
- Current HPI
- 138.7635
- Rent YoY
- —
- Metro
- —
- State GDP YoY
- ▲ 1.68%
- F500 in state
- 34
Industry mix (Fortune 500 HQ in PA)
| Industry | F500 HQs | Revenue |
|---|---|---|
| Healthcare | 2 | $309B |
|
||
| Insurance | 2 | $27B |
|
||
| Telecommunications / Media | 1 | $124B |
|
||
| Industrial Distribution | 1 | $22B |
|
||
| Financial Services | 1 | $20B |
|
||
| Chemicals / Materials | 1 | $18B |
|
||
Price history
-24.9% since first listed4 events — show timeline
- 2025-11-12 Price Changed $45,000 West Penn MLS
- 2025-10-29 Price Changed $49,900 West Penn MLS
- 2025-10-13 Price Changed $54,900 West Penn MLS
- 2025-09-15 Listed $59,900 West Penn MLS
Property tax history
+1.2%/yrLatest (2026): $336 · +1.1% YoY. Source: county tax records.
Cash-flow waterfall
monthlySold comps — $/sqft
last 12 mo · ≤1 miLoading sold comps…