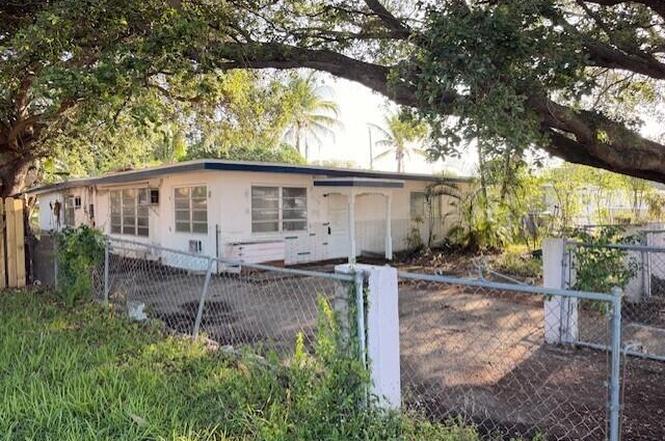
6309 Hayes St · Hollywood, FL
Flood risk 1/10 · Minimal
- FEMA flood zone
- X (shaded)
- Chance of flooding over 30 yrs
- 0.0%
- Est. flood insurance / yr
- $507 – $1,088
Fire risk 1/10 · Minimal
- Est. fire insurance / yr
- $947 – $1,759
Heat risk 10/10 · Severe
- Hot days now (above 105°F)
- 7 days/yr
- Hot days in 30 yrs
- 27 days/yr
Wind risk 10/10 · Severe
- Chance of severe wind over 30 yrs
- 99.0%
Air-quality risk 2/10 · Minimal
- Unhealthy air days now
- 2 days/yr
- Unhealthy air days in 30 yrs
- 2 days/yr
Risk factors via First Street. Map © Google.
Why this score? — see what drove the F grade
The composite is a weighted blend of 9 inputs, each scored 0–100. Each bar is that input's sub-score; the figure is the points it added to the 100-point composite (weight × sub-score).
- ARV discount +7.5/15.0
- Cash flow +6.9/30.0
- Schools +4.1/10.0
- Livability +3.8/5.0
- Rent growth +2.8/5.0
- Condition / age +2.5/5.0
- 1% rule +1.2/10.0
- DSCR +1.1/10.0
- Appreciation +0.0/10.0
$415,900
🖨 Deal sheet (PDF) 📄 Offer letter ✓ Due diligence
Listing remarks
New roof permit just closed out. Large house with shed in the back. Condition is dated, but one of the best values in the area if you looking for a large size house with low price and the opportunity to renovate and add your own value. Centrally located near Hard Rock Casino, shopping, schools, dining, Ft. Lauderdale Airport and Florida's turnpike and I -95.
Key facts
- New roof permit
- Large house
- Shed in the back
Tags
Property features AI
Finance
- HOA & community: No association amenities
Exterior
- Parking: Driveway
- Utilities: Public water
- Home design: Single-family residence; One story; First-floor entry; South-facing
- Construction: Block construction; Flat roof; Resale property; Built prior to current listing (one-story structure)
- Exterior features: Porch; Outbuilding
Interior
- Kitchen: Gas range
- Bedrooms: 4 bedrooms (all on the main/first floor)
- Flooring: Tile
- Bathrooms: 3 full bathrooms (all on the main/first floor)
- Heating & cooling: Wall/Window air conditioning units
- Interior features: Water purifier; Water softener
- Laundry & utility: Washer hookup; Dryer hookup
Neighborhood map
What this means for you Summary
Snapshot
- This is a 2-bed/1.0-bath single-family listed at $416k.
Deal economics
- At list price, monthly cash flow is $-635 ($-8k/yr) — negative.
- To cash-flow at today's rent, offer at most $304k (27.0% below list).
- To meet the 1% rule (rent ≥ 1% of price), the offer needs to be $260k (37.6% below list).
- Recommended offer: $260k (37.6% below list) — sets the bar for 1% rule.
- Cap rate 4.5% vs local median 3.2% in Hollywood — top-decile yield for the area; either an underpriced asset or a hidden risk that comps aren't pricing in. Stress-test before assuming the spread holds.
Location & tenants
- Location reads 76/100 on livability (#232 in FL, #3,548 nationally) — a middle-class / working-renter tenant base. Strengths: commute A+, housing A+, crime B+; Watch: amenities D.
- Broward (suburban): math 42% / reading 53% proficiency, ranked #46 of 73 in FL (top 63%) — families likely to look elsewhere, expect single-tenant / working-renter base with shorter leases.
- Zoned schools: West Hollywood Elementary School (math 27% / reading 27%, grade F, #1,969 of 2,144 statewide, top 94%, 471 students, 76% FRL); Apollo Middle School (math 35% / reading 47%, grade F, #353 of 571 statewide, top 63%, 1,168 students, 71% FRL); Mcarthur High School (math 18% / reading 39%, grade F, #458 of 667 statewide, top 69%, 2,050 students, 67% FRL) — zoned schools average 71% FRL vs 51% district-wide (20 pts higher); higher-poverty schools than district average — tighter screening recommended.
- Zoned-school proficiency averages 32% at this address vs 48% district-wide (-15 pts) — the specific schools serving this property underperform the Broward average; the district grade overstates school quality for this exact location.
- Market conditions: Rents rising (+1.0%/yr); 338 active listings in the ZIP; 40 comparable units currently listed for rent nearby; rentals at typical pace (median 24d on market — plan ~3-4 weeks tenant-placement turnaround); solid renter incomes; 2,111 units permitted in Broward County in 2024 (1,265 in 5+ unit buildings).
- This rent runs 39% of the median local income ($80k/yr) — at the standard rent-burdened threshold; future hikes will face affordability resistance.
Forward outlook
- Local home prices are declining (-3.0%/yr); year-one equity from $3k of loan paydown is wiped out by about $12k of value loss. Plan a longer hold.
- Broward County population projected at +34% by 2050 — long-run rental-demand tailwind backs the buy-and-hold thesis.
Negotiation context
- It's been on market 102 days — a 9% lower offer ($378k) is reasonable based on typical stale-listing flexibility.
- Current owner paid $56k; list at $416k implies a 643% gain — meaningful room to come down on a strong offer.
Risks & watch-outs
- Watch-outs: built in 1955 — expect roof / HVAC / electrical / plumbing capex.
- Climate carrying-cost: severe wind risk, 99% chance of damaging wind over 30y; extreme-heat days projected 7→27/yr by 2055 (HVAC capex compounding) — expect insurance premiums to compound above CPI over the hold.
Questions for the listing agent
- What do current leases actually rent for vs. the listed asking? Can we see a recent rent roll and the last 12 months of T-12 income?
- It's been on market 102 days. Have you received any prior offers? Is the seller open to a 38% concession, seller financing, or rate buy-down credit?
- Built in 1955 — when were the roof, HVAC, electrical panel, plumbing, and water heater last replaced?
- Why hasn't it sold? Are there any deal-killer items the seller is aware of (foundation, flood, title, zoning, code violations)?
- Is there a deadline driving the sale (1031 exchange, divorce, estate, relocation)? That informs how much negotiation room exists.
- The area grade is low — what's the realistic commute time and amenity access for the typical tenant pool here? Any planned neighborhood developments (good or bad) we should know about?
- What's the average days-on-market for RENTAL listings here right now (not sales)? A rising rental-DOM trend means longer vacancies and softer asking-rent achievability than the comps imply.
- What's the recent tenant-quality profile in this submarket — average credit score on applications, eviction rate, late-payment / NSF rate, and stable-employment percentage? A property-management company in the area should have these aggregated.
- How much new for-sale + rental construction is in the pipeline within 1–3 miles? Heavy new supply typically softens prices + rents 12–24 months out; constrained supply supports both.
Investment metrics
- 1% rule
- 0.62% ✗
- Cap rate
- 4.46%
- Cash-on-cash
- -6.54%
- DSCR
- 0.71
- GRM
- 13.4
CMA / ARV
No comps found within radius.
Projected returns pro-forma
-3.0% appreciation · 1.01% rent growth · sell at horizon
- IRR
- -29.7%
- Equity multiple
- 0.03×
- Total profit
- $-113,006
- Equity at exit
- $62,012
- IRR
- -40.7%
- Equity multiple
- -0.47×
- Total profit
- $-170,880
- Equity at exit
- $35,959
Cash invested: $116,452 (down + closing). Projections, not guarantees.
Landlord ↔ Tenant lean methodology
- Overall (STATE)
- 87 Strongly Landlord-Friendly
- State Florida
- 87 Strongly Landlord-Friendly · R+3
- County
- — inherits STATE
- City
- — inherits STATE
ZIP-level market 33024
- Rents YoY
- 1.0%
- Active inventory
- 338
- Price-to-rent
- 13.4×
Monthly cashflow live
- Estimated rent
- $2,595 high interval (Pro) →
- Mortgage (P&I)
- −$2,181
- Tax from tax record
- −$331 /mo · $3,972/yr
- Insurance
- −$173
- HOA
- −$0
- Vacancy / Maint / Mgmt
- −$545
- Net cashflow
- $-635
Break-even live
Sensitivity live
| Price | -10% $-400 | -5% $-517 | +0% $-635 | +5% $-753 | +10% $-870 |
|---|---|---|---|---|---|
| Rent | -10% $-840 | -5% $-737 | +0% $-635 | +5% $-532 | +10% $-430 |
| Rate | -1.0pp $-425 | -0.5pp $-529 | base $-635 | +0.5pp $-743 | +1.0pp $-852 |
UW: 25.0% down · 7.5% · 30yr · 1.5% tax · 5.0% vac · 8.0% maint · 8.0% mgmt
Financing live
Cash to close
- Down payment
- $103,975
- Closing costs
- $12,477
- Reserves months
- —
- Total cash needed
- —
Loan-product check · same deal, 3 products live
Conventional
25% down · 7.5% · 30yr
- Down + closing
- —
- Monthly P&I
- —
- Monthly cashflow
- —
- DSCR
- —
- Eligible?
- —
Personal DTI + credit; lowest rate.
DSCR
20% down · 8.5% · 30yr
- Down + closing
- —
- Monthly P&I
- —
- Monthly cashflow
- —
- DSCR
- —
- Eligible?
- —
No personal income docs; deal must DSCR.
Hard money
10% down · 12.0% · 12mo
- Down + closing
- —
- Monthly P&I
- —
- Monthly cashflow
- —
- DSCR
- —
- Eligible?
- —
Short-term bridge; refi at stabilization.
Rent comps 40 comps
| Address | Beds | Baths | Sqft | Rent | $/sqft | DOM | Units | Dist |
|---|---|---|---|---|---|---|---|---|
| 6332 Garfield St Hollywood, FL | 3.0 | 2.0 | 1064 | $3,000 | $2.82 | 25d | 1 | 0.04mi |
| 6238 Hayes St Unit 1 Hollywood, FL | 1.0 | 1.0 | 1340 | $1,800 | $1.34 | 9d | 1 | 0.09mi |
| 6234 Hayes St Hollywood, FL | 3.0 | 2.0 | 1210 | $3,000 | $2.48 | 23d | 1 | 0.10mi |
| 6431 Hayes St Hollywood, FL | 2.0 | 1.0 | 1328 | $2,500 | $1.88 | 9d | 1 | 0.12mi |
| 6431 Hayes St Hollywood, FL | 2.0 | 1.0 | 1328 | $2,500 | $1.88 | 15d | 1 | 0.12mi |
| 1300 N 64th Ave Hollywood, FL | 3.0 | 2.0 | 1549 | $3,300 | $2.13 | 23d | 1 | 0.12mi |
| 720 N 64th Ave Hollywood, FL | 3.0 | 2.0 | 1305 | $3,300 | $2.53 | 23d | 1 | 0.26mi |
| 6331 Pierce St Unit 1 Hollywood, FL | 2.0 | 2.0 | 2170 | $2,100 | $0.97 | 6d | 1 | 0.31mi |
| 5xx8 Grant St Pembroke Pines, FL | 2.0 | 1.0 | 1716 | $2,200 | $1.28 | 25d | 1 | 0.33mi |
| 6328 Pierce St Unit 0 Hollywood, FL | 3.0 | 2.0 | 2101 | $2,700 | $1.29 | 6d | 1 | 0.34mi |
| 6328 Pierce St Unit 0 Hollywood, FL | 3.0 | 2.0 | 2101 | $2,800 | $1.33 | 25d | 1 | 0.34mi |
| 1121 N 66th Ter Hollywood, FL | 3.0 | 2.0 | 1495 | $3,500 | $2.34 | 20d | 1 | 0.35mi |
| 710 N 65th Ter Hollywood, FL | 3.0 | 2.0 | 1080 | $3,250 | $3.01 | 25d | 1 | 0.42mi |
| 1810 N 62nd Ave Hollywood, FL | 3.0 | 2.0 | 1130 | $3,250 | $2.88 | 25d | 1 | 0.46mi |
| 6237 Polk St Unit REAR Hollywood, FL | 3.0 | 2.0 | 2026 | $2,650 | $1.31 | 23d | 1 | 0.52mi |
| 6761 Branch St Hollywood, FL | 3.0 | 2.0 | 1182 | $1,500 | $1.27 | 23d | 1 | 0.54mi |
| 1910 N 61st Ter Hollywood, FL | 3.0 | 2.0 | 1150 | $2,700 | $2.35 | 25d | 1 | 0.55mi |
| 1920 N 65th Way Hollywood, FL | 2.0 | 1.0 | 1589 | $2,100 | $1.32 | 9d | 1 | 0.55mi |
| 1920 N 65th Way Hollywood, FL | 2.0 | 1.0 | 1589 | $2,300 | $1.45 | 25d | 1 | 0.55mi |
| 414 NW 60th Way Unit 2 Hollywood, FL | 2.0 | 1.0 | 1749 | $2,400 | $1.37 | 25d | 1 | 0.57mi |
| 5926-5934 Taft St Hollywood, FL | 2.0 | 2.0 | 1100 | $2,150 | $1.95 | 25d | 1 | 0.58mi |
| 304 N 61st Ter Unit 324 Hollywood, FL | 3.0 | 2.0 | 1420 | $2,700 | $1.90 | 25d | 1 | 0.59mi |
| 400 N 60th Way Unit A Hollywood, FL | 2.0 | 1.5 | 1566 | $2,300 | $1.47 | 25d | 1 | 0.59mi |
| 719 Glenn Pkwy Hollywood, FL | 3.0 | 2.0 | 1276 | $2,900 | $2.27 | 25d | 1 | 0.61mi |
| 5860 Lincoln St Hollywood, FL | 3.0 | 2.5 | 1200 | $2,900 | $2.42 | 25d | 1 | 0.63mi |
| 6036 Polk St #1 Hollywood, FL | 1.0 | 1.0 | 1392 | $1,700 | $1.22 | 25d | 1 | 0.65mi |
| 1630 N 68th Ave Hollywood, FL | 3.0 | 2.0 | 1140 | $3,200 | $2.81 | 9d | 1 | 0.68mi |
| 5815 Lincoln St Unit B Hollywood, FL | 3.0 | 3.0 | 1475 | $3,200 | $2.17 | 6d | 1 | 0.69mi |
| 5749-5753 Grant St Hollywood, FL | 2.0 | 1.0 | 2141 | $2,200 | $1.03 | 14d | 1 | 0.72mi |
| 5842 Harding St Unit R Hollywood, FL | 1.0 | 1.0 | 1875 | $1,350 | $0.72 | 11d | 1 | 0.73mi |
| 5914 Taylor St Unit 1-2 Hollywood, FL | 3.0 | 2.0 | 2250 | $2,750 | $1.22 | 21d | 1 | 0.74mi |
| 5743 Lincoln St Unit 1 Hollywood, FL | 2.0 | 1.0 | 1728 | $2,250 | $1.30 | 19d | 1 | 0.74mi |
| 101 SW 64th Ave Pembroke Pines, FL | 3.0 | 2.0 | 1490 | $3,200 | $2.15 | 12d | 1 | 0.74mi |
| 101 SW 64th Ave Pembroke Pines, FL | 3.0 | 2.0 | 1490 | $3,300 | $2.21 | 16d | 1 | 0.74mi |
| 630 N 58th Ave Hollywood, FL | 2.0 | 1.0 | 2208 | $2,100 | $0.95 | 9d | 1 | 0.75mi |
| 6740 Park St Unit 1 Hollywood, FL | 3.0 | 2.0 | 1228 | $2,750 | $2.24 | 25d | 1 | 0.75mi |
| 201 Columbus Pkwy Unit A Hollywood, FL | 1.0 | 1.0 | 1662 | $1,850 | $1.11 | 5d | 1 | 0.79mi |
| 201 Columbus Pkwy Unit A Hollywood, FL | 1.0 | 1.0 | 1662 | $2,350 | $1.41 | 16d | 1 | 0.79mi |
| 201 Columbus Pkwy Unit B Hollywood, FL | 1.0 | 1.0 | 1662 | $2,050 | $1.23 | 4d | 1 | 0.79mi |
| 201 Columbus Pkwy Unit B Hollywood, FL | 2.0 | 2.0 | 1100 | $2,800 | $2.55 | 25d | 1 | 0.79mi |
Listing history 17 events
-
2026-06-21days on market $415,900 Active 102 DOM
-
2026-06-18days on market $415,900 Active 99 DOM
-
2026-06-17days on market $415,900 Active 98 DOM
-
2026-06-16days on market $415,900 Active 97 DOM
-
2026-06-15days on market $415,900 Active 96 DOM
-
2026-06-13days on market $415,900 Active 94 DOM
-
2026-06-09days on market $415,900 Active 90 DOM
-
2026-06-07days on market $415,900 Active 88 DOM
-
2026-06-04days on market $415,900 Active 85 DOM
-
2026-06-03days on market $415,900 Active 84 DOM
-
2026-06-02days on market $415,900 Active 83 DOM
-
2026-06-01days on market $415,900 Active 82 DOM
-
2026-05-31days on market $415,900 Active 81 DOM
-
2026-05-08price $415,900
-
2026-04-23price $409,000
-
2026-01-21$395,000 Active
-
1984-10-01soldstatus $56,000
ⓘ Source: listings_history table (triggers on properties + properties_extension) + one-shot
backfill from property_details.listing_events for pre-trigger history.
Tax reassessment forecast FL · Resets to sale price
- Current annual tax
- $3,972 · $331/mo
- Projected year-2 tax
- $3,972 · $331/mo
- Expected delta
- $0/yr ($0/mo · 0.0%)
ⓘ Screening estimate from a state-policy table — verify with the county assessor before closing.
Climate risk First Street
- Flood 1/10 Low FEMA zone X (shaded) · 0% chance over 30 yrs
- Wildfire 1/10 Low
- Heat 10/10 Extreme 7 d/yr ≥105°F today · 27 d/yr by 30 yrs out
- Wind 10/10 Extreme 99% chance of damaging wind over 30 yrs
- Air quality 2/10 Low 2 unhealthy d/yr today · 2 by 30 yrs out
Nearby sold comps map
Loading sold comps map…
Walkable amenities ~0.75 mi
Loading nearby amenities…
Taxation est. · year 1
- Rental income
- $31,145
- − Mortgage interest
- −$23,297
- − Property taxes
- −$3,972
- − Insurance
- −$2,080
- − Repairs & maintenance
- −$2,492
- − Management
- −$2,492
- − Depreciation
- −$12,099
- Taxable loss
- −$15,285
- Est. tax savings @ 24.0%
- +$3,669
- After-tax cash flow
- $-3,951/yr
For passive investors: Depreciation is non-cash, so a rental often shows a tax loss while cash-flowing — sheltering income. Rental losses are passive: they offset passive income freely, and up to $25,000/yr can offset ordinary (W-2) income if you actively participate and your MAGI is under $100k (phasing out to $0 by $150k); unused losses carry forward. On sale, claimed depreciation is recaptured at up to 25%, and gains may owe capital-gains tax (a 1031 exchange can defer both). Figures are a year-1 estimate at your 24.0% rate — not tax advice; consult a CPA.
Schools (NCES district)
- District
- Broward
- NCES district ID
- 1200180
- Math proficiency
- 42% ▼ -18.00%
- Reading proficiency
- 53% ▼ -5.00%
- Median HH income
- $52,139
- Composite
- 40.88/100
- National rank
- #3621
- State rank
- #46 of 73 in FL
Livability — Hollywood
- Score
- 76/100
- State rank
- #232
- US rank
- #3548
Category grades
Schools grade is shown separately in the Schools card above.
Census & demographics
- Census place
- Hollywood, FL
- County
- Broward County · 1,963,430 people
- City population
- 109,079
- Metro
- Miami-Fort Lauderdale-Pompano Beach, FL
- Population (ZIP)
- 76,585
- Household income
- $80,061
- Rent vs Own
- Severe rent burden
- 2813.0
Population outlook (Broward County) Hauer SSP2
- Today (2025)
- 2,207,033 people
- By 2030
- 2,360,704 · +7.0%
- By 2040
- 2,661,208 · +20.6%
- By 2050
- 2,946,698 · +33.5%
- By 2075
- 3,602,273 · +63.2%
- By 2100
- 3,970,984 · +79.9%
Race, ethnicity, and origin ACS 2023
- Neighborhood character
- Diverse neighborhood (Simpson 0.65)
- Race & ethnicity
- Hispanic / Latino 52% Two or more races 23% White 22% Black 17% Asian 4%
- Hispanic origin (detail)
- Mexican 3% Puerto Rican 7% Cuban 13% Dominican 5%
- Common ancestry
- Hispanic 4% Romanian 2% Estonian 1%
- Foreign-born
- 40% · Canada, Jamaica, Dominican Republic
- Languages at home
- 44% English-only · Spanish 46% French/Haitian/Cajun 5% Other Indo-European 3%
Political lean MEDSL · Broward
- 2024 margin
- D (+17.0) · D 58.0% · R 41.0%
- 2008→2024 swing
- -17.8pp toward R · 2008: 34.7pp · 2024: 17.0pp
- All cycles
- 2024: D+17.0 2020: D+29.8 2016: D+35.0 2012: D+34.9 2008: D+34.7
Not yet ingested
- Civics
- —
Market trends
- HPI YoY
- ▼ -442.20%
- Current HPI
- 464.3405
- Rent YoY
- ▲ 1.01%
- Metro
- Miami-Fort Lauderdale-Pompano Beach, FL
- State GDP YoY
- ▲ 3.28%
- F500 in state
- 36
Industry mix (Fortune 500 HQ in FL)
| Industry | F500 HQs | Revenue |
|---|---|---|
| Industrial Technology | 2 | $29B |
|
||
| Insurance | 2 | $17B |
|
||
| Retail | 1 | $60B |
|
||
| Technology Distribution | 1 | $58B |
|
||
| Homebuilding | 1 | $35B |
|
||
| Technology Manufacturing | 1 | $35B |
|
||
Price history
+642.7% since first listed4 events — show timeline
- 2026-05-08 Price Changed $415,900 Beaches MLS
- 2026-04-23 Price Changed $409,000 Beaches MLS
- 2026-01-21 Listed $395,000 Beaches MLS
- 1984-10-01 Sold (Public Records) $56,000 Public Records
Property tax history
+11.1%/yrLatest (2025): $3,972 · +2.9% YoY. Source: county tax records.
Cash-flow waterfall
monthlySold comps — $/sqft
last 12 mo · ≤1 miLoading sold comps…