 Multi-family
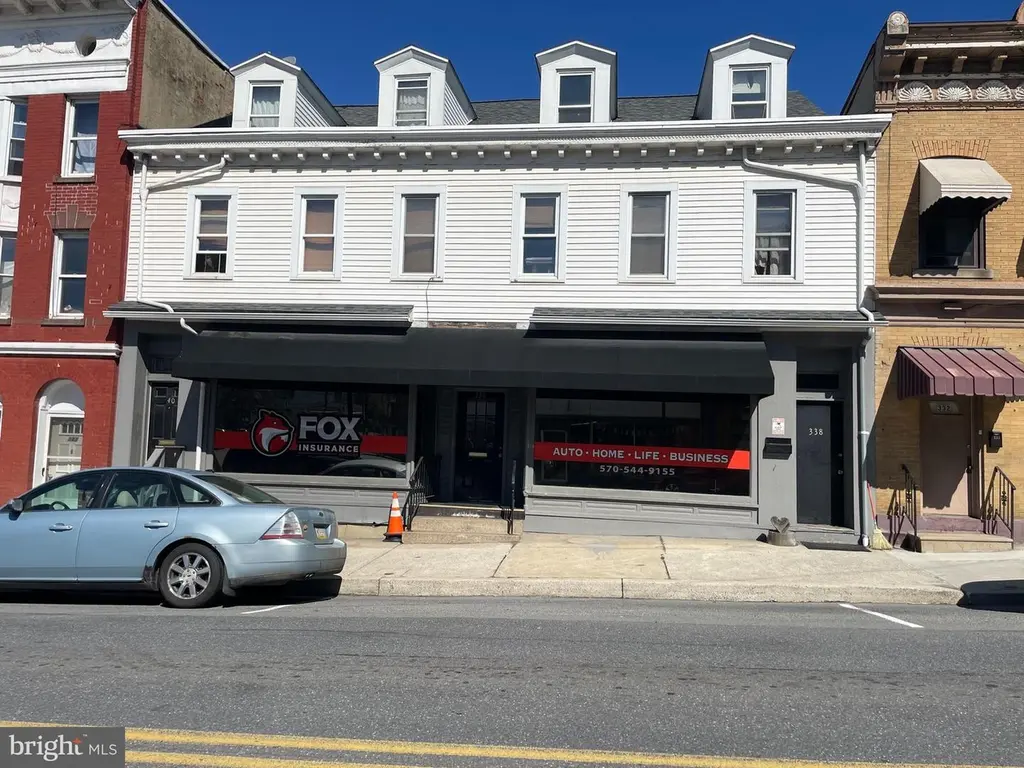
340 S Sunbury St · Minersville, PA
Flood risk No data
- FEMA flood zone
- —
- Chance of flooding over 30 yrs
- —
- Est. flood insurance / yr
- —
Fire risk No data
- Est. fire insurance / yr
- —
Heat risk No data
- Hot days now (above threshold)
- —
- Hot days in 30 yrs
- —
Wind risk No data
- Chance of severe wind over 30 yrs
- —
Air-quality risk No data
- Unhealthy air days now
- —
- Unhealthy air days in 30 yrs
- —
Risk factors via First Street. Map © Google.
Why this score? — see what drove the B- grade
The composite is a weighted blend of 9 inputs, each scored 0–100. Each bar is that input's sub-score; the figure is the points it added to the 100-point composite (weight × sub-score).
- Cash flow +30.0/30.0
- DSCR +10.0/10.0
- 1% rule +9.2/10.0
- Appreciation +7.3/10.0
- Livability +3.5/5.0
- Schools +3.0/10.0
- Rent growth +2.5/5.0
- Condition / age +2.2/5.0
- ARV discount +0.0/15.0
$275,000
🖨 Deal sheet 📄 Offer letter ✓ Due diligence
Multi-family units
County records classify this as Multi-Family (2-4 Unit). Listing-text estimate: 1 unit. estimate disagrees with records
Listing remarks MLS
Main address is 336 Sunbury St. Great investment opportunity! 3 units on Sunbury St in Minersville with 2 car garage and yard! Owner currently occupies commercial space and wants to stay as a tenant with a long-term lease! 2nd & 3rd Floor is a HUGE 3 bedroom apartment with 3 full unfinished rooms in the attic rented for $700/mo. 1 bedroom apt on first floor is rented for $600/mo has basement access, use of the yard & 2 car garage. Commercial space has been updated and remodeled. Apartments have been leased by the same tenants since before the owner bought the property so those haven't been updated but are serviceable. Laundry in both units. Owner pays WST and tenant pays electric. New roof 2019. Commercial space has mini-splits for heat and air-conditioning. Apts are electric baseboard heat and paid for by tenant. Garage could potentially be rented out separately as an additional income source.
Key facts
- Basement access
- 2 car garage
- 3 units
Tags
Neighborhood map
What this means for you Summary
Snapshot
- This is a 4-bed/?-bath multifamily listed at $275k. Condition is rated fair.
Deal economics
- At list price, monthly cash flow is $1k ($14k/yr) — positive.
- The deal already cash-flows at list — no discount required.
- Meets the 1% rule at list price ($4k rent vs $275k).
- Recommended offer: $250k (9.0% below list) — sets the bar for market timing.
- Cap rate 11.4% vs local median 8.0% in Minersville — top-decile yield for the area; either an underpriced asset or a hidden risk that comps aren't pricing in. Stress-test before assuming the spread holds.
Location & tenants
- Location reads 70/100 on livability (#742 in PA) — a middle-class / working-renter tenant base. Strengths: cost of living A+, health & safety A+, crime A; Watch: schools C-, commute F, employment F.
- Minersville Area SD (town): math 21% / reading 50% proficiency, ranked #420 of 539 in PA (top 78%) — families likely to look elsewhere, expect single-tenant / working-renter base with shorter leases.
- Market conditions: 38 active listings in the ZIP; 169 units permitted in Schuylkill County in 2024 (0 in 5+ unit buildings).
Forward outlook
- In year one you build about $15k of equity ($2k loan paydown + $13k appreciation (4.7% local appreciation)).
- Schuylkill County population projected at -16% by 2050 — secular population decline; favor cash flow + early exit over multi-decade hold.
- At projected returns (4.7% appreciation + 3.0% rent growth), your $77k cash investment doubles in ~3 years — after that, you're playing with house money.
- By year 3, paydown + projected appreciation supports a ~$36k cash-out refi (75% LTV) — recoverable capital for the next deal without selling this one.
Negotiation context
- It's been on market 98 days — a 9% lower offer ($250k) is reasonable based on typical stale-listing flexibility.
Risks & watch-outs
- Watch-outs: built in 1900 — expect roof / HVAC / electrical / plumbing capex.
Questions for the listing agent
- It's been on market 98 days. Have you received any prior offers? Is the seller open to a 9% concession, seller financing, or rate buy-down credit?
- Have any recent inspections been done? Can we get a copy of the seller's disclosures and any deferred-maintenance estimates?
- Built in 1900 — when were the roof, HVAC, electrical panel, plumbing, and water heater last replaced?
- Why hasn't it sold? Are there any deal-killer items the seller is aware of (foundation, flood, title, zoning, code violations)?
- Is there a deadline driving the sale (1031 exchange, divorce, estate, relocation)? That informs how much negotiation room exists.
- What's the average days-on-market for RENTAL listings here right now (not sales)? A rising rental-DOM trend means longer vacancies and softer asking-rent achievability than the comps imply.
- What's the recent tenant-quality profile in this submarket — average credit score on applications, eviction rate, late-payment / NSF rate, and stable-employment percentage? A property-management company in the area should have these aggregated.
- How much new apartment / multifamily construction is in the pipeline within 1–3 miles? Heavy new supply (>2% of stock underway) typically softens rents 12–24 months out; light construction supports rent growth.
Investment metrics
- 1% rule
- 1.42% ✓
- Cap rate
- 11.44%
- Cash-on-cash
- 18.39%
- DSCR
- 1.82
- GRM
- 5.9
CMA / ARV
- ARV (median comp)
- $215,950
- List price
- $275,000
- Delta
- 27.34%
- Verdict
- OVERPRICED
- Comps
- 5 within 1.0 mi
Projected returns pro-forma
4.65% appreciation · 3.0% rent growth · sell at horizon
- IRR
- 28.1%
- Equity multiple
- 2.73×
- Total profit
- $133,141
- Equity at exit
- $150,051
- IRR
- 27.3%
- Equity multiple
- 5.42×
- Total profit
- $340,365
- Equity at exit
- $254,305
Cash invested: $77,000 (down + closing). Projections, not guarantees.
Landlord ↔ Tenant lean methodology
- Overall (STATE)
- 62 Landlord-Friendly
- State Pennsylvania
- 62 Landlord-Friendly · EVEN
- County
- — inherits STATE
- City
- — inherits STATE
ZIP-level market 17954
- Home prices YoY
- 2.3%
- Active inventory
- 38
- Price-to-rent
- 15.5×
Monthly cashflow live
- Estimated rent
- $3,899 medium interval (Pro) →
- Mortgage (P&I)
- −$1,442
- Tax est. 1.5%
- −$344 /mo · $4,125/yr
- Insurance
- −$115
- HOA
- −$0
- Vacancy / Maint / Mgmt
- −$819
- Net cashflow
- $1,180
Break-even live
3-unit breakdown (identical units grouped — click to expand)
| Units | Beds | Baths | Est. rent |
|---|---|---|---|
| 1× unit | 3 | 3 | $1,475 |
| 1× unit | 1 | 1 | $1,125 |
| 1× unit | 0 | 0 | $1,298 |
| Total (3 units) | $3,899 | ||
UW: 25.0% down · 7.5% · 30yr · 1.5% tax · 5.0% vac · 8.0% maint · 8.0% mgmt
Financing live
Cash to close
- Down payment
- $68,750
- Closing costs
- $8,250
- Reserves months
- —
- Total cash needed
- —
Loan-product check · same deal, 3 products live
Conventional
25% down · 7.5% · 30yr
- Down + closing
- —
- Monthly P&I
- —
- Monthly cashflow
- —
- DSCR
- —
- Eligible?
- —
Personal DTI + credit; lowest rate.
DSCR
20% down · 8.5% · 30yr
- Down + closing
- —
- Monthly P&I
- —
- Monthly cashflow
- —
- DSCR
- —
- Eligible?
- —
No personal income docs; deal must DSCR.
Hard money
10% down · 12.0% · 12mo
- Down + closing
- —
- Monthly P&I
- —
- Monthly cashflow
- —
- DSCR
- —
- Eligible?
- —
Short-term bridge; refi at stabilization.
Listing history 17 events
-
2026-06-19days on market $275,000 Active 98 DOM
-
2026-06-18days on market $275,000 Active 97 DOM
-
2026-06-17days on market $275,000 Active 96 DOM
-
2026-06-16days on market $275,000 Active 95 DOM
-
2026-06-15days on market $275,000 Active 94 DOM
-
2026-06-14days on market $275,000 Active 92 DOM
-
2026-06-12days on market $275,000 Active 91 DOM
-
2026-06-09days on market $275,000 Active 88 DOM
-
2026-06-08days on market $275,000 Active 87 DOM
-
2026-06-07days on market $275,000 Active 86 DOM
-
2026-06-07days on market $275,000 Active 85 DOM
-
2026-06-04days on market $275,000 Active 82 DOM
-
2026-06-02days on market $275,000 Active 81 DOM
-
2026-06-01days on market $275,000 Active 80 DOM
-
2026-05-31days on market $275,000 Active 79 DOM
-
2026-05-31days on market $275,000 Active 78 DOM
-
2026-03-13$275,000 Active 922-char remark
Show marketing remark (922 chars)
Main address is 336 Sunbury St. Great investment opportunity! 3 units on Sunbury St in Minersville with 2 car garage and yard! Owner currently occupies commercial space and wants to stay as a tenant with a long-term lease! 2nd & 3rd Floor is a HUGE 3 bedroom apartment with 3 full unfinished rooms in the attic rented for $700/mo. 1 bedroom apt on first floor is rented for $600/mo has basement access, use of the yard & 2 car garage. Commercial space has been updated and remodeled. Apartments have been leased by the same tenants since before the owner bought the property so those haven't been updated but are serviceable. Laundry in both units. Owner pays WST and tenant pays electric. New roof 2019. Commercial space has mini-splits for heat and air-conditioning. Apts are electric baseboard heat and paid for by tenant. Garage could potentially be rented out separately as an additional income source.
ⓘ Source: listings_history table (triggers on properties + properties_extension) + one-shot
backfill from property_details.listing_events for pre-trigger history.
Nearby sold comps map
Loading sold comps map…
Walkable amenities ~0.75 mi
Loading nearby amenities…
Taxation est. · year 1
- Rental income
- $46,788
- − Mortgage interest
- −$15,404
- − Property taxes
- −$4,125
- − Insurance
- −$1,375
- − Repairs & maintenance
- −$3,743
- − Management
- −$3,743
- − Depreciation
- −$8,000
- Taxable income
- $10,398
- Est. tax owed @ 24.0%
- −$2,495
- After-tax cash flow
- $11,662/yr
For passive investors: Depreciation is non-cash, so a rental often shows a tax loss while cash-flowing — sheltering income. Rental losses are passive: they offset passive income freely, and up to $25,000/yr can offset ordinary (W-2) income if you actively participate and your MAGI is under $100k (phasing out to $0 by $150k); unused losses carry forward. On sale, claimed depreciation is recaptured at up to 25%, and gains may owe capital-gains tax (a 1031 exchange can defer both). Figures are a year-1 estimate at your 24.0% rate — not tax advice; consult a CPA.
Condition & rehab AI · 14 photos
The property presents as a moderate renovation opportunity with dated interiors and average exterior condition. Upgrading the kitchen and bathrooms, along with exterior painting and flooring, can significantly enhance its value.
Repairs flagged
- Minor Kitchen cabinets — Outdated design, could be updated with modern styles.
- Minor Bathroom fixtures — Dated fixtures, could be replaced with modern ones.
- Moderate Exterior siding — Weathered appearance, could benefit from repainting or replacement.
- Moderate Carpeting — Worn appearance, could be replaced with modern flooring.
- Moderate Paint — Faded appearance, could be refreshed with fresh paint.
Value-add opportunities
- Resale Kitchen renovation — Modernizing the kitchen can significantly increase the home's appeal to potential buyers.
- Resale Bathroom updates — Renovating bathrooms can enhance the home's value by making it more attractive to potential buyers.
- Both Exterior painting — Refreshing the exterior can improve curb appeal and increase both resale and rental value.
- Both Flooring replacement — Upgrading the flooring can make the home more appealing and increase its value.
- Both Paint refresh — Fresh paint can make the home more inviting and increase its value.
Renovation cost estimate screening
| Repair item | Severity | Est. cost |
|---|---|---|
| Kitchen cabinets · Outdated design, could be updated with modern styles. | Minor | $500–3,000 |
| Bathroom fixtures · Dated fixtures, could be replaced with modern ones. | Minor | $500–3,000 |
| Exterior siding · Weathered appearance, could benefit from repainting or replacement. | Moderate | $3,000–15,000 |
| Carpeting · Worn appearance, could be replaced with modern flooring. | Moderate | $3,000–15,000 |
| Paint · Faded appearance, could be refreshed with fresh paint. | Moderate | $3,000–15,000 |
| Total estimated repair cost · 5 items | $10,000–51,000 |
Value-add ROI direction
- Resale Kitchen renovation — Modernizing the kitchen can significantly increase the home's appeal to potential buyers. ↑
- Resale Bathroom updates — Renovating bathrooms can enhance the home's value by making it more attractive to potential buyers. ↑
- Both Exterior painting — Refreshing the exterior can improve curb appeal and increase both resale and rental value. ↑
- Both Flooring replacement — Upgrading the flooring can make the home more appealing and increase its value. ↑
- Both Paint refresh — Fresh paint can make the home more inviting and increase its value. ↑
ⓘ Cost ranges are severity-bucket heuristics (US national rule-of-thumb). Get contractor quotes + a written scope before underwriting a rehab budget.
Schools (NCES district)
- District
- Minersville Area SD
- NCES district ID
- 4215510
- Math proficiency
- 21% ▼ -12.00%
- Reading proficiency
- 50% ▼ -8.00%
- Median HH income
- $40,865
- Composite
- 29.77/100
- National rank
- #6433
- State rank
- #420 of 539 in PA
Livability — Minersville
- Score
- 70/100
- State rank
- #742
- US rank
- #7439
Category grades
Schools grade is shown separately in the Schools card above.
Census & demographics
- Census place
- Minersville, PA
- City population
- 27,121
- Population (ZIP)
- 4,564
Population outlook (Schuylkill County) Hauer SSP2
- Today (2025)
- 137,447 people
- By 2030
- 133,121 · -3.1%
- By 2040
- 124,172 · -9.7%
- By 2050
- 115,611 · -15.9%
- By 2075
- 100,796 · -26.7%
- By 2100
- 86,667 · -36.9%
Race, ethnicity, and origin ACS 2023
- Neighborhood character
- Predominantly White (81%)
- Race & ethnicity
- White 81% Two or more races 15% Hispanic / Latino 12%
- Hispanic origin (detail)
- Puerto Rican 11%
- Common ancestry
- Polish 5% Romanian 5% Subsaharan African 4%
- Foreign-born
- 3% · Canada, China
- Languages at home
- 97% English-only · Spanish 2%
Political lean MEDSL · Schuylkill
- 2024 margin
- Solid R (+42.1) · D 28.5% · R 70.6%
- 2008→2024 swing
- -33.4pp toward R · 2008: -8.7pp · 2024: -42.1pp
- All cycles
- 2024: R+42.1 2020: R+39.9 2016: R+43.4 2012: R+13.4 2008: R+8.7
Not yet ingested
- Civics
- —
Market trends
- HPI YoY
- ▲ 4.65%
- Current HPI
- 209.7647
- Rent YoY
- —
- Metro
- —
- State GDP YoY
- ▲ 1.68%
- F500 in state
- 34
Industry mix (Fortune 500 HQ in PA)
| Industry | F500 HQs | Revenue |
|---|---|---|
| Healthcare | 2 | $309B |
|
||
| Insurance | 2 | $27B |
|
||
| Telecommunications / Media | 1 | $124B |
|
||
| Industrial Distribution | 1 | $22B |
|
||
| Financial Services | 1 | $20B |
|
||
| Chemicals / Materials | 1 | $18B |
|
||
Price history
1 event — show timeline
- 2026-03-13 Listed $275,000 BRIGHT MLS
Cash-flow waterfall
monthlySold comps — $/sqft
last 12 mo · ≤1 miLoading sold comps…