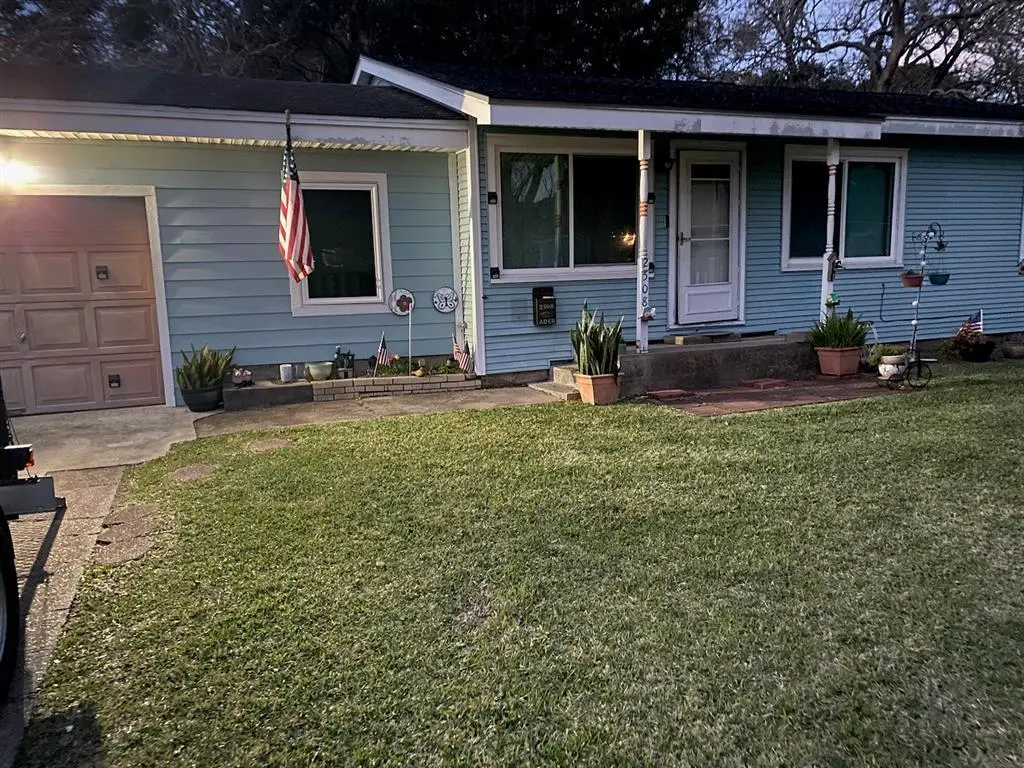
2508 N Houston Dr · La Marque, TX
Flood risk 6/10 · Moderate
- FEMA flood zone
- X (shaded)
- Chance of flooding over 30 yrs
- 0.57%
- Est. flood insurance / yr
- $507 – $1,088
Fire risk 2/10 · Minimal
- Est. fire insurance / yr
- $1,222 – $2,270
Heat risk 10/10 · Severe
- Hot days now (above 110°F)
- 7 days/yr
- Hot days in 30 yrs
- 26 days/yr
Wind risk 10/10 · Severe
- Chance of severe wind over 30 yrs
- 99.0%
Air-quality risk 3/10 · Minor
- Unhealthy air days now
- 2 days/yr
- Unhealthy air days in 30 yrs
- 2 days/yr
Risk factors via First Street. Map © Google.
Why this score? — see what drove the C- grade
The composite is a weighted blend of 9 inputs, each scored 0–100. Each bar is that input's sub-score; the figure is the points it added to the 100-point composite (weight × sub-score).
- Cash flow +18.9/30.0
- ARV discount +11.4/15.0
- DSCR +6.0/10.0
- 1% rule +5.1/10.0
- Rent growth +3.5/5.0
- Livability +3.0/5.0
- Condition / age +2.5/5.0
- Schools +2.4/10.0
- Appreciation +0.0/10.0
$230,000
🖨 Deal sheet (PDF) 📄 Offer letter ✓ Due diligence
Listing remarks MLS
INVESTOR SPECIAL as-is. Come see this great investment opportunity. Plenty of space with 4 bedrooms and 2 Baths. Roof and exterior are in great shape.
Key facts
- 9,949 sq ft lot
- Garage
- Built 1958
Neighborhood map
What this means for you Summary
Snapshot
- This is a 4-bed/2.0-bath single-family listed at $230k.
Deal economics
- At list price, monthly cash flow is $236 ($3k/yr) — positive.
- The deal already cash-flows at list — no discount required.
- Meets the 1% rule at list price ($2k rent vs $230k).
- Cap rate 7.5% vs local median 5.6% in La Marque — top-decile yield for the area; either an underpriced asset or a hidden risk that comps aren't pricing in. Stress-test before assuming the spread holds.
Location & tenants
- Location reads 59/100 on livability (#1,136 in TX) — a working-class tenant base; expect higher turnover. Strengths: cost of living A+, housing A+; Watch: employment D, crime F, amenities F.
- Texas City ISD (suburban): math 28% / reading 29% proficiency, ranked #655 of 826 in TX (top 79%) — low school quality limits family demand, transient renter base, plan for 1-2y turnover; 66% free/reduced lunch — lower-income household profile, screen leases tightly.
- Zoned schools: Hayley El (math 7% / reading 11%, grade F, #4,293 of 4,322 statewide, top 99%, 562 students, 92% FRL); La Marque H S (math 27% / reading 20%, grade F, #1,342 of 1,632 statewide, top 82%, 647 students, 91% FRL) — zoned schools average 92% FRL vs 66% district-wide (26 pts higher); higher-poverty schools than district average — tighter screening recommended.
- Zoned-school proficiency averages 16% at this address vs 28% district-wide (-12 pts) — the specific schools serving this property underperform the Texas City ISD average; the district grade overstates school quality for this exact location.
- Market conditions: Rents rising (+4.0%/yr); 661 active listings in the ZIP; 6 comparable units currently listed for rent nearby; rentals at typical pace (median 26d on market — plan ~3-4 weeks tenant-placement turnaround); 3,258 units permitted in Galveston County in 2024 (0 in 5+ unit buildings).
- This rent runs 37% of the median local income ($75k/yr) — at the standard rent-burdened threshold; future hikes will face affordability resistance.
Forward outlook
- Local home prices are declining (-3.0%/yr); year-one equity from $2k of loan paydown is wiped out by about $7k of value loss. Plan a longer hold.
- Galveston County population projected at +43% by 2050 — long-run rental-demand tailwind backs the buy-and-hold thesis.
Negotiation context
- Only 13 days on market — expect competitive offers; lowballing is unlikely to land.
Risks & watch-outs
- Watch-outs: built in 1958 — expect roof / HVAC / electrical / plumbing capex.
- Climate carrying-cost: major flood risk; severe wind risk, 99% chance of damaging wind over 30y; extreme-heat days projected 7→26/yr by 2055 (HVAC capex compounding) — expect insurance premiums to compound above CPI over the hold.
Questions for the listing agent
- Built in 1958 — when were the roof, HVAC, electrical panel, plumbing, and water heater last replaced?
- Is there a deadline driving the sale (1031 exchange, divorce, estate, relocation)? That informs how much negotiation room exists.
- Schools are F-rated, which usually means shorter tenancies and higher turnover. Who's the typical renter profile here, and what's been the actual vacancy rate?
- Crime grade is F in this area — have there been break-ins, vandalism, or insurance claims at this property in the last 3 years? What carrier currently insures it and at what premium?
- What's the average days-on-market for RENTAL listings here right now (not sales)? A rising rental-DOM trend means longer vacancies and softer asking-rent achievability than the comps imply.
- What's the recent tenant-quality profile in this submarket — average credit score on applications, eviction rate, late-payment / NSF rate, and stable-employment percentage? A property-management company in the area should have these aggregated.
- How much new for-sale + rental construction is in the pipeline within 1–3 miles? Heavy new supply typically softens prices + rents 12–24 months out; constrained supply supports both.
Investment metrics
- 1% rule
- 1.01% ✓
- Cap rate
- 7.52%
- Cash-on-cash
- 4.40%
- DSCR
- 1.20
- GRM
- 8.2
CMA / ARV
- ARV (on-the-fly)
- $252,045
- Comps found
- 12
Show comp detail 12 sales within ~0.75 mi
| Address | Dist | Beds/Ba | Sqft | Sold | Price | $/sf | Match |
|---|---|---|---|---|---|---|---|
| 2508 N Houston Dr | 0.00mi | 4/2.0 | 1,867 (0%) | 2mo | $115,000 | $62 | 99 |
| 2405 Stonewall St | 0.31mi | 4/3.0 | 1,812 (-3%) | 2mo | $249,900 | $138 | 75 |
| 2805 N Houston Dr | 0.25mi | 3/2.5 (-1) | 1,832 (-2%) | 4mo | $130,000 | $71 | 75 |
| 1401 Austin St | 0.09mi | 4/3.0 | 2,054 (+10%) | 4mo | $249,900 | $122 | 72 |
| 2424 Oaklawn Dr | 0.43mi | 4/2.0 | 1,744 (-7%) | 3mo | $235,000 | $135 | 66 |
| 2012 Bellview | 0.56mi | 4/3.0 | 1,812 (-3%) | 1mo | $254,900 | $141 | 64 |
| 121 Lake Rd | 0.65mi | 3/2.0 (-1) | 1,909 (+2%) | 4mo | $68,000 | $36 | 58 |
| 1825 Thompson St | 0.37mi | 3/2.5 (-1) | 1,676 (-10%) | 4mo | $229,900 | $137 | 55 |
| 2832 Ashley St | 0.65mi | 3/2.0 (-1) | 1,750 (-6%) | 1mo | $289,000 | $165 | 53 |
| 2201 Meadow Ln | 0.52mi | 3/2.0 (-1) | 1,660 (-11%) | 2mo | $248,000 | $149 | 50 |
| 1112 Cora St | 0.45mi | 3/2.0 (-1) | 1,631 (-13%) | 6mo | $175,000 | $107 | 48 |
| 3116 Mckinney Dr | 0.70mi | 4/2.0 | 2,116 (+13%) | 7mo | $165,000 | $78 | 39 |
Match score weights: distance 35% · size 25% · config 20% · recency 20%. Top-matched comps best support the ARV.
Projected returns pro-forma
-3.0% appreciation · 3.95% rent growth · sell at horizon
- IRR
- -8.3%
- Equity multiple
- 0.69×
- Total profit
- $-19,939
- Equity at exit
- $34,294
- IRR
- 2.4%
- Equity multiple
- 1.18×
- Total profit
- $11,591
- Equity at exit
- $19,886
Cash invested: $64,400 (down + closing). Projections, not guarantees.
Landlord ↔ Tenant lean methodology
- Overall (STATE)
- 87 Strongly Landlord-Friendly
- State Texas
- 87 Strongly Landlord-Friendly · R+5
- County
- — inherits STATE
- City
- — inherits STATE
ZIP-level market 77568
- Home prices YoY
- -22.7%
- Rents YoY
- 4.0%
- Active inventory
- 661
- Price-to-rent
- 8.2×
Monthly cashflow live
- Estimated rent
- $2,331 high interval (Pro) →
- Mortgage (P&I)
- −$1,206
- Tax from tax record
- −$303 /mo · $3,641/yr
- Insurance
- −$96
- HOA
- −$0
- Vacancy / Maint / Mgmt
- −$489
- Net cashflow
- $236
Break-even live
Sensitivity live
| Price | -10% $366 | -5% $301 | +0% $236 | +5% $171 | +10% $106 |
|---|---|---|---|---|---|
| Rent | -10% $52 | -5% $144 | +0% $236 | +5% $328 | +10% $420 |
| Rate | -1.0pp $352 | -0.5pp $295 | base $236 | +0.5pp $176 | +1.0pp $116 |
UW: 25.0% down · 7.5% · 30yr · 1.5% tax · 5.0% vac · 8.0% maint · 8.0% mgmt
Financing live
Cash to close
- Down payment
- $57,500
- Closing costs
- $6,900
- Reserves months
- —
- Total cash needed
- —
Loan-product check · same deal, 3 products live
Conventional
25% down · 7.5% · 30yr
- Down + closing
- —
- Monthly P&I
- —
- Monthly cashflow
- —
- DSCR
- —
- Eligible?
- —
Personal DTI + credit; lowest rate.
DSCR
20% down · 8.5% · 30yr
- Down + closing
- —
- Monthly P&I
- —
- Monthly cashflow
- —
- DSCR
- —
- Eligible?
- —
No personal income docs; deal must DSCR.
Hard money
10% down · 12.0% · 12mo
- Down + closing
- —
- Monthly P&I
- —
- Monthly cashflow
- —
- DSCR
- —
- Eligible?
- —
Short-term bridge; refi at stabilization.
Rent comps 6 comps
| Address | Beds | Baths | Sqft | Rent | $/sqft | DOM | Units | Dist |
|---|---|---|---|---|---|---|---|---|
| 1401 Austin St La Marque, TX | 4.0 | 3.0 | 1542 | $2,400 | $1.56 | 45d | 1 | 0.11mi |
| 1006 E Camp Cir La Marque, TX | 3.0 | 1.0 | 1230 | $1,500 | $1.22 | 26d | 1 | 0.23mi |
| 1230 Kirsten St La Marque, TX | 3.0 | 2.0 | 1704 | $1,660 | $0.97 | 4d | 1 | 0.43mi |
| 203 Beatrice St La Marque, TX | 3.0 | 1.0 | 1304 | $1,395 | $1.07 | 26d | 1 | 0.91mi |
| 1029 Sycamore St La Marque, TX | 3.0 | 2.0 | 1928 | $1,695 | $0.88 | 17d | 1 | 1.04mi |
| 14403 Daniel Shores Dr La Marque, TX | 4.0 | 3.0–3.5 | 1872 | $2,600 | $1.39 | 0d | 12 | 1.09mi |
Listing history 10 events
-
2026-06-21days on market $230,000 Active 13 DOM
-
2026-06-18days on market $230,000 Active 10 DOM
-
2026-06-17days on market $230,000 Active 9 DOM
-
2026-06-16days on market $230,000 Active 8 DOM
-
2026-06-15days on market $230,000 Active 7 DOM
-
2026-06-13days on market $230,000 Active 5 DOM
-
2026-06-09statusdays on market $230,000 Active 1 DOM
-
2026-06-08days on market $230,000 Coming Soon 5 DOM
-
2026-06-07days on market $230,000 Coming Soon 4 DOM
-
2026-06-04$230,000 Coming Soon 1 DOM
ⓘ Source: listings_history table (triggers on properties + properties_extension) + one-shot
backfill from property_details.listing_events for pre-trigger history.
Tax reassessment forecast TX · Resets to sale price
- Current annual tax
- $3,641 · $303/mo
- Projected year-2 tax
- $4,209 · $351/mo
- Expected delta
- +$568/yr (+$47/mo · 15.6%)
ⓘ Screening estimate from a state-policy table — verify with the county assessor before closing.
Climate risk First Street
- Flood 6/10 Major FEMA zone X (shaded) · 57% chance over 30 yrs
- Wildfire 2/10 Low
- Heat 10/10 Extreme 7 d/yr ≥110°F today · 26 d/yr by 30 yrs out
- Wind 10/10 Extreme 99% chance of damaging wind over 30 yrs
- Air quality 3/10 Moderate 2 unhealthy d/yr today · 2 by 30 yrs out
Nearby sold comps map
Loading sold comps map…
Walkable amenities ~0.75 mi
Loading nearby amenities…
Taxation est. · year 1
- Rental income
- $27,971
- − Mortgage interest
- −$12,884
- − Property taxes
- −$3,641
- − Insurance
- −$1,150
- − Repairs & maintenance
- −$2,238
- − Management
- −$2,238
- − Depreciation
- −$6,691
- Taxable loss
- −$869
- Est. tax savings @ 24.0%
- +$209
- After-tax cash flow
- $3,042/yr
For passive investors: Depreciation is non-cash, so a rental often shows a tax loss while cash-flowing — sheltering income. Rental losses are passive: they offset passive income freely, and up to $25,000/yr can offset ordinary (W-2) income if you actively participate and your MAGI is under $100k (phasing out to $0 by $150k); unused losses carry forward. On sale, claimed depreciation is recaptured at up to 25%, and gains may owe capital-gains tax (a 1031 exchange can defer both). Figures are a year-1 estimate at your 24.0% rate — not tax advice; consult a CPA.
Schools (NCES district)
- District
- Texas City ISD
- NCES district ID
- 4842510
- Math proficiency
- 28% ▼ -10.00%
- Reading proficiency
- 29% ▼ -4.00%
- Median HH income
- $44,875
- Composite
- 24.47/100
- National rank
- #7664
- State rank
- #655 of 826 in TX
Livability — La Marque
- Score
- 59/100
- State rank
- #1136
- US rank
- #20037
Category grades
Schools grade is shown separately in the Schools card above.
Census & demographics
- Census place
- La Marque, TX
- County
- Galveston County · 357,330 people
- City population
- 23,083
- Metro
- Houston-The Woodlands-Sugar Land, TX
- Population (ZIP)
- 23,083
- Household income
- $74,694
- Rent vs Own
- Severe rent burden
- 700.0
Population outlook (Galveston County) Hauer SSP2
- Today (2025)
- 390,640 people
- By 2030
- 425,226 · +8.9%
- By 2040
- 493,765 · +26.4%
- By 2050
- 559,698 · +43.3%
- By 2075
- 719,260 · +84.1%
- By 2100
- 819,628 · +109.8%
Race, ethnicity, and origin ACS 2023
- Neighborhood character
- Highly diverse neighborhood (Simpson 0.71)
- Race & ethnicity
- White 37% Hispanic / Latino 29% Black 26% Two or more races 17% Asian 3%
- Hispanic origin (detail)
- Mexican 22% Puerto Rican 1%
- Common ancestry
- Lithuanian 1% Italian 1% Serbian 1%
- Foreign-born
- 8% · Canada
- Languages at home
- 77% English-only · Spanish 21% Tagalog/Filipino 1% Other Asian/Pacific 1%
Political lean MEDSL · Galveston
- 2024 margin
- Strong R (+27.4) · D 35.7% · R 63.1% · Other 1.2%
- 2008→2024 swing
- -7.9pp toward R · 2008: -19.5pp · 2024: -27.4pp
- All cycles
- 2024: R+27.4 2020: R+22.6 2016: R+22.6 2012: R+26.9 2008: R+19.5
Not yet ingested
- Civics
- —
Market trends
- HPI YoY
- ▼ -69.39%
- Current HPI
- 236.0239
- Rent YoY
- ▲ 3.95%
- Metro
- Houston-The Woodlands-Sugar Land, TX
- State GDP YoY
- ▲ 3.95%
- F500 in state
- 110
Industry mix (Fortune 500 HQ in TX)
| Industry | F500 HQs | Revenue |
|---|---|---|
| Energy | 16 | $1,198B |
|
||
| Technology | 5 | $198B |
|
||
| Engineering / Construction | 4 | $72B |
|
||
| Energy Services | 3 | $60B |
|
||
| Utilities | 3 | $41B |
|
||
| Healthcare | 2 | $330B |
|
||
Price history
+78.3% since first listed9 events — show timeline
- 2026-06-03 Coming Soon $230,000 HARMLS
- 2026-05-01 Sold (Public Records) — Public Records
- 2026-05-01 Sold (MLS) — NTREIS
- 2026-03-31 Pending — NTREIS
- 2026-03-13 Price Changed $115,000 NTREIS
- 2026-03-06 Price Changed $119,000 NTREIS
- 2026-03-05 Price Changed $125,000 NTREIS
- 2026-02-01 Listed $129,000 NTREIS
- 1988-07-08 Sold (Public Records) — Public Records
Property tax history
+7.1%/yrLatest (2025): $3,641 · +13.3% YoY. Source: county tax records.
Cash-flow waterfall
monthlySold comps — $/sqft
last 12 mo · ≤1 miLoading sold comps…