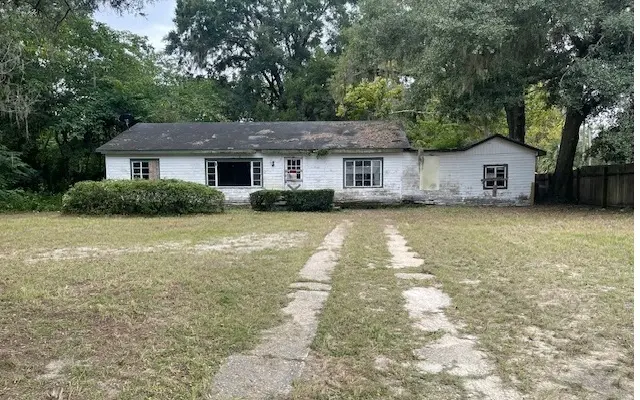
1410 E Duval St · Watertown, FL
Flood risk 1/10 · Minimal
- FEMA flood zone
- X (unshaded)
- Chance of flooding over 30 yrs
- 0.0%
- Est. flood insurance / yr
- $507 – $1,088
Fire risk 5/10 · Moderate
- Est. fire insurance / yr
- $947 – $1,759
Heat risk 8/10 · Major
- Hot days now (above 107°F)
- 7 days/yr
- Hot days in 30 yrs
- 19 days/yr
Wind risk 9/10 · Severe
- Chance of severe wind over 30 yrs
- 99.0%
Air-quality risk 5/10 · Moderate
- Unhealthy air days now
- 9 days/yr
- Unhealthy air days in 30 yrs
- 10 days/yr
Risk factors via First Street. Map © Google.
Why this score? — see what drove the C+ grade
The composite is a weighted blend of 9 inputs, each scored 0–100. Each bar is that input's sub-score; the figure is the points it added to the 100-point composite (weight × sub-score).
- Cash flow +20.3/30.0
- Appreciation +10.0/10.0
- ARV discount +7.6/15.0
- DSCR +6.4/10.0
- 1% rule +4.7/10.0
- Schools +4.5/10.0
- Livability +3.0/5.0
- Rent growth +2.5/5.0
- Condition / age +2.5/5.0
$179,900
🖨 Deal sheet 📄 Offer letter ✓ Due diligence
Listing remarks
Great location near downtown Lake City, FL. This property is loaded with potential. Existing residence on the property has great bones as a fixer upper. Could be a residence or a rental (this area is in short supply of rentals!) Large lot. County has zoned this property commercial use also. (Per Columbia County - is able to stay in use as residential or can be used commercial)
Key facts
- Large lot
- Zoned commercial use
- 1.31 acre lot
Tags
Property features AI
Finance
- Other: Zoning: CI; Subdivision: Morningside Heights; Directions: From Lake City take US 90 (Duval St) East. Property is on right just past Eloise Ave.
Exterior
- Parking: Attached garage with 3 parking spaces
- Home design: Single-story residential property
- Exterior features: Wood fencing; Shingle roof; Approximately 1.308-acre lot
Interior
- Flooring: Hardwood; Vinyl
- Bathrooms: 1 full bathroom
- Heating & cooling: Ceiling fans (cooling)
- Interior features: Ceiling fans; Hardwood flooring; Vinyl flooring
Neighborhood map
What this means for you Summary
Snapshot
- This is a 3-bed/1.0-bath single-family listed at $180k.
Deal economics
- At list price, monthly cash flow is $229 ($3k/yr) — positive.
- The deal already cash-flows at list — no discount required.
- To meet the 1% rule (rent ≥ 1% of price), the offer needs to be $175k (2.5% below list).
- Recommended offer: $175k (2.5% below list) — sets the bar for 1% rule.
- Cap rate 7.8% vs local median 5.5% in Watertown — top-decile yield for the area; either an underpriced asset or a hidden risk that comps aren't pricing in. Stress-test before assuming the spread holds.
Location & tenants
- Location reads 60/100 on livability (#798 in FL) — a middle-class / working-renter tenant base. Strengths: crime A+, cost of living A+, housing A-; Watch: schools F, amenities F, commute F.
- Columbia (town): math 53% / reading 54% proficiency, ranked #25 of 73 in FL (top 34%) — acceptable for families but not a draw, mixed tenant base, ~2y average lease.
- Market conditions: 143 active listings in the ZIP; 178 units permitted in Columbia County in 2024 (0 in 5+ unit buildings).
Forward outlook
- In year one you build about $19k of equity ($1k loan paydown + $18k appreciation (10.0% local appreciation)).
- Columbia County population projected to shrink 7% by 2050 — rents likely to lag national; underwrite the cash flow, not the appreciation.
- At projected returns (10.0% appreciation + 3.0% rent growth), your $50k cash investment doubles in ~3 years — after that, you're playing with house money.
- By year 2, paydown + projected appreciation supports a ~$31k cash-out refi (75% LTV) — recoverable capital for the next deal without selling this one.
Negotiation context
- Only 12 days on market — expect competitive offers; lowballing is unlikely to land.
- 8 sale attempts since 4y ago with the ask held roughly flat each time — persistent listings suggest the price (not the market) is what's stuck; bring a comps-based counter.
- Current owner paid $92k; list at $180k implies a 96% gain — meaningful room to come down on a strong offer.
Risks & watch-outs
- Watch-outs: built in 1945 — expect roof / HVAC / electrical / plumbing capex.
- Climate carrying-cost: severe wind risk, 99% chance of damaging wind over 30y; moderate wildfire risk; extreme-heat days projected 7→19/yr by 2055 (HVAC capex compounding) — expect insurance premiums to compound above CPI over the hold.
Questions for the listing agent
- Built in 1945 — when were the roof, HVAC, electrical panel, plumbing, and water heater last replaced?
- Is there a deadline driving the sale (1031 exchange, divorce, estate, relocation)? That informs how much negotiation room exists.
- Schools are F-rated, which usually means shorter tenancies and higher turnover. Who's the typical renter profile here, and what's been the actual vacancy rate?
- What's the average days-on-market for RENTAL listings here right now (not sales)? A rising rental-DOM trend means longer vacancies and softer asking-rent achievability than the comps imply.
- What's the recent tenant-quality profile in this submarket — average credit score on applications, eviction rate, late-payment / NSF rate, and stable-employment percentage? A property-management company in the area should have these aggregated.
- How much new for-sale + rental construction is in the pipeline within 1–3 miles? Heavy new supply typically softens prices + rents 12–24 months out; constrained supply supports both.
Investment metrics
- 1% rule
- 0.97% ✗
- Cap rate
- 7.82%
- Cash-on-cash
- 5.45%
- DSCR
- 1.24
- GRM
- 8.6
CMA / ARV
- ARV (on-the-fly)
- $180,264
- Comps found
- 12
Show comp detail 12 sales within ~0.75 mi
| Address | Dist | Beds/Ba | Sqft | Sold | Price | $/sf | Match |
|---|---|---|---|---|---|---|---|
| 1104 SE Magnolia Loop | 0.56mi | 4/2.0 (+1) | 1,600 (-2%) | 4mo | $245,655 | $154 | 59 |
| 195 SE Emma Pl | 0.53mi | 3/1.5 | 1,748 (+8%) | 4mo | $232,000 | $133 | 57 |
| 1871 SE Baya Dr | 0.57mi | 3/2.0 | 1,575 (-3%) | 10mo | $175,000 | $111 | 56 |
| 231 SE Golf Club Ave | 0.56mi | 4/1.5 (+1) | 1,696 (+4%) | 6mo | $119,000 | $70 | 54 |
| 492 SE Lomond Ave | 0.38mi | 3/1.0 | 1,390 (-14%) | 6mo | $112,500 | $81 | 54 |
| 443 SE Melrose Way | 0.46mi | 3/2.0 | 1,549 (-5%) | 18mo | $183,000 | $118 | 52 |
| 211 NE Labelle Ter | 0.50mi | 4/2.0 (+1) | 1,726 (+6%) | 9mo | $85,000 | $49 | 50 |
| 993 SE Putnam St | 0.42mi | 4/2.0 (+1) | 1,438 (-12%) | 6mo | $165,000 | $115 | 48 |
| 176 SE Dekle Way | 0.57mi | 3/1.0 | 1,390 (-14%) | 3mo | $145,000 | $104 | 47 |
| 268 NE Anderson Ter | 0.60mi | 3/2.0 | 1,418 (-13%) | 6mo | $125,000 | $88 | 42 |
| 342 NE Anderson Ter | 0.62mi | 3/1.0 | 1,449 (-11%) | 16mo | $92,500 | $64 | 40 |
| 132 SE Tribble St | 0.74mi | 4/3.0 (+1) | 1,800 (+11%) | 3mo | $274,900 | $153 | 32 |
Match score weights: distance 35% · size 25% · config 20% · recency 20%. Top-matched comps best support the ARV.
Projected returns pro-forma
10.0% appreciation · 3.0% rent growth · sell at horizon
- IRR
- 28.2%
- Equity multiple
- 3.23×
- Total profit
- $112,532
- Equity at exit
- $162,068
- IRR
- 24.6%
- Equity multiple
- 7.35×
- Total profit
- $319,868
- Equity at exit
- $349,506
Cash invested: $50,372 (down + closing). Projections, not guarantees.
Landlord ↔ Tenant lean methodology
- Overall (STATE)
- 87 Strongly Landlord-Friendly
- State Florida
- 87 Strongly Landlord-Friendly · R+3
- County
- — inherits STATE
- City
- — inherits STATE
ZIP-level market 32025
- Home prices YoY
- 6.8%
- Active inventory
- 143
- Price-to-rent
- 8.6×
Monthly cashflow live
- Estimated rent
- $1,753 medium interval (Pro) →
- Mortgage (P&I)
- −$943
- Tax from tax record
- −$138 /mo · $1,654/yr
- Insurance
- −$75
- HOA
- −$0
- Vacancy / Maint / Mgmt
- −$368
- Net cashflow
- $229
Break-even live
UW: 25.0% down · 7.5% · 30yr · 1.5% tax · 5.0% vac · 8.0% maint · 8.0% mgmt
Financing live
Cash to close
- Down payment
- $44,975
- Closing costs
- $5,397
- Reserves months
- —
- Total cash needed
- —
Loan-product check · same deal, 3 products live
Conventional
25% down · 7.5% · 30yr
- Down + closing
- —
- Monthly P&I
- —
- Monthly cashflow
- —
- DSCR
- —
- Eligible?
- —
Personal DTI + credit; lowest rate.
DSCR
20% down · 8.5% · 30yr
- Down + closing
- —
- Monthly P&I
- —
- Monthly cashflow
- —
- DSCR
- —
- Eligible?
- —
No personal income docs; deal must DSCR.
Hard money
10% down · 12.0% · 12mo
- Down + closing
- —
- Monthly P&I
- —
- Monthly cashflow
- —
- DSCR
- —
- Eligible?
- —
Short-term bridge; refi at stabilization.
Listing history 10 events
-
2026-06-19days on market $179,900 Active 12 DOM
-
2026-06-18days on market $179,900 Active 11 DOM
-
2026-06-17days on market $179,900 Active 10 DOM
-
2026-06-16days on market $179,900 Active 9 DOM
-
2026-06-15days on market $179,900 Active 8 DOM
-
2026-06-14days on market $179,900 Active 6 DOM
-
2026-06-12days on market $179,900 Active 5 DOM
-
2026-06-09days on market $179,900 Active 2 DOM
-
2026-06-08remarks 379-char remark
-
2026-06-08$179,900 Active 1 DOM
ⓘ Source: listings_history table (triggers on properties + properties_extension) + one-shot
backfill from property_details.listing_events for pre-trigger history.
Tax reassessment forecast FL · Resets to sale price
- Current annual tax
- $1,654 · $138/mo
- Projected year-2 tax
- $1,654 · $138/mo
- Expected delta
- $0/yr ($0/mo · -0.0%)
ⓘ Screening estimate from a state-policy table — verify with the county assessor before closing.
Climate risk First Street
- Flood 1/10 Low FEMA zone X (unshaded) · 0% chance over 30 yrs
- Wildfire 5/10 Major
- Heat 8/10 Severe 7 d/yr ≥107°F today · 19 d/yr by 30 yrs out
- Wind 9/10 Extreme 99% chance of damaging wind over 30 yrs
- Air quality 5/10 Major 9 unhealthy d/yr today · 10 by 30 yrs out
Nearby sold comps map
Loading sold comps map…
Walkable amenities ~0.75 mi
Loading nearby amenities…
Taxation est. · year 1
- Rental income
- $21,040
- − Mortgage interest
- −$10,077
- − Property taxes
- −$1,654
- − Insurance
- −$900
- − Repairs & maintenance
- −$1,683
- − Management
- −$1,683
- − Depreciation
- −$5,233
- Taxable loss
- −$190
- Est. tax savings @ 24.0%
- +$46
- After-tax cash flow
- $2,793/yr
For passive investors: Depreciation is non-cash, so a rental often shows a tax loss while cash-flowing — sheltering income. Rental losses are passive: they offset passive income freely, and up to $25,000/yr can offset ordinary (W-2) income if you actively participate and your MAGI is under $100k (phasing out to $0 by $150k); unused losses carry forward. On sale, claimed depreciation is recaptured at up to 25%, and gains may owe capital-gains tax (a 1031 exchange can defer both). Figures are a year-1 estimate at your 24.0% rate — not tax advice; consult a CPA.
Schools (NCES district)
- District
- Columbia
- NCES district ID
- 1200360
- Math proficiency
- 53% ▼ -10.00%
- Reading proficiency
- 54% ▼ -3.00%
- Median HH income
- $40,053
- Composite
- 44.74/100
- National rank
- #2750
- State rank
- #25 of 73 in FL
Livability — Watertown
- Score
- 60/100
- State rank
- #798
- US rank
- #18481
Category grades
Schools grade is shown separately in the Schools card above.
Census & demographics
- Census place
- Watertown, FL
- County
- Columbia County · 40,507 people
- Metro
- Lake City, FL
- Population (ZIP)
- 22,948
- Household income
- $55,004
- Rent vs Own
- Severe rent burden
- 754.0
Population outlook (Columbia County) Hauer SSP2
- Today (2025)
- 68,129 people
- By 2030
- 67,501 · -0.9%
- By 2040
- 65,465 · -3.9%
- By 2050
- 63,058 · -7.4%
- By 2075
- 56,291 · -17.4%
- By 2100
- 45,243 · -33.6%
Race, ethnicity, and origin ACS 2023
- Neighborhood character
- Predominantly White (67%)
- Race & ethnicity
- White 67% Black 20% Hispanic / Latino 8% Two or more races 7%
- Hispanic origin (detail)
- Mexican 1% Puerto Rican 3% Cuban 1%
- Common ancestry
- Serbian 2% Lithuanian 2% Romanian 2%
- Foreign-born
- 3% · Canada
- Languages at home
- 91% English-only · Spanish 6% French/Haitian/Cajun 2%
Political lean MEDSL · Columbia
- 2024 margin
- Solid R (+50.2) · D 24.6% · R 74.7%
- 2008→2024 swing
- -16.4pp toward R · 2008: -33.8pp · 2024: -50.2pp
- All cycles
- 2024: R+50.2 2020: R+45.2 2016: R+44.5 2012: R+36.7 2008: R+33.8
Not yet ingested
- Civics
- —
Market trends
- HPI YoY
- ▲ 17.57%
- Current HPI
- 276.7253
- Rent YoY
- —
- Metro
- Lake City, FL
- State GDP YoY
- ▲ 3.28%
- F500 in state
- 36
Industry mix (Fortune 500 HQ in FL)
| Industry | F500 HQs | Revenue |
|---|---|---|
| Industrial Technology | 2 | $29B |
|
||
| Insurance | 2 | $17B |
|
||
| Retail | 1 | $60B |
|
||
| Technology Distribution | 1 | $58B |
|
||
| Homebuilding | 1 | $35B |
|
||
| Technology Manufacturing | 1 | $35B |
|
||
Price history
+95.5% since first listed15 events — show timeline
- 2026-06-08 Listed $179,900 NFMLS
- 2025-10-01 Relisted — NFMLS
- 2025-04-17 Relisted — NFMLS
- 2025-03-22 Price Changed $179,900 NFMLS
- 2024-10-02 Listed $189,900 NFMLS
- 2024-04-09 Listed $134,900 NFMLS
- 2024-02-29 Price Changed $139,900 NFMLS
- 2023-12-27 Listed $144,900 NFMLS
- 2023-09-20 Listed $149,900 NFMLS
- 2023-08-17 Delisted — NFMLS
- 2023-05-22 Price Changed $159,900 NFMLS
- 2023-05-22 Price Changed $159,000 NFMLS
- 2022-10-14 Price Changed $159,900 NFMLS
- 2022-06-30 Listed $169,900 NFMLS
- 2022-04-28 Sold (Public Records) $92,000 Public Records
Property tax history
+1.5%/yrLatest (2025): $1,654 · -0.2% YoY. Source: county tax records.
Cash-flow waterfall
monthlySold comps — $/sqft
last 12 mo · ≤1 miLoading sold comps…