27901 Norris Rd #89 · Four Corners, MT
Flood risk 5/10 · Moderate
- FEMA flood zone
- AE
- Chance of flooding over 30 yrs
- 0.48%
- Est. flood insurance / yr
- $1,737 – $8,500
Fire risk 3/10 · Minor
- Est. fire insurance / yr
- $918 – $1,706
Heat risk 2/10 · Minimal
- Hot days now (above 89°F)
- 7 days/yr
- Hot days in 30 yrs
- 16 days/yr
Wind risk 1/10 · Minimal
- Chance of severe wind over 30 yrs
- —
Air-quality risk 5/10 · Moderate
- Unhealthy air days now
- 7 days/yr
- Unhealthy air days in 30 yrs
- 8 days/yr
Risk factors via First Street. Map © Google.
Why this score? — see what drove the B grade
The composite is a weighted blend of 9 inputs, each scored 0–100. Each bar is that input's sub-score; the figure is the points it added to the 100-point composite (weight × sub-score).
- Cash flow +30.0/30.0
- 1% rule +10.0/10.0
- DSCR +10.0/10.0
- ARV discount +7.5/15.0
- Schools +5.7/10.0
- Livability +4.2/5.0
- Condition / age +2.5/5.0
- Rent growth +2.3/5.0
- Appreciation +0.0/10.0
$160,000
🖨 Deal sheet (PDF) 📄 Offer letter ✓ Due diligence
Key facts
- New water heater
- Private river access
- Updated metal roof
Tags
Property features AI
Finance
- Financial info: Annual taxes listed (amount withheld from display per instructions)
Exterior
- Utilities: Electricity connected; Public sewer
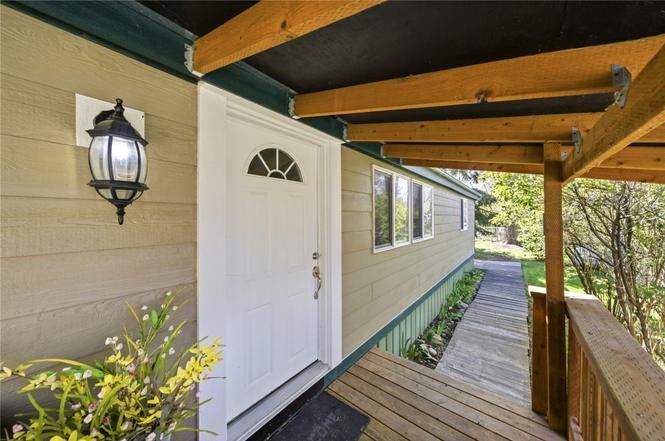
- Home design: Manufactured double-wide home; Residential property; Facing/entry direction not specified
- Construction: Wood siding exterior; Block foundation; Metal roof
- Exterior features: Chain link fencing; Level, landscaped front yard; Private maintained road and private road frontage; Asphalt road surface; Has a view
Interior
- Kitchen: Range; Dishwasher; Refrigerator
- Bathrooms: 2 full bathrooms
- Heating & cooling: Forced air heating
- Interior features: Dryer, Dishwasher, Range, Refrigerator, Washer; Updated/Remodeled condition; No basement
- Laundry & utility: Washer and dryer (washer hookup provided)
Neighborhood map
What this means for you Summary
Snapshot
- This is a 3-bed/2.0-bath manufactured listed at $160k.
Deal economics
- At list price, monthly cash flow is $615 ($7k/yr) — positive.
- The deal already cash-flows at list — no discount required.
- Meets the 1% rule at list price ($3k rent vs $160k).
- Recommended offer: $141k (12.0% below list) — sets the bar for market timing.
- Cap rate 14.1% vs local median 1.5% in Four Corners — top-decile yield for the area; either an underpriced asset or a hidden risk that comps aren't pricing in. Stress-test before assuming the spread holds.
Location & tenants
- Location reads 83/100 on livability (#2 in MT, #926 nationally) — a professional / high-income tenant draw. Strengths: crime A+, employment A+, health & safety A+; Watch: cost of living D-.
- Monforton Elementary (rural): math 63% / reading 68% proficiency, ranked #5 of 116 in MT (top 4%) — acceptable for families but not a draw, mixed tenant base, ~2y average lease; only 16% free/reduced lunch — higher-income household profile.
- Market conditions: Rents soft (-0.6%/yr); 524 active listings in the ZIP; 1 comparable units currently listed for rent nearby; solid renter incomes; 1,706 units permitted in Gallatin County in 2024 (533 in 5+ unit buildings).
- This rent runs 33% of the median local income ($99k/yr) — at the standard rent-burdened threshold; future hikes will face affordability resistance.
Forward outlook
- Local home prices are declining (-3.0%/yr); year-one equity from $1k of loan paydown is wiped out by about $5k of value loss. Plan a longer hold.
- Gallatin County population projected at +61% by 2050 — long-run rental-demand tailwind backs the buy-and-hold thesis.
Negotiation context
- It's been on market 264 days — a 12% lower offer ($141k) is reasonable based on typical stale-listing flexibility.
- 2 sale attempts; this cycle's ask has dropped $19k (11%) from the opening price — seller is motivated, your offer sets the floor, not the list.
Risks & watch-outs
- Watch-outs: flood insurance adds $427/mo.
- Climate carrying-cost: in FEMA flood zone AE (mandatory federal flood insurance) — expect insurance premiums to compound above CPI over the hold.
Questions for the listing agent
- It's been on market 264 days. Have you received any prior offers? Is the seller open to a 12% concession, seller financing, or rate buy-down credit?
- What's the actual annual flood-insurance premium (NFIP or private), and is the property in a SFHA with mandatory coverage?
- Why hasn't it sold? Are there any deal-killer items the seller is aware of (foundation, flood, title, zoning, code violations)?
- Is there a deadline driving the sale (1031 exchange, divorce, estate, relocation)? That informs how much negotiation room exists.
- Schools are B-rated — typically a magnet for longer-tenancy family renters. What's the average tenant stay here, and is there a school-zone premium baked into asking?
- What's the average days-on-market for RENTAL listings here right now (not sales)? A rising rental-DOM trend means longer vacancies and softer asking-rent achievability than the comps imply.
- What's the recent tenant-quality profile in this submarket — average credit score on applications, eviction rate, late-payment / NSF rate, and stable-employment percentage? A property-management company in the area should have these aggregated.
- How much new for-sale + rental construction is in the pipeline within 1–3 miles? Heavy new supply typically softens prices + rents 12–24 months out; constrained supply supports both.
Investment metrics
- 1% rule
- 1.70% ✓
- Cap rate
- 14.10%
- Cash-on-cash
- 27.89%
- DSCR
- 2.24
- GRM
- 4.9
CMA / ARV
No comps found within radius.
Projected returns pro-forma
-3.0% appreciation · 0.0% rent growth · sell at horizon
- IRR
- 3.4%
- Equity multiple
- 1.12×
- Total profit
- $5,572
- Equity at exit
- $23,857
- IRR
- 9.0%
- Equity multiple
- 1.57×
- Total profit
- $25,728
- Equity at exit
- $13,834
Cash invested: $44,800 (down + closing). Projections, not guarantees.
Landlord ↔ Tenant lean methodology
- Overall (STATE)
- 82 Strongly Landlord-Friendly
- State Montana
- 82 Strongly Landlord-Friendly · R+11
- County
- — inherits STATE
- City
- — inherits STATE
ZIP-level market 59718
- Rents YoY
- -0.6%
- Active inventory
- 524
- Price-to-rent
- 4.9×
Monthly cashflow live
- Estimated rent
- $2,718 medium interval (Pro) →
- Mortgage (P&I)
- −$839
- Tax est. 1.5%
- −$200 /mo · $2,400/yr
- Insurance
- −$67
- Flood insurance flood zone
- −$427 /mo · $5,118/yr
- HOA
- −$0
- Vacancy / Maint / Mgmt
- −$571
- Net cashflow
- $615
Break-even live
Sensitivity live
| Price | -10% $725 | -5% $670 | +0% $615 | +5% $560 | +10% $504 |
|---|---|---|---|---|---|
| Rent | -10% $400 | -5% $508 | +0% $615 | +5% $722 | +10% $830 |
| Rate | -1.0pp $695 | -0.5pp $656 | base $615 | +0.5pp $573 | +1.0pp $531 |
UW: 25.0% down · 7.5% · 30yr · 1.5% tax · 5.0% vac · 8.0% maint · 8.0% mgmt
Financing live
Cash to close
- Down payment
- $40,000
- Closing costs
- $4,800
- Reserves months
- —
- Total cash needed
- —
Loan-product check · same deal, 3 products live
Conventional
25% down · 7.5% · 30yr
- Down + closing
- —
- Monthly P&I
- —
- Monthly cashflow
- —
- DSCR
- —
- Eligible?
- —
Personal DTI + credit; lowest rate.
DSCR
20% down · 8.5% · 30yr
- Down + closing
- —
- Monthly P&I
- —
- Monthly cashflow
- —
- DSCR
- —
- Eligible?
- —
No personal income docs; deal must DSCR.
Hard money
10% down · 12.0% · 12mo
- Down + closing
- —
- Monthly P&I
- —
- Monthly cashflow
- —
- DSCR
- —
- Eligible?
- —
Short-term bridge; refi at stabilization.
Rent comps 1 comps
| Address | Beds | Baths | Sqft | Rent | $/sqft | DOM | Units | Dist |
|---|---|---|---|---|---|---|---|---|
| 103 Covey Ct Unit C Bozeman, MT | 3.0 | 2.5 | 1561 | $2,600 | $1.67 | 22d | 1 | 1.05mi |
Listing history 21 events
-
2026-06-19days on market $160,000 Active 264 DOM
-
2026-06-18days on market $160,000 Active 263 DOM
-
2026-06-17days on market $160,000 Active 262 DOM
-
2026-06-16days on market $160,000 Active 261 DOM
-
2026-06-15days on market $160,000 Active 260 DOM
-
2026-06-14days on market $160,000 Active 258 DOM
-
2026-06-13days on market $160,000 Active 257 DOM
-
2026-06-10days on market $160,000 Active 255 DOM
-
2026-06-09days on market $160,000 Active 254 DOM
-
2026-06-08days on market $160,000 Active 253 DOM
-
2026-06-07days on market $160,000 Active 252 DOM
-
2026-06-02days on market $160,000 Active 247 DOM
-
2026-06-01days on market $160,000 Active 246 DOM
-
2026-05-31days on market $160,000 Active 245 DOM
-
2026-05-30days on market $160,000 Active 244 DOM
-
2026-05-15status Active
-
2026-03-18price $160,000
-
2026-01-29price $157,900
-
2025-11-06price $164,000
-
2025-09-11price $174,000
-
2025-08-02$179,000 Active
ⓘ Source: listings_history table (triggers on properties + properties_extension) + one-shot
backfill from property_details.listing_events for pre-trigger history.
Climate risk First Street
- Flood 5/10 Major FEMA zone AE · 48% chance over 30 yrs
- Wildfire 3/10 Moderate
- Heat 2/10 Low 7 d/yr ≥89°F today · 16 d/yr by 30 yrs out
- Wind 1/10 Low
- Air quality 5/10 Major 7 unhealthy d/yr today · 8 by 30 yrs out
Nearby sold comps map
Loading sold comps map…
Walkable amenities ~0.75 mi
Loading nearby amenities…
Taxation est. · year 1
- Rental income
- $32,615
- − Mortgage interest
- −$8,962
- − Property taxes
- −$2,400
- − Insurance
- −$5,918
- − Repairs & maintenance
- −$2,609
- − Management
- −$2,609
- − Depreciation
- −$4,655
- Taxable income
- $5,461
- Est. tax owed @ 24.0%
- −$1,311
- After-tax cash flow
- $6,068/yr
For passive investors: Depreciation is non-cash, so a rental often shows a tax loss while cash-flowing — sheltering income. Rental losses are passive: they offset passive income freely, and up to $25,000/yr can offset ordinary (W-2) income if you actively participate and your MAGI is under $100k (phasing out to $0 by $150k); unused losses carry forward. On sale, claimed depreciation is recaptured at up to 25%, and gains may owe capital-gains tax (a 1031 exchange can defer both). Figures are a year-1 estimate at your 24.0% rate — not tax advice; consult a CPA.
Schools (NCES district)
- District
- Monforton Elementary
- NCES district ID
- 3018750
- Math proficiency
- 63% ▼ -3.00%
- Reading proficiency
- 68% ▲ 1.00%
- Median HH income
- $61,222
- Composite
- 56.69/100
- National rank
- #1133
- State rank
- #5 of 116 in MT
Livability — Four Corners
- Score
- 83/100
- State rank
- #2
- US rank
- #926
Category grades
Schools grade is shown separately in the Schools card above.
Census & demographics
- Census place
- Four Corners, MT
- County
- Gallatin County · 108,510 people
- Metro
- Bozeman, MT
- Population (ZIP)
- 44,585
- Household income
- $99,123
- Rent vs Own
- Severe rent burden
- 1786.0
Population outlook (Gallatin County) Hauer SSP2
- Today (2025)
- 129,625 people
- By 2030
- 144,940 · +11.8%
- By 2040
- 176,266 · +36.0%
- By 2050
- 209,250 · +61.4%
- By 2075
- 294,207 · +127.0%
- By 2100
- 360,558 · +178.2%
Race, ethnicity, and origin ACS 2023
- Neighborhood character
- Predominantly White (89%)
- Race & ethnicity
- White 89% Two or more races 5% Hispanic / Latino 5% Asian 1%
- Common ancestry
- Portuguese 7% Slovak 4% Italian 3%
- Foreign-born
- 4% · Canada, China
- Languages at home
- 95% English-only · Spanish 3% Chinese 1%
Political lean MEDSL · Gallatin
- 2024 margin
- Toss-up / Even · D 50.0% · R 46.8% · Other 3.2%
- 2008→2024 swing
- -0.2pp no change · 2008: 3.4pp · 2024: 3.2pp
- All cycles
- 2024: D+3.2 2020: D+7.5 2016: D+1.0 2012: R+5.3 2008: D+3.4
Not yet ingested
- Civics
- —
Market trends
- HPI YoY
- ▼ -316.82%
- Current HPI
- 272.8072
- Rent YoY
- ▼ -0.61%
- Metro
- Bozeman, MT
- State GDP YoY
- ▲ 3.41%
- F500 in state
- 2
Industry mix (Fortune 500 HQ in MT)
| Industry | F500 HQs | Revenue |
|---|---|---|
| Technology / Analytics | 1 | $2B |
|
||
Price history
-10.6% since first listed6 events — show timeline
- 2026-05-15 Relisted — MRMLS
- 2026-03-18 Price Changed $160,000 MRMLS
- 2026-01-29 Price Changed $157,900 MRMLS
- 2025-11-06 Price Changed $164,000 MRMLS
- 2025-09-11 Price Changed $174,000 MRMLS
- 2025-08-02 Listed $179,000 MRMLS
Cash-flow waterfall
monthlySold comps — $/sqft
last 12 mo · ≤1 miLoading sold comps…