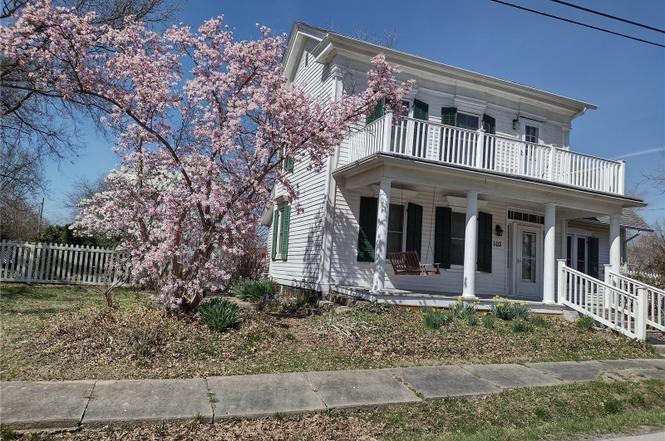
103 N Cherry N · Middletown, MO
Flood risk 1/10 · Minimal
- FEMA flood zone
- X (unshaded)
- Chance of flooding over 30 yrs
- 0.0%
- Est. flood insurance / yr
- $473 – $860
Fire risk 1/10 · Minimal
- Est. fire insurance / yr
- $1,054 – $1,958
Heat risk 4/10 · Minor
- Hot days now (above 107°F)
- 7 days/yr
- Hot days in 30 yrs
- 19 days/yr
Wind risk 2/10 · Minimal
- Chance of severe wind over 30 yrs
- 1.0%
Air-quality risk 1/10 · Minimal
- Unhealthy air days now
- 0 days/yr
- Unhealthy air days in 30 yrs
- 0 days/yr
Risk factors via First Street. Map © Google.
Why this score? — see what drove the C- grade
The composite is a weighted blend of 9 inputs, each scored 0–100. Each bar is that input's sub-score; the figure is the points it added to the 100-point composite (weight × sub-score).
- Cash flow +16.7/30.0
- ARV discount +7.5/15.0
- Appreciation +6.9/10.0
- DSCR +5.2/10.0
- 1% rule +3.5/10.0
- Schools +3.0/10.0
- Livability +2.7/5.0
- Rent growth +2.5/5.0
- Condition / age +2.5/5.0
$103,000
🖨 Deal sheet (PDF) 📄 Offer letter ✓ Due diligence
Listing remarks
Welcome to this beautiful country style farmhouse home. Postcard perfect !! This 3 bedroom 1 bath house boasts tall ceilings and old time country charm. Beautiful wood trim and stairway are true to the era of when this home was built. Picket white fence surrounds mature seasonal flowers and plants. Detached 2 car oversized garage with work room and half bath and an additional carport.
Key facts
- 0.33 acre lot
- 2 garage spots
- Listed 444 days
Property features AI
Exterior
- Parking: 3 parking spaces total; Detached 2-car garage; Covered parking; 1-car carport; Off-street and RV access/parking
- Security: Security lights
- Utilities: Public water; Public sewer; Electric service
- Home design: Single-family residence; One and one-half levels; Private ownership
- Construction: Wood siding with cedar; Cellar basement
- Exterior features: Shed(s); Gravel road access; Lot roughly 120 x 120
Interior
- Kitchen: Eat-in kitchen; Kitchen/dining room combo
- Bedrooms: 3 bedrooms total (1 on the main level, 2 on the upper level)
- Bathrooms: 1 full bathroom (main level)
- Heating & cooling: Heat pump heating; Electric heating; Heat pump cooling
- Interior features: Primary bedroom on the main level; Kitchen/dining room combo; Eat-in kitchen; Gas water heater
- Laundry & utility: Gas water heater
Neighborhood map
What this means for you Summary
Snapshot
- This is a 2-bed/1.0-bath other listed at $103k.
Deal economics
- At list price, monthly cash flow is $65 ($780/yr) — positive.
- The deal already cash-flows at list — no discount required.
- To meet the 1% rule (rent ≥ 1% of price), the offer needs to be $88k (15.0% below list).
- Recommended offer: $88k (15.0% below list) — sets the bar for 1% rule.
Location & tenants
- Location reads 53/100 on livability (#823 in MO) — a working-class tenant base; expect higher turnover. Strengths: cost of living A+, housing A+; Watch: crime F, amenities F, commute F.
- Wellsville Middletown R-I (rural): math 25% / reading 40% proficiency, ranked #433 of 535 in MO (top 81%) — families likely to look elsewhere, expect single-tenant / working-renter base with shorter leases.
- Zoned schools: Wellsville-Middletown Elem. (math 37% / reading 27%, grade F, #761 of 1,115 statewide, top 72%, 148 students, 60% FRL); Wellsville-Middletown Hs (math 37% / reading 42%, grade F, #247 of 521 statewide, top 55%, 163 students, 53% FRL).
- Market conditions: 9 active listings in the ZIP; 47 units permitted in Montgomery County in 2024 (0 in 5+ unit buildings).
Forward outlook
- In year one you build about $5k of equity ($712 loan paydown + $4k appreciation (3.9% local appreciation)).
- Montgomery County population projected at -31% by 2050 — secular population decline; favor cash flow + early exit over multi-decade hold.
- At projected returns (3.9% appreciation + 3.0% rent growth), your $29k cash investment doubles in ~5 years — after that, you're playing with house money.
- By year 8, paydown + projected appreciation supports a ~$35k cash-out refi (75% LTV) — recoverable capital for the next deal without selling this one.
Negotiation context
- It's been on market 445 days — a 12% lower offer ($91k) is reasonable based on typical stale-listing flexibility.
- 3 sale attempts with the ask held roughly flat each time — persistent listings suggest the price (not the market) is what's stuck; bring a comps-based counter.
Risks & watch-outs
- Watch-outs: built in 1900 — expect roof / HVAC / electrical / plumbing capex.
Questions for the listing agent
- It's been on market 445 days. Have you received any prior offers? Is the seller open to a 15% concession, seller financing, or rate buy-down credit?
- Built in 1900 — when were the roof, HVAC, electrical panel, plumbing, and water heater last replaced?
- Why hasn't it sold? Are there any deal-killer items the seller is aware of (foundation, flood, title, zoning, code violations)?
- Is there a deadline driving the sale (1031 exchange, divorce, estate, relocation)? That informs how much negotiation room exists.
- Schools are F-rated, which usually means shorter tenancies and higher turnover. Who's the typical renter profile here, and what's been the actual vacancy rate?
- Crime grade is F in this area — have there been break-ins, vandalism, or insurance claims at this property in the last 3 years? What carrier currently insures it and at what premium?
- What's the average days-on-market for RENTAL listings here right now (not sales)? A rising rental-DOM trend means longer vacancies and softer asking-rent achievability than the comps imply.
- What's the recent tenant-quality profile in this submarket — average credit score on applications, eviction rate, late-payment / NSF rate, and stable-employment percentage? A property-management company in the area should have these aggregated.
- How much new for-sale + rental construction is in the pipeline within 1–3 miles? Heavy new supply typically softens prices + rents 12–24 months out; constrained supply supports both.
Investment metrics
- 1% rule
- 0.85% ✗
- Cap rate
- 7.05%
- Cash-on-cash
- 2.70%
- DSCR
- 1.12
- GRM
- 9.8
CMA / ARV
No comps found within radius.
Projected returns pro-forma
3.85% appreciation · 3.0% rent growth · sell at horizon
- IRR
- 12.3%
- Equity multiple
- 1.73×
- Total profit
- $21,191
- Equity at exit
- $51,295
- IRR
- 13.8%
- Equity multiple
- 3.22×
- Total profit
- $64,014
- Equity at exit
- $83,166
Cash invested: $28,840 (down + closing). Projections, not guarantees.
Landlord ↔ Tenant lean methodology
- Overall (STATE)
- 81 Strongly Landlord-Friendly
- State Missouri
- 81 Strongly Landlord-Friendly · R+10
- County
- — inherits STATE
- City
- — inherits STATE
ZIP-level market 63384
- Home prices YoY
- 2.8%
- Active inventory
- 9
- Price-to-rent
- 9.8×
Monthly cashflow live
- Estimated rent
- $876 medium interval (Pro) →
- Mortgage (P&I)
- −$540
- Tax from tax record
- −$44 /mo · $528/yr
- Insurance
- −$43
- HOA
- −$0
- Vacancy / Maint / Mgmt
- −$184
- Net cashflow
- $65
Break-even live
Sensitivity live
| Price | -10% $123 | -5% $94 | +0% $65 | +5% $36 | +10% $7 |
|---|---|---|---|---|---|
| Rent | -10% $-4 | -5% $30 | +0% $65 | +5% $100 | +10% $134 |
| Rate | -1.0pp $117 | -0.5pp $91 | base $65 | +0.5pp $38 | +1.0pp $11 |
UW: 25.0% down · 7.5% · 30yr · 1.5% tax · 5.0% vac · 8.0% maint · 8.0% mgmt
Financing live
Cash to close
- Down payment
- $25,750
- Closing costs
- $3,090
- Reserves months
- —
- Total cash needed
- —
Loan-product check · same deal, 3 products live
Conventional
25% down · 7.5% · 30yr
- Down + closing
- —
- Monthly P&I
- —
- Monthly cashflow
- —
- DSCR
- —
- Eligible?
- —
Personal DTI + credit; lowest rate.
DSCR
20% down · 8.5% · 30yr
- Down + closing
- —
- Monthly P&I
- —
- Monthly cashflow
- —
- DSCR
- —
- Eligible?
- —
No personal income docs; deal must DSCR.
Hard money
10% down · 12.0% · 12mo
- Down + closing
- —
- Monthly P&I
- —
- Monthly cashflow
- —
- DSCR
- —
- Eligible?
- —
Short-term bridge; refi at stabilization.
Listing history 24 events
-
2026-06-22days on market $103,000 Active 445 DOM
-
2026-06-21days on market $103,000 Active 444 DOM
-
2026-06-21days on market $103,000 Active 443 DOM
-
2026-06-18days on market $103,000 Active 441 DOM
-
2026-06-17days on market $103,000 Active 440 DOM
-
2026-06-16days on market $103,000 Active 439 DOM
-
2026-06-15days on market $103,000 Active 438 DOM
-
2026-06-13days on market $103,000 Active 436 DOM
-
2026-06-12days on market $103,000 Active 435 DOM
-
2026-06-09days on market $103,000 Active 432 DOM
-
2026-06-08days on market $103,000 Active 431 DOM
-
2026-06-07days on market $103,000 Active 430 DOM
-
2026-06-05days on market $103,000 Active 428 DOM
-
2026-06-04days on market $103,000 Active 426 DOM
-
2026-06-02days on market $103,000 Active 425 DOM
-
2026-06-01days on market $103,000 Active 424 DOM
-
2026-05-31days on market $103,000 Active 423 DOM
-
2025-08-05$103,000 Active
-
2025-07-29price $103,000
-
2025-07-29status Active
-
2025-06-03status Pending
-
2025-05-13price $108,000
-
2025-02-07price $110,000
-
2025-02-07$100,000 Active
ⓘ Source: listings_history table (triggers on properties + properties_extension) + one-shot
backfill from property_details.listing_events for pre-trigger history.
Tax reassessment forecast MO · Resets to sale price
- Current annual tax
- $528 · $44/mo
- Projected year-2 tax
- $999 · $83/mo
- Expected delta
- +$471/yr (+$39/mo · 89.3%)
ⓘ Screening estimate from a state-policy table — verify with the county assessor before closing.
Climate risk First Street
- Flood 1/10 Low FEMA zone X (unshaded) · 0% chance over 30 yrs
- Wildfire 1/10 Low
- Heat 4/10 Moderate 7 d/yr ≥107°F today · 19 d/yr by 30 yrs out
- Wind 2/10 Low 100% chance of damaging wind over 30 yrs
- Air quality 1/10 Low 0 unhealthy d/yr today · 0 by 30 yrs out
Nearby sold comps map
Loading sold comps map…
Walkable amenities ~0.75 mi
Loading nearby amenities…
Taxation est. · year 1
- Rental income
- $10,512
- − Mortgage interest
- −$5,770
- − Property taxes
- −$528
- − Insurance
- −$515
- − Repairs & maintenance
- −$841
- − Management
- −$841
- − Depreciation
- −$2,996
- Taxable loss
- −$979
- Est. tax savings @ 24.0%
- +$235
- After-tax cash flow
- $1,015/yr
For passive investors: Depreciation is non-cash, so a rental often shows a tax loss while cash-flowing — sheltering income. Rental losses are passive: they offset passive income freely, and up to $25,000/yr can offset ordinary (W-2) income if you actively participate and your MAGI is under $100k (phasing out to $0 by $150k); unused losses carry forward. On sale, claimed depreciation is recaptured at up to 25%, and gains may owe capital-gains tax (a 1031 exchange can defer both). Figures are a year-1 estimate at your 24.0% rate — not tax advice; consult a CPA.
Schools (NCES district)
- District
- Wellsville Middletown R-I
- NCES district ID
- 2931620
- Math proficiency
- 25% ▼ -15.00%
- Reading proficiency
- 40% ▼ -5.00%
- Median HH income
- $38,226
- Composite
- 29.86/100
- National rank
- #11693
- State rank
- #433 of 535 in MO
Livability — Middletown
- Score
- 53/100
- State rank
- #823
- US rank
- #24464
Category grades
Schools grade is shown separately in the Schools card above.
Census & demographics
- Census place
- Middletown, MO
- Population (ZIP)
- 2,148
Population outlook (Montgomery County) Hauer SSP2
- Today (2025)
- 10,582 people
- By 2030
- 9,897 · -6.5%
- By 2040
- 8,556 · -19.1%
- By 2050
- 7,293 · -31.1%
- By 2075
- 4,998 · -52.8%
- By 2100
- 3,204 · -69.7%
Race, ethnicity, and origin ACS 2023
- Neighborhood character
- Predominantly White (93%)
- Race & ethnicity
- White 93% Two or more races 6%
- Common ancestry
- Slovak 3%
- Languages at home
- 97% English-only · German/W. Germanic 2% French/Haitian/Cajun 1%
Political lean MEDSL · Montgomery
- 2024 margin
- Solid R (+60.1) · D 19.5% · R 79.7%
- 2008→2024 swing
- -41.7pp toward R · 2008: -18.5pp · 2024: -60.1pp
- All cycles
- 2024: R+60.1 2020: R+56.4 2016: R+55.4 2012: R+33.0 2008: R+18.5
Not yet ingested
- Civics
- —
Market trends
- HPI YoY
- ▲ 3.85%
- Current HPI
- 143.7565
- Rent YoY
- —
- Metro
- —
- State GDP YoY
- ▲ 1.84%
- F500 in state
- 20
Industry mix (Fortune 500 HQ in MO)
| Industry | F500 HQs | Revenue |
|---|---|---|
| Healthcare | 1 | $163B |
|
||
| Insurance | 1 | $21B |
|
||
| Industrial Technology | 1 | $17B |
|
||
| Retail | 1 | $16B |
|
||
| Industrial Distribution | 1 | $10B |
|
||
| Utilities | 1 | $9B |
|
||
Price history
+3.0% since first listed7 events — show timeline
- 2025-08-05 Listed $103,000 MARIS as Distributed by MLS Grid
- 2025-07-29 Price Changed $103,000 MARIS as Distributed by MLS Grid
- 2025-07-29 Relisted — MARIS as Distributed by MLS Grid
- 2025-06-03 Pending — MARIS as Distributed by MLS Grid
- 2025-05-13 Price Changed $108,000 MARIS as Distributed by MLS Grid
- 2025-02-07 Price Changed $110,000 MARIS as Distributed by MLS Grid
- 2025-02-07 Listed $100,000 MARIS as Distributed by MLS Grid
Property tax history
+3.0%/yrLatest (2025): $528 · +8.0% YoY. Source: county tax records.
Cash-flow waterfall
monthlySold comps — $/sqft
last 12 mo · ≤1 miLoading sold comps…