 Duplex
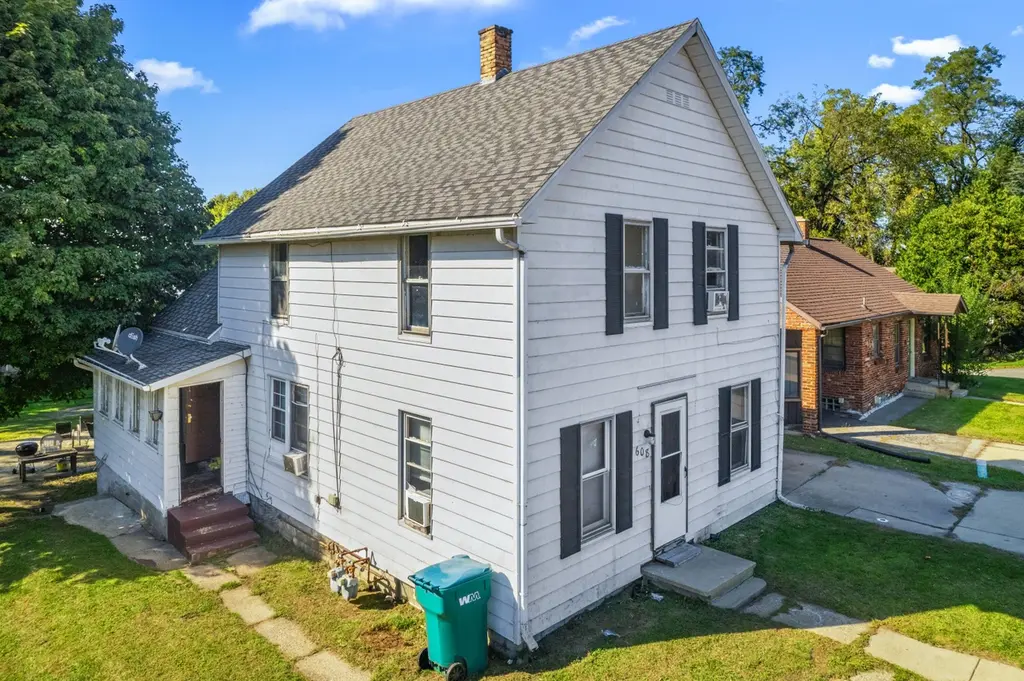
608 Pine Lake Ave · La Porte, IN
Flood risk 1/10 · Minimal
- FEMA flood zone
- X (unshaded)
- Chance of flooding over 30 yrs
- 0.0%
- Est. flood insurance / yr
- $473 – $860
Fire risk 1/10 · Minimal
- Est. fire insurance / yr
- $717 – $1,331
Heat risk 2/10 · Minimal
- Hot days now (above 99°F)
- 7 days/yr
- Hot days in 30 yrs
- 15 days/yr
Wind risk 2/10 · Minimal
- Chance of severe wind over 30 yrs
- —
Air-quality risk 2/10 · Minimal
- Unhealthy air days now
- 2 days/yr
- Unhealthy air days in 30 yrs
- 2 days/yr
Risk factors via First Street. Map © Google.
Why this score? — see what drove the B- grade
The composite is a weighted blend of 9 inputs, each scored 0–100. Each bar is that input's sub-score; the figure is the points it added to the 100-point composite (weight × sub-score).
- Cash flow +30.0/30.0
- 1% rule +10.0/10.0
- DSCR +10.0/10.0
- ARV discount +7.5/15.0
- Livability +3.7/5.0
- Schools +3.5/10.0
- Rent growth +2.5/5.0
- Condition / age +2.5/5.0
- Appreciation +0.0/10.0
$129,000
🖨 Deal sheet 📄 Offer letter ✓ Due diligence
Multi-family units
County records classify this as Multi-Family (2-4 Unit). Listing-text estimate: 2 units. confirmed
Listing remarks MLS
Nice 2 unit on Pine Lake Ave with beach rights and private Shore Acres beach. Both units have 2 bedrooms and 1 bath, separate utilities except water, $16,200/year gross rent.
Key facts
- 6,100 sq ft lot
- Built 1880
- Listed 2 days
Property features AI
Finance
- Other: Property contains 2 total units
Exterior
- Utilities: Electricity connected; Natural gas connected; Public water; Public sewer
- Home design: Two-story house; Built in 1880
- Construction: Year built: 1880
- Exterior features: Lake view; Other views
Interior
- Kitchen: Gas range; Additional appliances: other
- Bathrooms: 2 full bathrooms
- Heating & cooling: Forced air heating; Individual cooling units
- Interior features: Other interior features; Pets allowed: contact listing for details
Neighborhood map
What this means for you Summary
Snapshot
- This is a 2 × 2-bed/1.0-bath units multifamily listed at $129k.
Deal economics
- At list price, monthly cash flow is $879 ($11k/yr) — positive. Per door: $439/mo.
- The deal already cash-flows at list — no discount required.
- Meets the 1% rule at list price ($2k rent vs $129k).
- Cap rate 14.5% vs local median 3.7% in La Porte — top-decile yield for the area; either an underpriced asset or a hidden risk that comps aren't pricing in. Stress-test before assuming the spread holds.
Location & tenants
- Location reads 74/100 on livability (#81 in IN, #4,852 nationally) — a middle-class / working-renter tenant base. Strengths: amenities A+, cost of living A+, housing A+; Watch: schools C-, commute F, employment F.
- Laporte Community School Corporation (urban): math 37% / reading 44% proficiency, ranked #139 of 301 in IN (top 46%) — families likely to look elsewhere, expect single-tenant / working-renter base with shorter leases.
- Market conditions: 260 active listings in the ZIP; 216 units permitted in LaPorte County in 2024 (75 in 5+ unit buildings).
- This rent runs 36% of the median local income ($74k/yr) — at the standard rent-burdened threshold; future hikes will face affordability resistance.
Forward outlook
- Local home prices are declining (-3.0%/yr); year-one equity from $892 of loan paydown is wiped out by about $4k of value loss. Plan a longer hold.
- LaPorte County population projected to shrink 7% by 2050 — rents likely to lag national; underwrite the cash flow, not the appreciation.
- At projected returns (-3.0% appreciation + 3.0% rent growth), your $36k cash investment doubles in ~5 years — after that, you're playing with house money.
Negotiation context
- Only 2 days on market — expect competitive offers; lowballing is unlikely to land.
- 9 sale attempts since 22y ago with the ask held roughly flat each time — persistent listings suggest the price (not the market) is what's stuck; bring a comps-based counter.
- Current owner paid $104k; 23% above their basis — modest negotiation headroom, anchor on the comps not their cost.
Risks & watch-outs
- Watch-outs: built in 1880 — expect roof / HVAC / electrical / plumbing capex.
Questions for the listing agent
- Can we see the unit-by-unit rent roll, current vacancy, and any below-market leases? What's the average tenancy length?
- What capital expenditures (roof, boiler, parking lot, exteriors) have been made in the last 5 years, and what's planned in the next 2?
- Built in 1880 — when were the roof, HVAC, electrical panel, plumbing, and water heater last replaced?
- Is there a deadline driving the sale (1031 exchange, divorce, estate, relocation)? That informs how much negotiation room exists.
- What's the average days-on-market for RENTAL listings here right now (not sales)? A rising rental-DOM trend means longer vacancies and softer asking-rent achievability than the comps imply.
- What's the recent tenant-quality profile in this submarket — average credit score on applications, eviction rate, late-payment / NSF rate, and stable-employment percentage? A property-management company in the area should have these aggregated.
- How much new apartment / multifamily construction is in the pipeline within 1–3 miles? Heavy new supply (>2% of stock underway) typically softens rents 12–24 months out; light construction supports rent growth.
Investment metrics
- 1% rule
- 1.74% ✓
- Cap rate
- 14.47%
- Cash-on-cash
- 29.20%
- DSCR
- 2.30
- GRM
- 4.8
CMA / ARV
No comps found within radius.
Projected returns pro-forma
-3.0% appreciation · 3.0% rent growth · sell at horizon
- IRR
- 23.6%
- Equity multiple
- 1.97×
- Total profit
- $35,109
- Equity at exit
- $19,234
- IRR
- 31.5%
- Equity multiple
- 3.85×
- Total profit
- $102,793
- Equity at exit
- $11,154
Cash invested: $36,120 (down + closing). Projections, not guarantees.
Landlord ↔ Tenant lean methodology
- Overall (STATE)
- 90 Strongly Landlord-Friendly
- State Indiana
- 90 Strongly Landlord-Friendly · R+11
- County
- — inherits STATE
- City
- — inherits STATE
ZIP-level market 46350
- Active inventory
- 260
- Price-to-rent
- 9.6×
Monthly cashflow live
- Estimated rent
- $2,243 medium interval (Pro) →
- Mortgage (P&I)
- −$676
- Tax from tax record
- −$163 /mo · $1,954/yr
- Insurance
- −$54
- HOA
- −$0
- Vacancy / Maint / Mgmt
- −$471
- Net cashflow
- $879
Break-even live
Sensitivity live
| Price | -10% $952 | -5% $915 | +0% $879 | +5% $842 | +10% $806 |
|---|---|---|---|---|---|
| Rent | -10% $702 | -5% $790 | +0% $879 | +5% $967 | +10% $1,056 |
| Rate | -1.0pp $944 | -0.5pp $912 | base $879 | +0.5pp $845 | +1.0pp $811 |
2-unit breakdown (identical units grouped — click to expand)
| Units | Beds | Baths | Est. rent |
|---|---|---|---|
| 2× units | 2 | 1 | $2,244 |
| #1 | 2 | 1 | $1,122 |
| #2 | 2 | 1 | $1,122 |
| Total (2 units) | $2,243 | ||
UW: 25.0% down · 7.5% · 30yr · 1.5% tax · 5.0% vac · 8.0% maint · 8.0% mgmt
Financing live
Cash to close
- Down payment
- $32,250
- Closing costs
- $3,870
- Reserves months
- —
- Total cash needed
- —
Loan-product check · same deal, 3 products live
Conventional
25% down · 7.5% · 30yr
- Down + closing
- —
- Monthly P&I
- —
- Monthly cashflow
- —
- DSCR
- —
- Eligible?
- —
Personal DTI + credit; lowest rate.
DSCR
20% down · 8.5% · 30yr
- Down + closing
- —
- Monthly P&I
- —
- Monthly cashflow
- —
- DSCR
- —
- Eligible?
- —
No personal income docs; deal must DSCR.
Hard money
10% down · 12.0% · 12mo
- Down + closing
- —
- Monthly P&I
- —
- Monthly cashflow
- —
- DSCR
- —
- Eligible?
- —
Short-term bridge; refi at stabilization.
Listing history 19 events
-
2026-05-21status Pending
-
2026-05-19$129,000 Active
-
2024-12-06historical
-
2024-11-12price $134,000
-
2024-10-08$144,000 Active
-
2022-01-17soldstatus $104,500 Closed 174-char remark
Show marketing remark (174 chars)
Nice 2 unit on Pine Lake Ave with beach rights and private Shore Acres beach. Both units have 2 bedrooms and 1 bath, separate utilities except water, $16,200/year gross rent.
-
2022-01-10status Pending 174-char remark
Show marketing remark (174 chars)
Nice 2 unit on Pine Lake Ave with beach rights and private Shore Acres beach. Both units have 2 bedrooms and 1 bath, separate utilities except water, $16,200/year gross rent.
-
2021-11-03Active Under Contract 174-char remark
Show marketing remark (174 chars)
Nice 2 unit on Pine Lake Ave with beach rights and private Shore Acres beach. Both units have 2 bedrooms and 1 bath, separate utilities except water, $16,200/year gross rent.
-
2021-07-13$109,000 174-char remark
Show marketing remark (174 chars)
Nice 2 unit on Pine Lake Ave with beach rights and private Shore Acres beach. Both units have 2 bedrooms and 1 bath, separate utilities except water, $16,200/year gross rent.
-
2014-06-21historical
-
2012-04-23$85,000
-
2012-03-21historical
-
2010-05-20$86,900
-
2007-02-06historical
-
2007-02-06$85,999
-
2005-11-04$87,900
-
2004-11-30soldstatus $60,000
-
2004-11-23soldstatus $60,000
-
2004-07-27$69,900
ⓘ Source: listings_history table (triggers on properties + properties_extension) + one-shot
backfill from property_details.listing_events for pre-trigger history.
Tax reassessment forecast IN · Partial reset (capped growth)
- Current annual tax
- $1,954 · $163/mo
- Projected year-2 tax
- $1,954 · $163/mo
- Expected delta
- $0/yr ($0/mo · 0.0%)
ⓘ Screening estimate from a state-policy table — verify with the county assessor before closing.
Climate risk First Street
- Flood 1/10 Low FEMA zone X (unshaded) · 0% chance over 30 yrs
- Wildfire 1/10 Low
- Heat 2/10 Low 7 d/yr ≥99°F today · 15 d/yr by 30 yrs out
- Wind 2/10 Low
- Air quality 2/10 Low 2 unhealthy d/yr today · 2 by 30 yrs out
Nearby sold comps map
Loading sold comps map…
Walkable amenities ~0.75 mi
Loading nearby amenities…
Taxation est. · year 1
- Rental income
- $26,916
- − Mortgage interest
- −$7,226
- − Property taxes
- −$1,954
- − Insurance
- −$645
- − Repairs & maintenance
- −$2,153
- − Management
- −$2,153
- − Depreciation
- −$3,753
- Taxable income
- $9,032
- Est. tax owed @ 24.0%
- −$2,168
- After-tax cash flow
- $8,379/yr
For passive investors: Depreciation is non-cash, so a rental often shows a tax loss while cash-flowing — sheltering income. Rental losses are passive: they offset passive income freely, and up to $25,000/yr can offset ordinary (W-2) income if you actively participate and your MAGI is under $100k (phasing out to $0 by $150k); unused losses carry forward. On sale, claimed depreciation is recaptured at up to 25%, and gains may owe capital-gains tax (a 1031 exchange can defer both). Figures are a year-1 estimate at your 24.0% rate — not tax advice; consult a CPA.
Schools (NCES district)
- District
- Laporte Community School Corporation
- NCES district ID
- 1805580
- Math proficiency
- 37% ▼ -13.00%
- Reading proficiency
- 44% ▼ -11.00%
- Median HH income
- $46,761
- Composite
- 34.58/100
- National rank
- #5162
- State rank
- #139 of 301 in IN
Livability — La Porte
- Score
- 74/100
- State rank
- #81
- US rank
- #4852
Category grades
Schools grade is shown separately in the Schools card above.
Census & demographics
- Census place
- La Porte, IN
- County
- La Porte County · 88,580 people
- City population
- 44,763
- Metro
- Michigan City-La Porte, IN
- Population (ZIP)
- 44,763
- Household income
- $74,307
- Rent vs Own
- Severe rent burden
- 835.0
Population outlook (LaPorte County) Hauer SSP2
- Today (2025)
- 109,757 people
- By 2030
- 108,288 · -1.3%
- By 2040
- 105,070 · -4.3%
- By 2050
- 102,330 · -6.8%
- By 2075
- 97,009 · -11.6%
- By 2100
- 86,459 · -21.2%
Race, ethnicity, and origin ACS 2023
- Neighborhood character
- Predominantly White (82%)
- Race & ethnicity
- White 82% Two or more races 8% Hispanic / Latino 8% Black 3%
- Hispanic origin (detail)
- Mexican 6%
- Common ancestry
- Romanian 11% Iranian 3% Italian 2%
- Foreign-born
- 4% · Canada
- Languages at home
- 93% English-only · Spanish 4% Russian/Polish/Slavic 1% German/W. Germanic 1%
Political lean MEDSL · LaPorte
- 2024 margin
- R (+14.1) · D 42.1% · R 56.2% · Other 1.7%
- 2008→2024 swing
- -19.1pp toward R · 2008: 5.0pp · 2024: -14.1pp
- All cycles
- 2024: R+14.1 2020: R+7.2 2016: R+6.4 2012: D+12.6 2008: D+5.0
Not yet ingested
- Civics
- —
Market trends
- HPI YoY
- ▼ -142.94%
- Current HPI
- 209.2564
- Rent YoY
- —
- Metro
- Michigan City-La Porte, IN
- State GDP YoY
- ▲ 2.90%
- F500 in state
- 18
Industry mix (Fortune 500 HQ in IN)
| Industry | F500 HQs | Revenue |
|---|---|---|
| Industrial Machinery | 2 | $37B |
|
||
| Healthcare | 1 | $177B |
|
||
| Pharmaceuticals | 1 | $45B |
|
||
| Metals / Steel | 1 | $18B |
|
||
| Agriculture | 1 | $17B |
|
||
| Packaging | 1 | $12B |
|
||
Price history
+84.5% since first listed19 events — show timeline
- 2026-05-21 Pending — NIRA MLS as Distributed by MLS Grid
- 2026-05-19 Listed $129,000 NIRA MLS as Distributed by MLS Grid
- 2024-12-06 Listing Removed — NIRA MLS as Distributed by MLS Grid
- 2024-11-12 Price Changed $134,000 NIRA MLS as Distributed by MLS Grid
- 2024-10-08 Listed $144,000 NIRA MLS as Distributed by MLS Grid
- 2022-01-17 Sold (MLS) $104,500 NIRA MLS as Distributed by MLS Grid
- 2022-01-10 Pending — NIRA MLS as Distributed by MLS Grid
- 2021-11-03 Listed — NIRA MLS as Distributed by MLS Grid
- 2021-07-13 Listed $109,000 NIRA MLS as Distributed by MLS Grid
- 2014-06-21 Listing Removed — NIRA MLS as Distributed by MLS Grid
- 2012-04-23 Listed $85,000 NIRA MLS as Distributed by MLS Grid
- 2012-03-21 Listing Removed — NIRA MLS as Distributed by MLS Grid
- 2010-05-20 Listed $86,900 NIRA MLS as Distributed by MLS Grid
- 2007-02-06 Listing Removed — NIRA MLS as Distributed by MLS Grid
- 2007-02-06 Listed $85,999 NIRA MLS as Distributed by MLS Grid
- 2005-11-04 Listed $87,900 NIRA MLS as Distributed by MLS Grid
- 2004-11-30 Sold (Public Records) $60,000 Public Records
- 2004-11-23 Sold (Public Records) $60,000 Public Records
- 2004-07-27 Listed $69,900 NIRA MLS as Distributed by MLS Grid
Property tax history
+2.7%/yrLatest (2024): $1,954 · +0.2% YoY. Source: county tax records.
Cash-flow waterfall
monthlySold comps — $/sqft
last 12 mo · ≤1 miLoading sold comps…