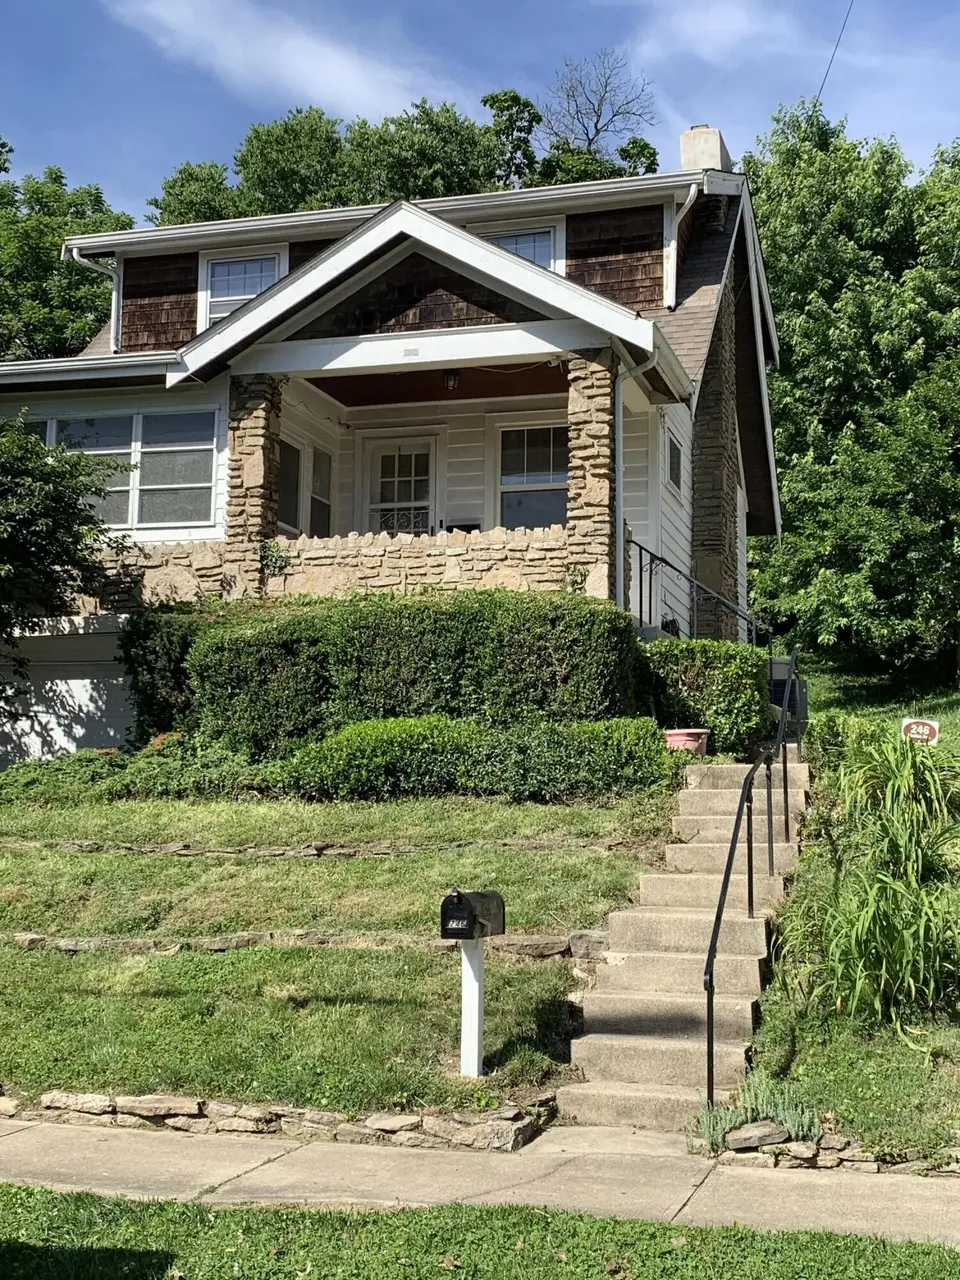
246 Linden Ave · Southgate, KY
Flood risk 1/10 · Minimal
- FEMA flood zone
- X (unshaded)
- Chance of flooding over 30 yrs
- 0.0%
- Est. flood insurance / yr
- $507 – $1,088
Fire risk 1/10 · Minimal
- Est. fire insurance / yr
- $839 – $1,559
Heat risk 4/10 · Minor
- Hot days now (above 103°F)
- 7 days/yr
- Hot days in 30 yrs
- 19 days/yr
Wind risk 2/10 · Minimal
- Chance of severe wind over 30 yrs
- 1.0%
Air-quality risk 3/10 · Minor
- Unhealthy air days now
- 2 days/yr
- Unhealthy air days in 30 yrs
- 3 days/yr
Risk factors via First Street. Map © Google.
Why this score? — see what drove the D grade
The composite is a weighted blend of 9 inputs, each scored 0–100. Each bar is that input's sub-score; the figure is the points it added to the 100-point composite (weight × sub-score).
- Cash flow +13.6/30.0
- ARV discount +7.0/15.0
- Livability +4.2/5.0
- DSCR +4.1/10.0
- Schools +4.1/10.0
- 1% rule +3.8/10.0
- Rent growth +3.7/5.0
- Condition / age +2.5/5.0
- Appreciation +0.0/10.0
$185,000
🖨 Deal sheet (PDF) 📄 Offer letter ✓ Due diligence
Listing remarks
Close to everything and a very walkable neighborhood. This two bedroom home features hardwood floors, built in garage, private backyard, central air and an excellent porch with glassed in area. Old world charm beautiful fireplace in living room with picture frame hardwood flooring in both living room and dining. Washer, dryer, stove & refrigerator are included. Showings start on Wednesday 6/3/26. Images with furniture are AI generated.
Key facts
- Private backyard
- Central air
- Hardwood floors
Tags
Property features AI
Exterior
- Parking: Driveway; Garage faces front; 1-car garage
- Utilities: Public water; Public sewer; Cable available; Natural gas available
- Home design: Single family residence; Two levels; Existing structure; City street frontage
- Construction: Block foundation; Block, cedar, concrete, stone, and wood siding construction
- Exterior features: Covered, enclosed porch; Private yard; Partial fencing; Sloped lot; Double-hung windows with wood frames; Shingle roof
Interior
- Kitchen: Gas range; Gas oven; Refrigerator
- Bedrooms: Primary bedroom (14 x 12); Bedroom 2 (12 x 10)
- Bathrooms: 1 full bathroom (9 x 8)
- Heating & cooling: Central air; Has heating
- Interior features: Built-in features; Natural woodwork; Stone gas fireplace
- Laundry & utility: Washer hookup; Electric dryer hookup; Laundry in basement
Neighborhood map
What this means for you Summary
Snapshot
- This is a 2-bed/1.0-bath single-family listed at $185k.
Deal economics
- At list price, monthly cash flow is $9 ($104/yr) — positive.
- The deal already cash-flows at list — no discount required.
- To meet the 1% rule (rent ≥ 1% of price), the offer needs to be $163k (11.9% below list).
- Recommended offer: $163k (11.9% below list) — sets the bar for 1% rule.
- Cap rate 6.3% vs local median 4.0% in Southgate — top-decile yield for the area; either an underpriced asset or a hidden risk that comps aren't pricing in. Stress-test before assuming the spread holds.
Location & tenants
- Location reads 85/100 on livability (#45 in KY, #513 nationally) — a professional / high-income tenant draw. Strengths: crime A+, commute A+, cost of living A+; Watch: amenities F.
- Southgate Independent (suburban): math 35% / reading 55% proficiency, ranked #119 of 173 in KY (top 69%) — families likely to look elsewhere, expect single-tenant / working-renter base with shorter leases; 60% free/reduced lunch — lower-income household profile, screen leases tightly.
- Zoned schools: Southgate Public School (math 12% / reading 32%, grade F, #525 of 676 statewide, top 82%, 207 students, 87% FRL) — zoned schools average 87% FRL vs 60% district-wide (27 pts higher); higher-poverty schools than district average — tighter screening recommended.
- Zoned-school proficiency averages 22% at this address vs 45% district-wide (-23 pts) — the specific schools serving this property underperform the Southgate Independent average; the district grade overstates school quality for this exact location.
- Market conditions: Rents rising fast (+4.6%/yr); 239 active listings in the ZIP; 13 comparable units currently listed for rent nearby; rentals leasing fast (median 10d on market — plan ~1-2 weeks tenant-placement turnaround); 247 units permitted in Campbell County in 2024 (77 in 5+ unit buildings).
- This rent runs 33% of the median local income ($60k/yr) — at the standard rent-burdened threshold; future hikes will face affordability resistance.
Forward outlook
- Local home prices are declining (-3.0%/yr); year-one equity from $1k of loan paydown is wiped out by about $6k of value loss. Plan a longer hold.
Negotiation context
- It's been on market 22 days — a 2% lower offer ($182k) is reasonable based on typical stale-listing flexibility.
- 2 sale attempts since 20y ago with the ask held roughly flat each time — persistent listings suggest the price (not the market) is what's stuck; bring a comps-based counter.
- Current owner paid $83k; list at $185k implies a 123% gain — meaningful room to come down on a strong offer.
Risks & watch-outs
- Watch-outs: built in 1930 — expect roof / HVAC / electrical / plumbing capex.
Questions for the listing agent
- Built in 1930 — when were the roof, HVAC, electrical panel, plumbing, and water heater last replaced?
- Is there a deadline driving the sale (1031 exchange, divorce, estate, relocation)? That informs how much negotiation room exists.
- The area grade is low — what's the realistic commute time and amenity access for the typical tenant pool here? Any planned neighborhood developments (good or bad) we should know about?
- What's the average days-on-market for RENTAL listings here right now (not sales)? A rising rental-DOM trend means longer vacancies and softer asking-rent achievability than the comps imply.
- What's the recent tenant-quality profile in this submarket — average credit score on applications, eviction rate, late-payment / NSF rate, and stable-employment percentage? A property-management company in the area should have these aggregated.
- How much new for-sale + rental construction is in the pipeline within 1–3 miles? Heavy new supply typically softens prices + rents 12–24 months out; constrained supply supports both.
Investment metrics
- 1% rule
- 0.88% ✗
- Cap rate
- 6.35%
- Cash-on-cash
- 0.20%
- DSCR
- 1.01
- GRM
- 9.5
CMA / ARV
- ARV (on-the-fly)
- $183,168
- Comps found
- 12
Show comp detail 12 sales within ~0.75 mi
| Address | Dist | Beds/Ba | Sqft | Sold | Price | $/sf | Match |
|---|---|---|---|---|---|---|---|
| 2235 Joyce Ave | 0.16mi | 2/1.5 | 923 (+7%) | 1mo | $243,000 | $263 | 78 |
| 377 Linden Ave | 0.24mi | 2/1.0 | 900 (+4%) | 10mo | $183,000 | $203 | 74 |
| 103 Joyce Ave | 0.15mi | 2/1.0 | 970 (+12%) | 1mo | $150,000 | $155 | 72 |
| 2116 Joyce Ave | 0.34mi | 2/1.0 | 944 (+9%) | 6mo | $226,000 | $239 | 63 |
| 225 Beech Rd | 0.31mi | 2/1.0 | 955 (+10%) | 6mo | $180,000 | $188 | 63 |
| 2115 Joyce Ave | 0.35mi | 2/1.0 | 936 (+8%) | 8mo | $198,000 | $212 | 63 |
| 7 E Ridge Pl | 0.50mi | 2/1.0 | 832 (-4%) | 11mo | $167,500 | $201 | 62 |
| 2122 Joyce Ave | 0.32mi | 3/1.5 (+1) | 944 (+9%) | 2mo | $233,000 | $247 | 61 |
| 2106 New Linden Rd | 0.37mi | 2/1.0 | 936 (+8%) | 14mo | $220,000 | $235 | 57 |
| 221 Electric Ave | 0.24mi | 3/1.0 (+1) | 952 (+10%) | 14mo | $168,500 | $177 | 55 |
| 249 Bluegrass Ave | 0.41mi | 1/1.5 (-1) | 936 (+8%) | 7mo | $150,000 | $160 | 54 |
| 25 Greenwood Ave | 0.65mi | 3/2.0 (+1) | 825 (-4%) | 7mo | $325,000 | $394 | 48 |
Match score weights: distance 35% · size 25% · config 20% · recency 20%. Top-matched comps best support the ARV.
Projected returns pro-forma
-3.0% appreciation · 4.64% rent growth · sell at horizon
- IRR
- -14.1%
- Equity multiple
- 0.49×
- Total profit
- $-26,671
- Equity at exit
- $27,584
- IRR
- -2.9%
- Equity multiple
- 0.79×
- Total profit
- $-10,824
- Equity at exit
- $15,995
Cash invested: $51,800 (down + closing). Projections, not guarantees.
Landlord ↔ Tenant lean methodology
- Overall (STATE)
- 83 Strongly Landlord-Friendly
- State Kentucky
- 83 Strongly Landlord-Friendly · R+16
- County
- — inherits STATE
- City
- — inherits STATE
ZIP-level market 41071
- Rents YoY
- 4.6%
- Active inventory
- 239
- Price-to-rent
- 9.5×
Monthly cashflow live
- Estimated rent
- $1,629 high interval (Pro) →
- Mortgage (P&I)
- −$970
- Tax est. 1.5%
- −$231 /mo · $2,775/yr
- Insurance
- −$77
- HOA
- −$0
- Lot rent
- −$0
- Vacancy / Maint / Mgmt
- −$342
- Net cashflow
- $9
Break-even live
Sensitivity live
| Price | -10% $136 | -5% $73 | +0% $9 | +5% $-55 | +10% $-119 |
|---|---|---|---|---|---|
| Rent | -10% $-120 | -5% $-56 | +0% $9 | +5% $73 | +10% $137 |
| Rate | -1.0pp $102 | -0.5pp $56 | base $9 | +0.5pp $-39 | +1.0pp $-88 |
UW: 25.0% down · 7.5% · 30yr · 1.5% tax · 5.0% vac · 8.0% maint · 8.0% mgmt
Financing live
Cash to close
- Down payment
- $46,250
- Closing costs
- $5,550
- Reserves months
- —
- Total cash needed
- —
Loan-product check · same deal, 3 products live
Conventional
25% down · 7.5% · 30yr
- Down + closing
- —
- Monthly P&I
- —
- Monthly cashflow
- —
- DSCR
- —
- Eligible?
- —
Personal DTI + credit; lowest rate.
DSCR
20% down · 8.5% · 30yr
- Down + closing
- —
- Monthly P&I
- —
- Monthly cashflow
- —
- DSCR
- —
- Eligible?
- —
No personal income docs; deal must DSCR.
Hard money
10% down · 12.0% · 12mo
- Down + closing
- —
- Monthly P&I
- —
- Monthly cashflow
- —
- DSCR
- —
- Eligible?
- —
Short-term bridge; refi at stabilization.
Rent comps 13 comps
| Address | Beds | Baths | Sqft | Rent | $/sqft | DOM | Units | Dist |
|---|---|---|---|---|---|---|---|---|
| 2335 Alexandria Pike Southgate, KY | 2.0 | 1.0 | 557 | $1,140 | $2.04 | 4d | 17 | 0.19mi |
| 3949 Vision CIR Southgate, KY | 1.0–2.0 | 1.0–2.0 | 1132 | $2,515 | $2.22 | 0d | 9 | 0.21mi |
| 35 Gettysburg Square Rd Fort Thomas, KY | 1.0–2.0 | 1.0 | 800 | $1,630 | $2.04 | 0d | 28 | 0.68mi |
| 926 Ravine Cir Southgate, KY | 1.0–3.0 | 1.0–2.0 | 954 | $1,371 | $1.44 | 0d | 7 | 0.71mi |
| 40 Edwards Ct Fort Thomas, KY | 2.0 | 1.0 | 1013 | $2,100 | $2.07 | 4d | 1 | 0.79mi |
| 1700 Aspen Pines Dr Wilder, KY | 1.0–3.0 | 1.0–2.5 | 1420 | $1,895 | $1.33 | 0d | 14 | 1.08mi |
| 1114 Columbia St Unit 2 Newport, KY | 1.0 | 1.0 | 925 | $1,550 | $1.68 | 46d | 1 | 1.18mi |
| 920 Washington Ave Unit 10 Newport, KY | 1.0 | 1.0 | 600 | $955 | $1.59 | 26d | 1 | 1.28mi |
| 24 Woodland Hills Dr #11 Southgate, KY | 2.0 | 2.0 | 950 | $1,445 | $1.52 | 10d | 1 | 1.32mi |
| 911 Putnam St #2 Newport, KY | 2.0 | 1.0 | 1000 | $1,600 | $1.60 | 23d | 1 | 1.35mi |
| 835 York St Unit 2 Newport, KY | 1.0 | 1.0 | 1000 | $1,295 | $1.29 | 19d | 1 | 1.40mi |
| 1914 Eastern Ave Apt 1 Covington, KY | 2.0 | 1.0 | 750 | $1,200 | $1.60 | 26d | 1 | 1.49mi |
| 1914 Eastern Ave Apt 3 Covington, KY | 1.0 | 1.0 | 900 | $995 | $1.11 | 17d | 1 | 1.49mi |
Listing history 16 events
-
2026-06-22days on market $185,000 Active 22 DOM
-
2026-06-21days on market $185,000 Active 21 DOM
-
2026-06-18days on market $185,000 Active 18 DOM
-
2026-06-17days on market $185,000 Active 17 DOM
-
2026-06-16days on market $185,000 Active 16 DOM
-
2026-06-16remarks 441-char remark
-
2026-06-15days on market $185,000 Active 15 DOM
-
2026-06-13days on market $185,000 Active 13 DOM
-
2026-06-13days on market $185,000 Active 12 DOM
-
2026-06-09days on market $185,000 Active 9 DOM
-
2026-06-08days on market $185,000 Active 8 DOM
-
2026-06-07days on market $185,000 Active 7 DOM
-
2026-06-03days on market $185,000 Active 3 DOM
-
2026-06-02days on market $185,000 Active 2 DOM
-
2026-06-01remarks 413-char remark
-
2026-06-01$185,000 Active 1 DOM
ⓘ Source: listings_history table (triggers on properties + properties_extension) + one-shot
backfill from property_details.listing_events for pre-trigger history.
Climate risk First Street
- Flood 1/10 Low FEMA zone X (unshaded) · 0% chance over 30 yrs
- Wildfire 1/10 Low
- Heat 4/10 Moderate 7 d/yr ≥103°F today · 19 d/yr by 30 yrs out
- Wind 2/10 Low 100% chance of damaging wind over 30 yrs
- Air quality 3/10 Moderate 2 unhealthy d/yr today · 3 by 30 yrs out
Nearby sold comps map
Loading sold comps map…
Walkable amenities ~0.75 mi
Loading nearby amenities…
Taxation est. · year 1
- Rental income
- $19,551
- − Mortgage interest
- −$10,363
- − Property taxes
- −$2,775
- − Insurance
- −$925
- − Repairs & maintenance
- −$1,564
- − Management
- −$1,564
- − Depreciation
- −$5,382
- Taxable loss
- −$3,022
- Est. tax savings @ 24.0%
- +$725
- After-tax cash flow
- $829/yr
For passive investors: Depreciation is non-cash, so a rental often shows a tax loss while cash-flowing — sheltering income. Rental losses are passive: they offset passive income freely, and up to $25,000/yr can offset ordinary (W-2) income if you actively participate and your MAGI is under $100k (phasing out to $0 by $150k); unused losses carry forward. On sale, claimed depreciation is recaptured at up to 25%, and gains may owe capital-gains tax (a 1031 exchange can defer both). Figures are a year-1 estimate at your 24.0% rate — not tax advice; consult a CPA.
Schools (NCES district)
- District
- Southgate Independent
- NCES district ID
- 2105460
- Math proficiency
- 35% ▼ -5.00%
- Reading proficiency
- 55% ▲ 5.00%
- Median HH income
- $49,230
- Composite
- 40.75/100
- National rank
- #7579
- State rank
- #119 of 173 in KY
Livability — Southgate
- Score
- 85/100
- State rank
- #45
- US rank
- #513
Category grades
Schools grade is shown separately in the Schools card above.
Census & demographics
- Census place
- Southgate, KY
- County
- Campbell County · 84,793 people
- Metro
- Cincinnati, OH-KY-IN
- Population (ZIP)
- 19,680
- Household income
- $59,976
- Rent vs Own
- Severe rent burden
- 1136.0
Population outlook (Campbell County) Hauer SSP2
- Today (2025)
- 95,668 people
- By 2030
- 96,886 · +1.3%
- By 2040
- 97,734 · +2.2%
- By 2050
- 96,413 · +0.8%
- By 2075
- 90,211 · -5.7%
- By 2100
- 79,434 · -17.0%
Race, ethnicity, and origin ACS 2023
- Neighborhood character
- Predominantly White (84%)
- Race & ethnicity
- White 84% Black 7% Two or more races 6% Hispanic / Latino 5%
- Common ancestry
- Slovak 3% Lithuanian 2% Italian 2%
- Foreign-born
- 4% · Canada
- Languages at home
- 95% English-only · Spanish 3% Other Indo-European 1%
Political lean MEDSL · Campbell
- 2024 margin
- R (+19.7) · D 39.2% · R 58.9% · Other 1.9%
- 2008→2024 swing
- +1.2pp toward D · 2008: -20.9pp · 2024: -19.7pp
- All cycles
- 2024: R+19.7 2020: R+18.6 2016: R+24.5 2012: R+22.8 2008: R+20.9
Not yet ingested
- Civics
- —
Market trends
- HPI YoY
- ▼ -193.38%
- Current HPI
- 244.9069
- Rent YoY
- ▲ 4.64%
- Metro
- Cincinnati, OH-KY-IN
- State GDP YoY
- ▲ 1.81%
- F500 in state
- 4
Industry mix (Fortune 500 HQ in KY)
| Industry | F500 HQs | Revenue |
|---|---|---|
| Healthcare | 1 | $118B |
|
||
| Food / Beverage | 1 | $7B |
|
||
Price history
+122.9% since first listed6 events — show timeline
- 2026-05-31 Listed $185,000 NKMLS
- 2020-03-30 Sold (Public Records) $83,000 Public Records
- 2007-02-28 Listing Removed — NKMLS
- 2006-11-01 Sold (Public Records) $83,000 Public Records
- 2006-07-13 Listed $114,900 NKMLS
- 2006-05-26 Sold (Public Records) $83,000 Public Records
Property tax history
-5.9%/yrLatest (2025): $193 · -7.5% YoY. Source: county tax records.
Cash-flow waterfall
monthlySold comps — $/sqft
last 12 mo · ≤1 miLoading sold comps…