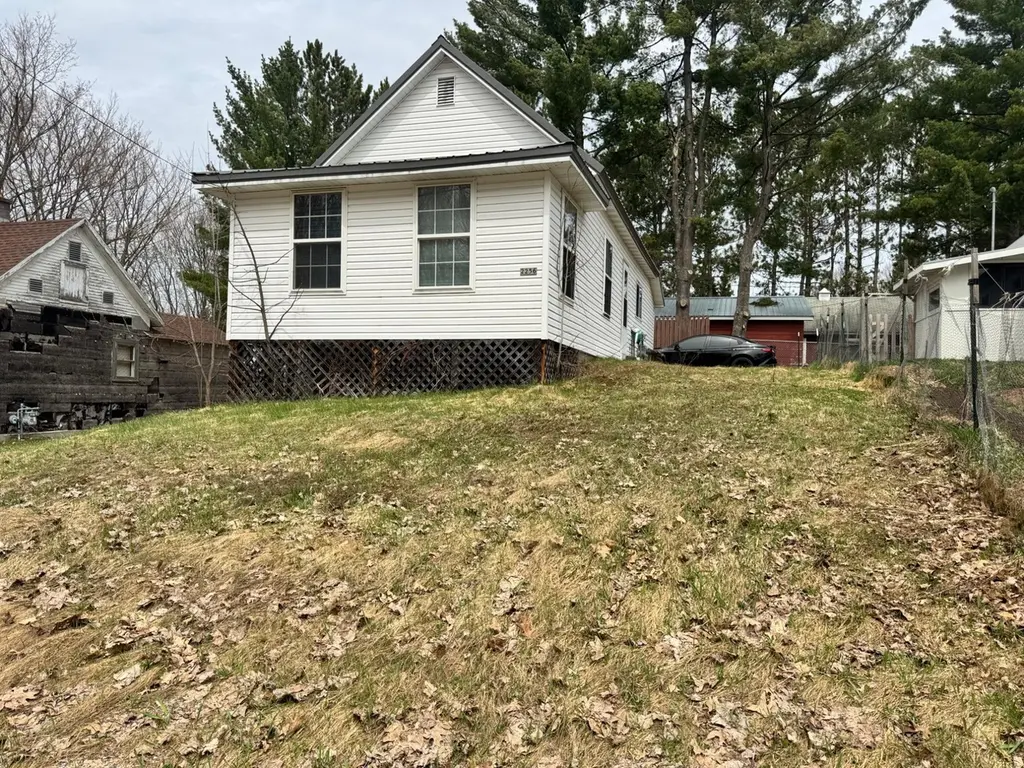
2256 Hill Rd · Phelps, WI
Flood risk 1/10 · Minimal
- FEMA flood zone
- X (unshaded)
- Chance of flooding over 30 yrs
- 0.0%
- Est. flood insurance / yr
- $473 – $860
Fire risk 3/10 · Minor
- Est. fire insurance / yr
- $636 – $1,182
Heat risk 1/10 · Minimal
- Hot days now (above 93°F)
- 7 days/yr
- Hot days in 30 yrs
- 12 days/yr
Wind risk 1/10 · Minimal
- Chance of severe wind over 30 yrs
- —
Air-quality risk 1/10 · Minimal
- Unhealthy air days now
- 0 days/yr
- Unhealthy air days in 30 yrs
- 0 days/yr
Risk factors via First Street. Map © Google.
Why this score? — see what drove the C grade
The composite is a weighted blend of 9 inputs, each scored 0–100. Each bar is that input's sub-score; the figure is the points it added to the 100-point composite (weight × sub-score).
- Cash flow +16.1/30.0
- ARV discount +14.8/15.0
- Appreciation +9.1/10.0
- DSCR +5.0/10.0
- Schools +3.4/10.0
- 1% rule +3.3/10.0
- Rent growth +2.5/5.0
- Livability +2.5/5.0
- Condition / age +2.5/5.0
$99,900
🖨 Deal sheet (PDF) 📄 Offer letter ✓ Due diligence
Listing remarks MLS
Located in the heart of downtown Phelps, this 2-bedroom, 1-bath home offers a smart, functional layout with efficient, low-maintenance living. The home has a strong rental history, making it a great opportunity for those seeking investment potential or a place to call their own. Recent updates include a newer steel roof and a furnace just 2 years old, helping keep maintenance simple and predictable. Conveniently located near local amenities, recreation, and year-round Northwoods activities. Don’t miss your chance to take a look.
Key facts
- 3,920 sq ft lot
- Listed 129 days
Neighborhood map
What this means for you Summary
Snapshot
- This is a 2-bed/1.0-bath other listed at $100k.
Deal economics
- At list price, monthly cash flow is $51 ($613/yr) — positive.
- The deal already cash-flows at list — no discount required.
- To meet the 1% rule (rent ≥ 1% of price), the offer needs to be $83k (17.3% below list).
- Recommended offer: $83k (17.3% below list) — sets the bar for 1% rule.
Location & tenants
- Location reads: area grade C — affects rentability + tenant quality, not the cash-flow math above.
- Phelps School District (rural): math 40% / reading 35% proficiency, ranked #302 of 426 in WI (top 71%) — families likely to look elsewhere, expect single-tenant / working-renter base with shorter leases.
- Market conditions: 38 active listings in the ZIP; 359 units permitted in Vilas County in 2024 (67 in 5+ unit buildings).
Forward outlook
- In year one you build about $9k of equity ($691 loan paydown + $8k appreciation (8.2% local appreciation)).
- Vilas County population projected at -25% by 2050 — secular population decline; favor cash flow + early exit over multi-decade hold.
- At projected returns (8.2% appreciation + 3.0% rent growth), your $28k cash investment doubles in ~3 years — after that, you're playing with house money.
- By year 4, paydown + projected appreciation supports a ~$31k cash-out refi (75% LTV) — recoverable capital for the next deal without selling this one.
Negotiation context
- It's been on market 129 days — a 12% lower offer ($88k) is reasonable based on typical stale-listing flexibility.
- 4 sale attempts since 4y ago; this cycle's ask has dropped $20k (17%) from the opening price — seller is motivated, your offer sets the floor, not the list.
- Current owner paid $70k; 43% above their basis — modest negotiation headroom, anchor on the comps not their cost.
Questions for the listing agent
- It's been on market 129 days. Have you received any prior offers? Is the seller open to a 17% concession, seller financing, or rate buy-down credit?
- Why hasn't it sold? Are there any deal-killer items the seller is aware of (foundation, flood, title, zoning, code violations)?
- Is there a deadline driving the sale (1031 exchange, divorce, estate, relocation)? That informs how much negotiation room exists.
- What's the average days-on-market for RENTAL listings here right now (not sales)? A rising rental-DOM trend means longer vacancies and softer asking-rent achievability than the comps imply.
- What's the recent tenant-quality profile in this submarket — average credit score on applications, eviction rate, late-payment / NSF rate, and stable-employment percentage? A property-management company in the area should have these aggregated.
- How much new for-sale + rental construction is in the pipeline within 1–3 miles? Heavy new supply typically softens prices + rents 12–24 months out; constrained supply supports both.
Investment metrics
- 1% rule
- 0.83% ✗
- Cap rate
- 6.91%
- Cash-on-cash
- 2.19%
- DSCR
- 1.10
- GRM
- 10.1
CMA / ARV
- ARV (median comp)
- $119,369
- List price
- $99,900
- Delta
- -16.31%
- Verdict
- UNDERPRICED
- Comps
- 8 within 1.0 mi
Projected returns pro-forma
8.25% appreciation · 3.0% rent growth · sell at horizon
- IRR
- 22.2%
- Equity multiple
- 2.64×
- Total profit
- $45,978
- Equity at exit
- $77,612
- IRR
- 20.2%
- Equity multiple
- 5.68×
- Total profit
- $130,982
- Equity at exit
- $155,725
Cash invested: $27,972 (down + closing). Projections, not guarantees.
Landlord ↔ Tenant lean methodology
- Overall (STATE)
- 73 Landlord-Friendly
- State Wisconsin
- 73 Landlord-Friendly · R+2
- County
- — inherits STATE
- City
- — inherits STATE
ZIP-level market 54554
- Home prices YoY
- 3.7%
- Active inventory
- 38
- Price-to-rent
- 10.1×
Monthly cashflow live
- Estimated rent
- $826 medium interval (Pro) →
- Mortgage (P&I)
- −$524
- Tax from tax record
- −$36 /mo · $430/yr
- Insurance
- −$42
- HOA
- −$0
- Vacancy / Maint / Mgmt
- −$173
- Net cashflow
- $51
Break-even live
Sensitivity live
| Price | -10% $108 | -5% $79 | +0% $51 | +5% $23 | +10% $-5 |
|---|---|---|---|---|---|
| Rent | -10% $-14 | -5% $18 | +0% $51 | +5% $84 | +10% $116 |
| Rate | -1.0pp $101 | -0.5pp $77 | base $51 | +0.5pp $25 | +1.0pp $-1 |
UW: 25.0% down · 7.5% · 30yr · 1.5% tax · 5.0% vac · 8.0% maint · 8.0% mgmt
Financing live
Cash to close
- Down payment
- $24,975
- Closing costs
- $2,997
- Reserves months
- —
- Total cash needed
- —
Loan-product check · same deal, 3 products live
Conventional
25% down · 7.5% · 30yr
- Down + closing
- —
- Monthly P&I
- —
- Monthly cashflow
- —
- DSCR
- —
- Eligible?
- —
Personal DTI + credit; lowest rate.
DSCR
20% down · 8.5% · 30yr
- Down + closing
- —
- Monthly P&I
- —
- Monthly cashflow
- —
- DSCR
- —
- Eligible?
- —
No personal income docs; deal must DSCR.
Hard money
10% down · 12.0% · 12mo
- Down + closing
- —
- Monthly P&I
- —
- Monthly cashflow
- —
- DSCR
- —
- Eligible?
- —
Short-term bridge; refi at stabilization.
Listing history 24 events
-
2026-06-21days on market $99,900 Active 129 DOM
-
2026-06-18days on market $99,900 Active 127 DOM
-
2026-06-17days on market $99,900 Active 126 DOM
-
2026-06-16days on market $99,900 Active 125 DOM
-
2026-06-15days on market $99,900 Active 124 DOM
-
2026-06-15days on market $99,900 Active 123 DOM
-
2026-06-13days on market $99,900 Active 122 DOM
-
2026-06-12days on market $99,900 Active 121 DOM
-
2026-06-09days on market $99,900 Active 118 DOM
-
2026-06-08days on market $99,900 Active 117 DOM
-
2026-06-08days on market $99,900 Active 116 DOM
-
2026-06-05days on market $99,900 Active 114 DOM
-
2026-06-03days on market $99,900 Active 112 DOM
-
2026-06-02days on market $99,900 Active 111 DOM
-
2026-06-01days on market $99,900 Active 110 DOM
-
2026-05-31days on market $99,900 Active 109 DOM
-
2026-03-05price $110,000 540-char remark
Show marketing remark (540 chars)
Located in the heart of downtown Phelps, this 2-bedroom, 1-bath home offers a smart, functional layout with efficient, low-maintenance living. The home has a strong rental history, making it a great opportunity for those seeking investment potential or a place to call their own. Recent updates include a newer steel roof and a furnace just 2 years old, helping keep maintenance simple and predictable. Conveniently located near local amenities, recreation, and year-round Northwoods activities. Don’t miss your chance to take a look.
-
2026-02-11$120,000 Active 540-char remark
Show marketing remark (540 chars)
Located in the heart of downtown Phelps, this 2-bedroom, 1-bath home offers a smart, functional layout with efficient, low-maintenance living. The home has a strong rental history, making it a great opportunity for those seeking investment potential or a place to call their own. Recent updates include a newer steel roof and a furnace just 2 years old, helping keep maintenance simple and predictable. Conveniently located near local amenities, recreation, and year-round Northwoods activities. Don’t miss your chance to take a look.
-
2024-05-03status Active
-
2024-05-03price $83,900
-
2024-03-13$93,900 Active
-
2022-10-04soldstatus $70,000
-
2022-09-28soldstatus $70,000
-
2022-08-25$70,000
ⓘ Source: listings_history table (triggers on properties + properties_extension) + one-shot
backfill from property_details.listing_events for pre-trigger history.
Tax reassessment forecast WI · Partial reset (capped growth)
- Current annual tax
- $430 · $36/mo
- Projected year-2 tax
- $1,139 · $95/mo
- Expected delta
- +$709/yr (+$59/mo · 164.9%)
ⓘ Screening estimate from a state-policy table — verify with the county assessor before closing.
Climate risk First Street
- Flood 1/10 Low FEMA zone X (unshaded) · 0% chance over 30 yrs
- Wildfire 3/10 Moderate
- Heat 1/10 Low 7 d/yr ≥93°F today · 12 d/yr by 30 yrs out
- Wind 1/10 Low
- Air quality 1/10 Low 0 unhealthy d/yr today · 0 by 30 yrs out
Nearby sold comps map
Loading sold comps map…
Walkable amenities ~0.75 mi
Loading nearby amenities…
Taxation est. · year 1
- Rental income
- $9,911
- − Mortgage interest
- −$5,596
- − Property taxes
- −$430
- − Insurance
- −$500
- − Repairs & maintenance
- −$793
- − Management
- −$793
- − Depreciation
- −$2,906
- Taxable loss
- −$1,107
- Est. tax savings @ 24.0%
- +$266
- After-tax cash flow
- $879/yr
For passive investors: Depreciation is non-cash, so a rental often shows a tax loss while cash-flowing — sheltering income. Rental losses are passive: they offset passive income freely, and up to $25,000/yr can offset ordinary (W-2) income if you actively participate and your MAGI is under $100k (phasing out to $0 by $150k); unused losses carry forward. On sale, claimed depreciation is recaptured at up to 25%, and gains may owe capital-gains tax (a 1031 exchange can defer both). Figures are a year-1 estimate at your 24.0% rate — not tax advice; consult a CPA.
Schools (NCES district)
- District
- Phelps School District
- NCES district ID
- 5511710
- Math proficiency
- 40% ▲ 10.00%
- Reading proficiency
- 35% ▲ 5.00%
- Median HH income
- $37,803
- Composite
- 33.79/100
- National rank
- #10394
- State rank
- #302 of 426 in WI
Livability — Phelps
No livability data for this city. (Only ~50 U.S. cities are tracked.)
Census & demographics
- Population (ZIP)
- 1,099
Population outlook (Vilas County) Hauer SSP2
- Today (2025)
- 20,499 people
- By 2030
- 19,683 · -4.0%
- By 2040
- 17,559 · -14.3%
- By 2050
- 15,407 · -24.8%
- By 2075
- 13,010 · -36.5%
- By 2100
- 10,937 · -46.6%
Race, ethnicity, and origin ACS 2023
- Neighborhood character
- Predominantly White (90%)
- Race & ethnicity
- White 90% Two or more races 7% Hispanic / Latino 3% Native American 2% Asian 1%
- Common ancestry
- Romanian 13% Portuguese 6% Iranian 1%
- Foreign-born
- 2%
- Languages at home
- 98% English-only · Spanish 1% Tagalog/Filipino 1%
Political lean MEDSL · Vilas
- 2024 margin
- Strong R (+23.1) · D 38.0% · R 61.1%
- 2008→2024 swing
- -19.0pp toward R · 2008: -4.1pp · 2024: -23.1pp
- All cycles
- 2024: R+23.1 2020: R+21.9 2016: R+25.3 2012: R+13.1 2008: R+4.1
Not yet ingested
- Civics
- —
Market trends
- HPI YoY
- ▲ 8.25%
- Current HPI
- 232.9527
- Rent YoY
- —
- Metro
- —
- State GDP YoY
- ▲ 2.10%
- F500 in state
- 20
Industry mix (Fortune 500 HQ in WI)
| Industry | F500 HQs | Revenue |
|---|---|---|
| Industrial Machinery | 4 | $23B |
|
||
| Industrial Technology | 2 | $36B |
|
||
| Insurance | 1 | $36B |
|
||
| Professional Services | 1 | $19B |
|
||
| Utilities | 1 | $9B |
|
||
| Consumer Goods | 1 | $3B |
|
||
Price history
+57.1% since first listed8 events — show timeline
- 2026-03-05 Price Changed $110,000 GNMLS
- 2026-02-11 Listed $120,000 GNMLS
- 2024-05-03 Relisted — GNMLS
- 2024-05-03 Price Changed $83,900 GNMLS
- 2024-03-13 Listed $93,900 GNMLS
- 2022-10-04 Sold (Public Records) $70,000 Public Records
- 2022-09-28 Sold (MLS) $70,000 GNMLS
- 2022-08-25 Listed $70,000 GNMLS
Property tax history
+3.4%/yrLatest (2025): $430 · +8.2% YoY. Source: county tax records.
Cash-flow waterfall
monthlySold comps — $/sqft
last 12 mo · ≤1 miLoading sold comps…